Organization Dashboard
You can view various statistics related to an organization, such as health status, risk level, recent alerts, activity summary, and more. These insights help you better understand the security posture of the organization and identify any potential vulnerabilities or areas for improvement.
To view the Organization Dashboard, click Dashboard in the left navigation pane to open the MSP dashboard, then click an organization name to open the Organization Dashboard for it.
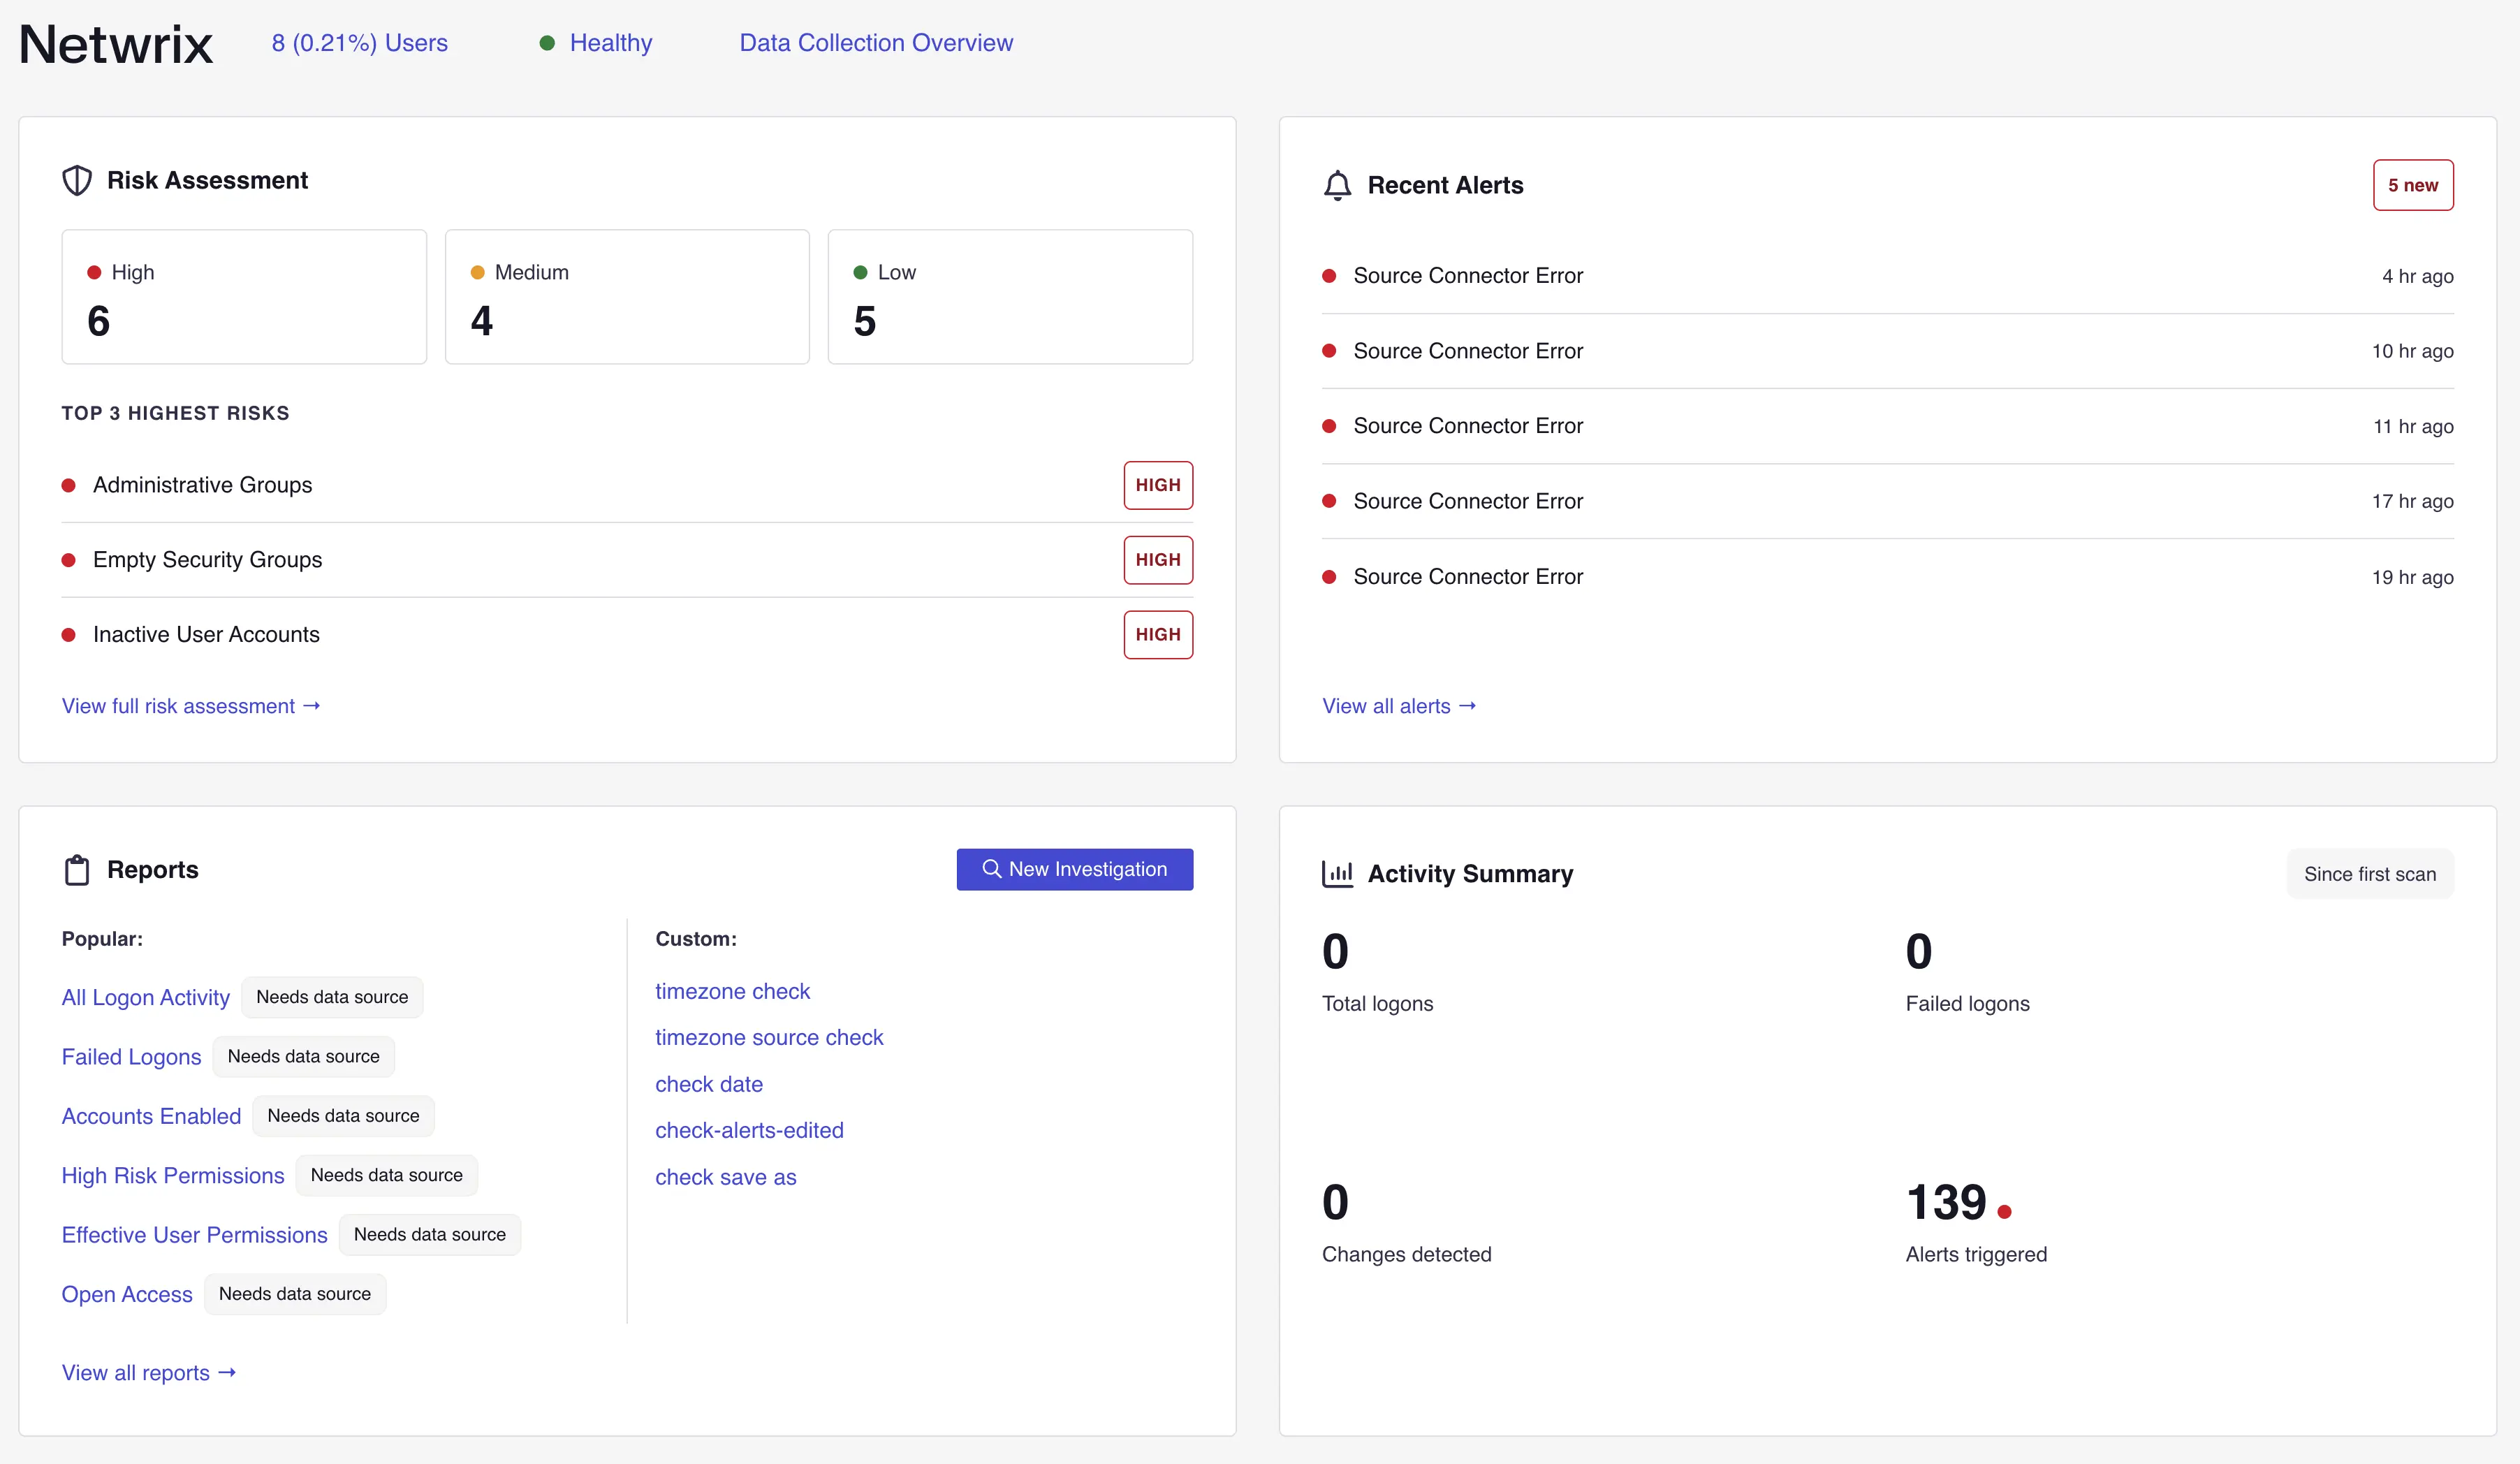
You can view the following insights for an organization.
Users
The Users value displays the total number of unique identities discovered in the organization. For organizations managed by an MSP, the percentage share of users relative to all managed organizations also appears. Click the value to navigate to the Billable Users page. See the System Reports topic for additional information.
Health Status
The Health Status value displays the current health status of the organization, which can be: Healthy, Trial in Progress, New, Update Recommended, Needs Attention, Experiencing Issues, Offline, Disabled, Not Configured, and Pending Deletion. Click the health status to navigate to the configuration page of the organization.
Data Collection Overview
Click Data Collection Overview to navigate to the data collection page for the organization, where you can review the status of all configured data sources and connectors.
Risk Assessment
This card displays the risk level for the organization broken down by severity: High, Medium, and Low. It also lists the top three highest risks detected. Click a severity count or View full risk assessment to navigate to the Risk Assessment page for the selected organization. See the Risk Assessment Dashboard topic for additional information.
Recent Alerts
This card displays the five most recent alerts triggered for the organization, with the time elapsed since each alert was triggered. Click View all alerts to navigate to the Alerts Timeline page. See the Alerts Timeline topic for additional information.
Reports
This card provides quick access to reports and investigations for the organization.
- Popular — Links to commonly used reports, such as All Logon Activity, Failed Logons, and Accounts Enabled.
- Custom — Links to custom reports you have previously saved for the organization.
- New Investigation — Click to navigate to the New Investigation page where you can create a new custom report. See the Custom Reports topic for additional information.
- View all reports — Click to navigate to the full reports list.
Activity Summary
This card displays a summary of activity for the organization since the first scan. It shows the following metrics:
- Total logons — The total number of logon events recorded.
- Failed logons — The total number of failed logon attempts.
- Changes detected — The total number of changes made to monitored objects.
- Alerts triggered — The total number of alerts triggered.
Most Logon Activity
This card displays a bar chart highlighting the accounts with the highest number of logon attempts to the environment during the past 7 days. A bar represents each account. Hover over a bar to view the exact number of logon attempts for that account. Click a bar to navigate to the Activity page, where you can view the complete All Logon Activity report. See the Activity Reports topic for additional information on the All Logon Activity report.
Who Made Most Changes
This card displays a bar chart highlighting the users who made the most changes to the environment during the past 7 days. A bar represents each user account. Hover over a bar to view the exact number of changes by that user account. Click a bar to navigate to the Activity page, where you can view the complete Changes by User report. See the Activity Reports topic for additional information on the Changes by User report.
Failed Logon Activity Trend
This card displays a line chart illustrating the number of failed logon attempts to the environment during the past 3 months. Hover over a point on the chart to view the exact number of failed logon attempts on any specific date. Click a point on the chart to navigate to the Activity page, where you can view the complete Failed Logons report. See the Activity Reports topic for additional information on the Failed Logons report.
Changes By Date
This card displays a line chart illustrating the number of changes made to monitored objects during the past 3 months. Hover over a point on the chart to view the exact number of changes made on any specific date. Click a point on the chart to navigate to the Activity page, where you can view the complete Changes by Date report. See the Activity Reports topic for additional information on the Changes by Date report.