Host Discovery Queries
The Host Discovery Queries Pane contains a list of previously-configured queries.
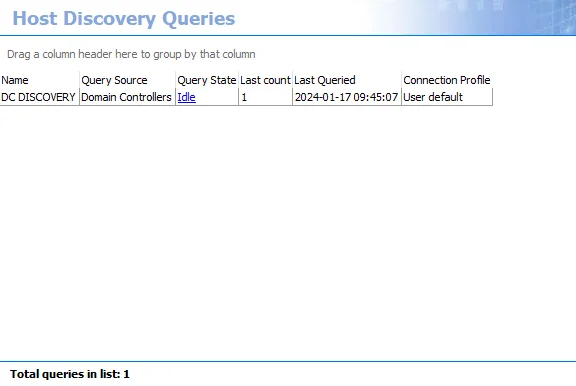
The list of previously configured queries is provided in a table format with the following columns:
-
Name – Displays the name assigned to the query during creation
-
Query Source – Identifies where the query searches for hosts
-
Query State – Displays the query’s current status (active or idle)
-
Last count – Identifies the number of hosts found from the last scan
-
Last Queried – Displays the date and time stamp for the last running of the query
-
Connection Profile – Identifies the Connection Profile assigned to the query for access to the Query Source
-
ID – GUID of the query task
-
SANode – Name of the Enterprise Auditor Console server
-
Snapshot mode – Identifies the type of discovery query:
- Cumulative – Grows the host list by appending newly discovered hosts with each query execution
- Snapshot – Only shows host found during the most recent query execution
noteThe Snapshot mode is configured on the Options page of the Host Discovery Wizard.
View Hidden Columns
Follow the steps to view the hidden columns in the table:
Step 1 – Right-click a header in the table, which opens a context menu.
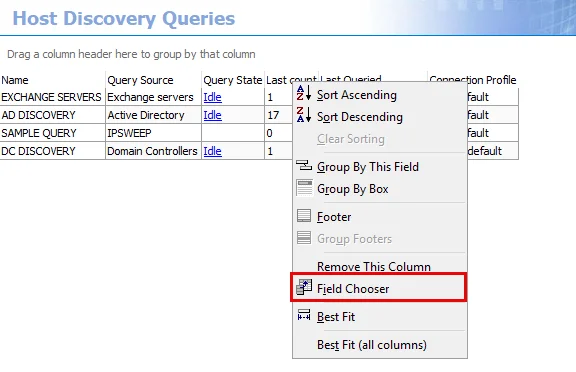
Step 2 – Select Field Chooser, which opens the Customization window.

Step 3 – Select the Columns tab.
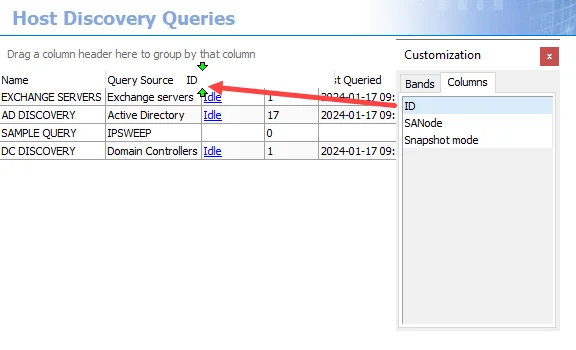
Step 4 – Drag and drop the desired column between any header of the table.
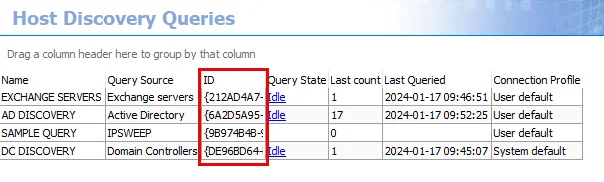
The header is now present in the table.