Actions Node
The Actions node uses Enterprise Auditor action modules to take action on collected and analyzed data. Action can be taken on objects leveraging collected data or analyzed data, for example from a listing of locked-out accounts, an action can be executed to unlock those accounts.
NOTE: Action modules are available with a special Enterprise Auditor license.

The Action Selection view lists all action tasks for the selected job. The listed information includes:
- Name – Name of the action task (as provided by the creator of the task)
- Description – Description of the action task (as provided by the creator of the task)
- Module – Name of the Enterprise Auditor action module
- Table – Name of the source table for the action

The Actions section at the top has five options:
-
Add from Library – Opens the Libraries window for adding and configuring pre-made action tasks
-
Create Action – Opens the Action Properties window for creating and configuring action tasks
-
Delete Action – Deletes the selected action task from the list
- This action does require confirmation
-
Action Properties – Opens the Action Properties window for the selected action task
- See the Action Properties Page topic for additional information
- See the Action Modules topic for additional information
NOTE: The AutoAction task appears in the Analysis Selection view, not in the Action Selection view.
-
Execute Action – Opens the Action Execution window and starts executing the selected action
- Does not require an action task to be checked, only selected

At the bottom of the Action Selection view, there are action buttons that apply to the table:
- Move Up – Moves the selected action task up the list, which is important since action tasks are executed in the order listed in the table
- Move Down – Moves the selected action task down the list, which is important since action tasks are executed in the order listed in the table
- Select All – Selects all action tasks in the table for execution
The Action Selection view also has its own right-click menu for taking action on the action task or the job.

The options for the Actions node right-click menu are:
- Create Action – Opens the Action Properties window
- Copy Action – Copies the selected action to the clipboard
- Paste Action – Opens the Action Properties window for modifying copied action tasks
- Delete Action – Deletes selected action task
- Properties – Opens the Action Properties window
- Execute Action – Opens the Action execution window and runs an action
- Run Job – Starts job execution for the selected job
- Add Instant Job – Opens the Instant Job Wizard
- Create Job (Ctrl + Alt + A) – Creates a new job at the same location as the selected job
Analysis Node
The Analysis node uses Enterprise Auditor analysis modules to run analysis tasks on collected data. There are two basic types of analysis modules. Most analysis modules correlate, format, and transform collected data into powerful data views for end-stage reports and graphs.
The Notification analysis module allows for the ability to send an email notice when a trigger is met, for example an email can be sent to an administrator to notify that disk space has reached a particular point (the trigger) and needs to be addressed before space runs out.
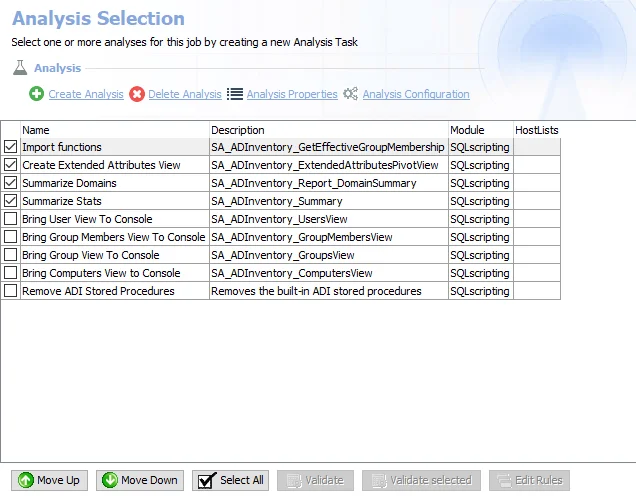
The Analysis Selection view lists all analysis tasks for the selected job. The listed information includes:
- Name – Name of the analysis task (as provided by the creator of the task)
- Description – Description of the analysis task (as provided by the creator of the task)
- Module – Name of the Enterprise Auditor analysis module
- HostLists – Indicates the analysis task is applicable to hosts found in the referenced host lists, applies to analysis modules that use host list filters, for example Business Rules analysis module

The Analysis section at the top has four options:
- Create Analysis – Opens the Analysis Properties window for creating and configuring analysis tasks
- Delete Analysis – Deletes the selected analysis task from the list
- This action does require confirmation
- Analysis Properties – Opens the Analysis Properties window for the selected analysis task
- See the Analysis Properties Page topic for additional information.
- See the individual analysis module sections in the Analysis Modules topic for additional information.
- Analysis Configuration – Opens the selected analysis task’s configuration window

At the bottom of the Analysis Selection view, there are action buttons that apply to the table:
- Move Up – Moves the selected analysis task up the list, which is important since analysis tasks are executed in the order listed in the table
- Move Down – Moves the selected analysis task down the list, which is important since analysis tasks are executed in the order listed in the table
- Select All – Selects all analysis tasks in the table for execution
- Validate – Validates all analysis tasks where the Business Rules analysis module was used
- Validate selected – Validates selected analysis tasks where the Business Rules analysis module was used
- Edit Rules – Edits the rule for selected analysis task where the Business Rules analysis module was used
The Analysis Selection view also has its own right-click menu for taking action on the analysis task or the job.
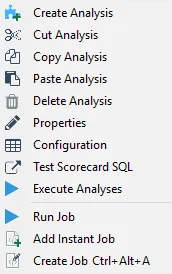
The options for the Analysis node right-click menu are:
- Create Analysis – Opens the Analysis Properties window
- Cut Analysis – Cuts selected analysis task
- Copy Analysis – Copies selected analysis task
- Paste Analysis – Pastes a copied/cut analysis task to the selected location
- Delete Analysis – Deletes selected analysis task
- Properties – Opens the Analysis Properties window
- Configuration – Opens the selected analysis task’s configuration window
- Test Scorecard SQL – Validates all analysis tasks where the Business Rules analysis module was used
- Execute Analyses – Executes or runs the checked (enabled) analysis tasks
- Run Job – Starts job execution for the selected job
- Add Instant Job – Opens the Instant Job Wizard
- Create Job (Ctrl + Alt + A) – Creates a new job at the same location as the selected job
Configure the Customizable Parameters in an Analysis Task
The parameters that can be customized and are listed in a section at the bottom of the SQL Script Editor. Follow the steps to customize an analysis task’s parameters.
Step 1 – Navigate to the Job’s Configure node and select Analysis.
Step 2 – In the Analysis Selection view, select the desired analysis task and click Analysis Configuration. The SQL Script Editor opens.
Step 3 – At the top of the SQL Script Editor, select Parameters.
NOTE: The image shown is a generic example. Table names and customizable parameters will change based on the Job.
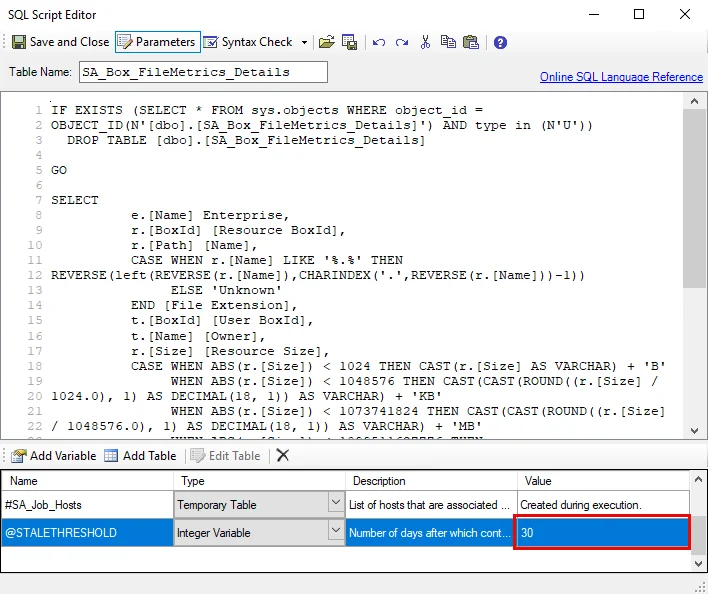
Step 4 – In the parameters section at the bottom of the editor, find the Value column.
CAUTION: Do not change any parameters where the Value states Created during execution.
- Double-click on the customizable value and change as desired
Step 5 – Click Save and Close to finalize the customization and close the SQL Script Editor.
Repeat the steps as needed to customize analysis parameters.
See the SQLscripting Analysis Module topic for additional information.
Hosts Node
The Hosts node provides the option to assign a preconfigured host list at the job level. It also provides a way to manually assign hosts to be targeted by the job using Host Selection pane.
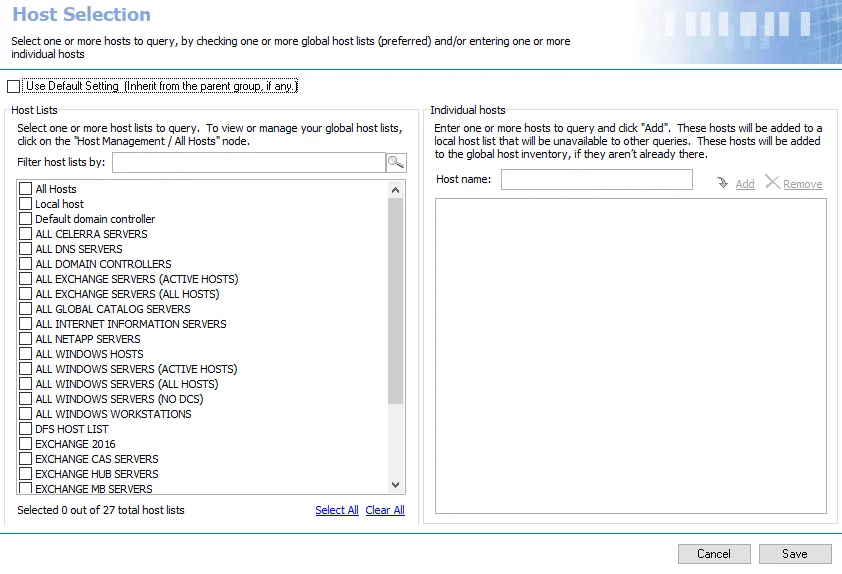
Use the default settings by selecting the Use Default Setting checkbox and inherit the job group’s assigned host lists. To break inheritance and assign host lists at the job level select from the available host lists.
Hosts added manually at the job level are added to the Master Host Table if not already there, and it triggers a host inventory query according to the global settings. The host will not be added to any individual host lists. See the Manually Add Hosts to a Job topic for additional information.
Click Save to apply any changes to the host selection. Changes are not implemented unless they are saved.
Manually Add Hosts to a Job
Hosts can be added manually at the job level even when inheritance (Use Default Setting) is used for host list assignment. The job targets the hosts in any assigned host lists as well as any manually added at the job level. Follow these directions to manually add a host to a job.

Step 1 – Navigate to the job’s Configure > Hosts node.
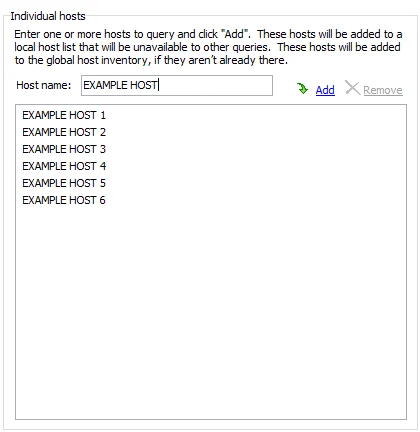
Step 2 – In the Individual hosts section of the Host Selection view, enter the Host name in the textbox and click Add.
Step 3 – Repeat the previous step for each host to be added.
Step 4 – Click Save and then OK to confirm the changes.
The manually added host is now targeted by the job.
Configure Node
Changes to configurations for the job’s assigned Host Lists, Queries, Analyses, Actions, and Reports are created through the [Job] > Configure node or through the Configure shortcut on the job’s Description page.
 |  |
| Configure Node | Configure link on job description page |
The sub-nodes under the [Job] > Configure node are:
- Hosts Node – Assign a host list at the job level or manually add hosts to be targeted by the job
- Queries Node – Select and configure a Enterprise Auditor data collector to scan targeted hosts
- Analysis Node – Create and configure Analysis and Notification tasks for collected data
- Actions Node – Create and configure Action tasks for taking action on collected and analyzed data
- Reports Node – Create and configure Reports to be generated during job execution
Configure Page
The job's Configure Page provides an overview with shortcuts for options that are configured in the job's Configure Node.
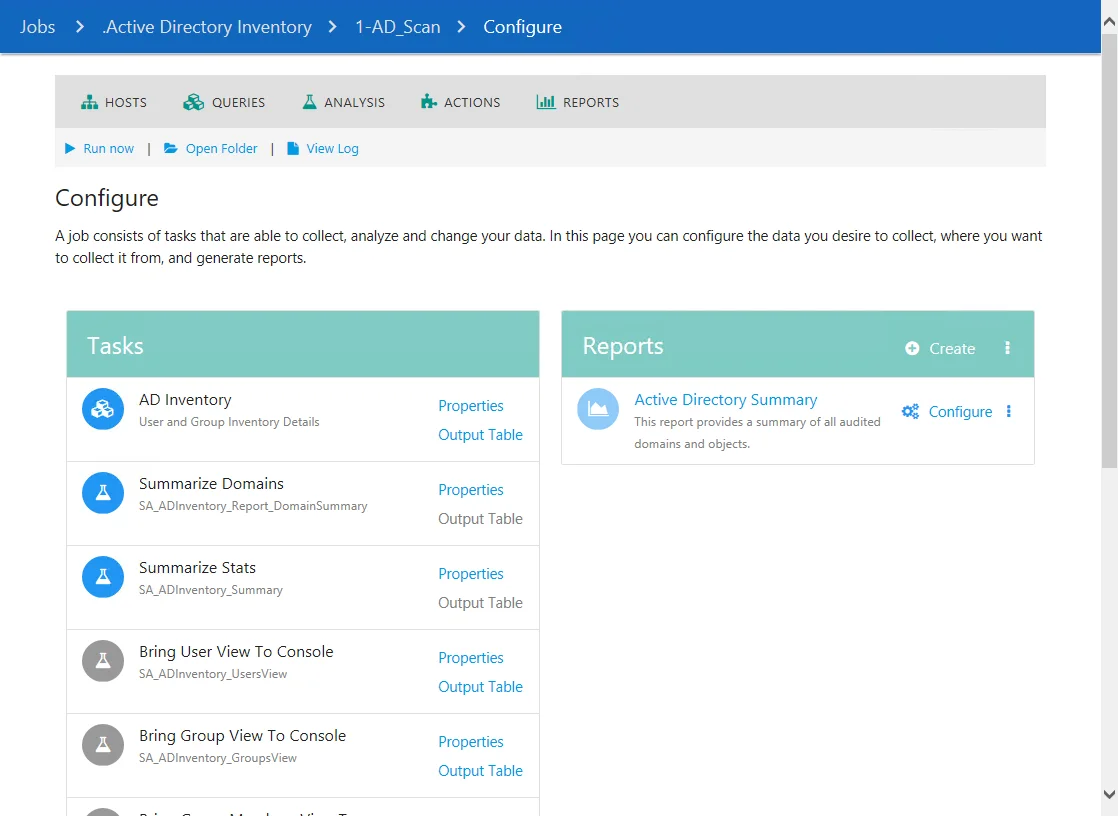
The options on the Configure Page are:
- Hosts - Navigates to the job's Hosts node
- Queries - Navigates to the job's Queries node
- Analysis - Navigates to the Analysis node
- Actions - Navigates to the Actions node
- Reports - Navigates to the Reports node
- Run Now - Executes the job
- Open Folder - Opens the job folder location with supporting files in the Windows Explorer
- View Log - Opens the job’s log
The options in the Configure section are:
-
Tasks - If applicable, displays a list of the job's Queries, Analysis Tasks, and Action Modules
- Click Properties to view the task's properties
- Click Output Table to view the Results for the task under the Results Node
-
Hosts - Lists the assigned hosts for the job
-
Reports - If applicable, displays a list of the job's Reports
- Click the reports name to access a report under the job's Results Node
- Click Configure to edit the report parameters in the Report Configuration Wizard
Queries Node
The Queries node uses a Enterprise Auditor data collector to run scans against the targeted hosts. Different data collectors are designed for different types of collection. It is necessary for the Connection Profile associated with the target hosts to have a sufficient level of rights for the selected data collector. See the Permissions by Data Collector (Matrix) topic for a chart with recommended permissions per data collector.
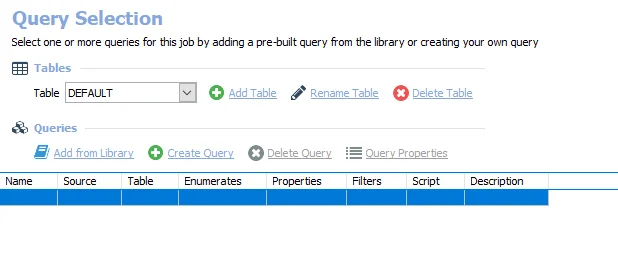
The Query Selection view lists all queries for the selected job. Though it is possible to have multiple queries in a single job, it is not usually recommended. The listed information includes:
- Name – Name of the query (as provided by the creator of the query)
- Source – Name of the Enterprise Auditor data collector
- Table – Name of the Native Data table
- Enumerates – Whether or not the data collector will return enumerated data, or multiple lines of
data per target host
- If Yes, only one query can write to a single table
- If No, then multiple related queries can write to a single table
- Properties – Number of the properties to be returned
- Filters – Number of in-line filters applied to the data being returned by the query
- Script – Whether or not a VB Script was added to the query
- If Yes, a VB Script was added to query execution
- If No, a VB Script was not added to query execution
- Description – Description of the query (as provided by the creator of the query)
Tables
Add and configure native data tables through the Tables section in the Query Selection view.

The Tables section at the top has three options:
-
Add Table – Adds an additional native data table and associated query to the selected job
-
Rename Table – Opens the Rename Table window for changing the native data table name
-
Delete Table – Deletes the selected table from the list, all associated query tasks, and the database table if it has already been created. This action does require confirmation.
CAUTION: Do not delete the last table in a job’s Query Selection view. Doing so will also delete the Messages table. In order to delete the last table, it is necessary to delete the job.
Queries
The Queries section is where the job’s preconfigured queries can be edited and where new queries can be added.

The Queries section has four options and includes the list of queries for the selected job:
- Add from Library – Opens the Libraries window to select preconfigured data collection queries. See the Add Query from Library topic for additional information.
- Create Query – Opens the Query Properties window for creating and configuring queries
- Delete Query – Deletes the selected query from the list. This action does require confirmation.
- Query Properties – Opens the Query Properties window for the selected query
- This option is used for query modifications
- See the Create or Modify a Query topic for additional information
- See the topics for the individual Data Collectors for additional information
Right-click Menu
The Query Selection view also has its own right-click menu for taking action on the queries, tables, or the job.
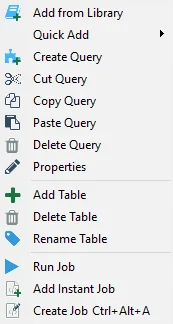
The options in the Queries node right-click menu are:
- Add from Library – Opens the Libraries window
- Quick Add – Quickly add a new query from a list of non-configured data collector queries
- Create Query – Creates a new query to be configured
- Cut Query – Cuts selected query
- Copy Query – Copies selected query
- Paste Query – Pastes a cut or copied query to the selected location
- Delete Query – Deletes a selected query
- Properties – Opens the Query Properties window
- Add Table – Adds a Native Data table to the selected query
- Delete Table – Deletes the selected table
- Rename Table – Opens the Rename Table window
- Run Job – Starts job execution for the selected job
- Add Instant Job – Opens the Instant Job Wizard
- Create Job (Ctrl + Alt + A) – Creates a new job at the same location as the selected job
Host List
Jobs with configured queries require a host list to be assigned. This can be done at either the Job Group or Job level. Whichever location is used to set the host list for query execution should also be the location where the Connection Profile is assigned. See the Job Properties topic for additional information.
- Job Groups
- Host List Assigned – [Job Group] > Settings > Host Lists Assignment. See the Host Lists Assignment topic for additional information.
- Connection Profile Selected – [Job Group] > Settings > Connection. See the Connection Node topic for additional information.
- Job Level
- Host List Assigned – [Job] > Configure > Hosts. See the Hosts Node topic for additional information.
- Connection Profile Selected – Connection tab of the Job’s Properties Window. See the Connection Tab topic for additional information.
Reports Node
The Reports node is for configuring reports to be generated during job execution.
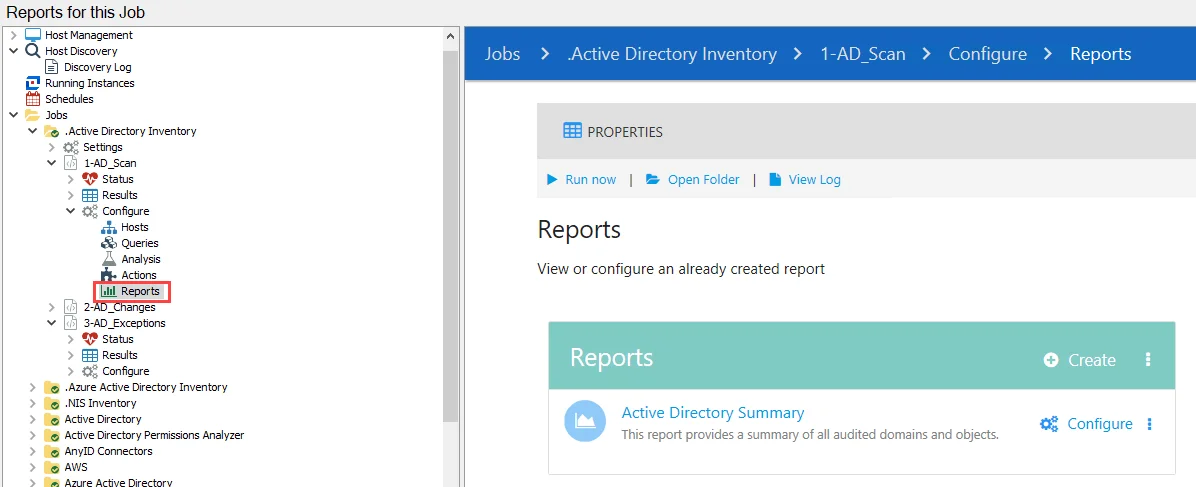
The Reports view lists any reports that have been configured for the selected job and options related to configuring reports. The options at the top of the Reports view are:
- Properties – Opens the Job Properties page for the job that the report is for
- Run Now – Runs the currently selected job that the report is for
- Open Folder – Opens the Report’s folder location with supporting files in the Windows Explorer
- View Log – Opens the log for the job that the report is for

The Reports table contains all of the configured reports for the job. The header row of the table contains the following options for adding reports to the table:
-
Create – Creates a new report for the selected job
- See the Creating a Report topic for additional information
-
Paste – Paste a cut or copied report into the selected job
- The paste option is accessed from the vertical ellipsis menu of the header row of the Reports table

Clicking on the name of a report opens it in the Results node. Clicking Configure next to a report's name opens the Report Configuration wizard for the report, see the Report Configuration Wizard topic for additional information. Additional options are available from the vertical ellipsis menu on a reports row:
- Generate – Generates the report
- Copy – Copies the report to the clipboard
- Delete – Deletes the report
Once a report is generated, it can be viewed in several locations depending on the configuration. Report configurations may also be copied to other reports to generate preferred outputs for alternate jobs. However, all generated reports can be viewed in the job’s Results node.
See the Reporting topic for additional information.
Create a New Job
Follow the steps to create a new job.
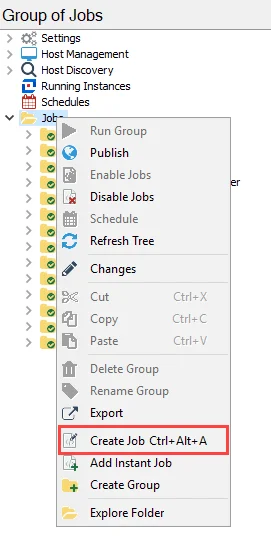
Step 1 – Select the Jobs tree or the desired job group to add the new job to. Right-click and select Create Job.

Step 2 – Provide a unique, descriptive name for the job. The default name is NewJob. Some
considerations for naming conventions:
CAUTION: Do not end a job name with a space.
- There can never be two jobs with the same name. Enterprise Auditor automatically appends a numeral
to the end of a job name to avoid duplicates, for example
NewJob1. - No special characters can be used. See the Microsoft Naming Conventions article for limitations.
- Jobs in a group are run alphanumerically
- When possible, keep names short to avoid report path errors caused by Microsoft’s maximum path length. See the Microsoft article referenced above.
The new job is now ready to be configured. See the Data Collectors, Analysis Modules, Action Modules, and Reporting topics for additional information.
Disable or Enable a Job
Job groups may contain individual jobs that should not be run when the entire job group is run. Some job groups also contain jobs that can optionally be run separately from the rest of the job group. Individual jobs can be disabled or enabled at the job group or job level. Disabled jobs do not execute when the parent job group is run.
If the role based access feature is enabled, the ability to enable and disable jobs is limited by the assigned role. See the Role Based Access topic for additional information.
Disable a Job
Jobs can be disabled from the Jobs tree. Disabled jobs cannot be run manually, through a scheduled task, or executed as part of the job group. Follow the steps to disable a job.
Step 1 – Select a job group or job.
NOTE: When disabling jobs at the job group level, all jobs contained in the job group are disabled, but the job group is not disabled. Any additional jobs added to that job group at a later time will be enabled by default.
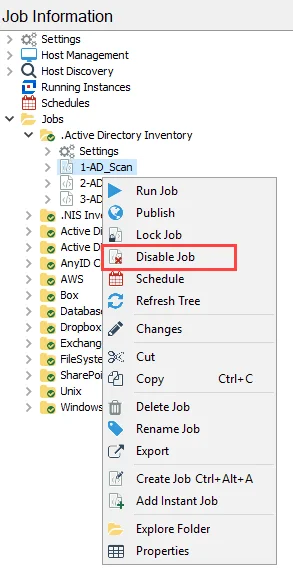
Step 2 – Right-click on the job group or job and select Disable Job(s) from the menu.

The job is now disabled. If a job group was selected, all the jobs in the group are now disabled. Disabled jobs are grayed out, and a red cross is displayed in front of the job.
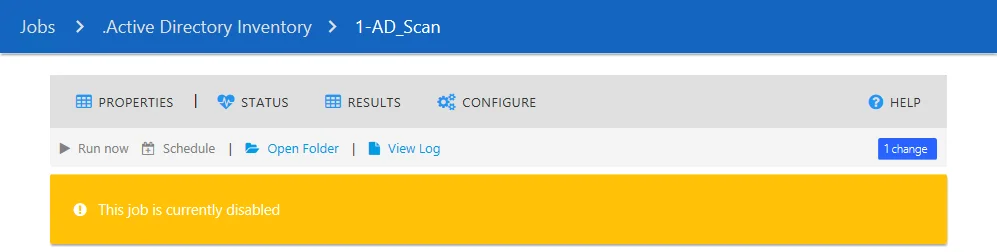
A yellow banner also notifies users that a job is disabled in the Job’s Description page.
Additionally, if a disabled job is run, a warning message appears in the Messages table stating:
[UserName] requested [JobName] to run but it is in a disabled state. Job statistics also do not
display on the job’s description page.
Enable a Job
Jobs that have been disabled can be enabled from the Jobs tree. Following the steps to enable a disabled job.
Step 1 – Select the disabled job. If multiple jobs in a job group are disabled, select the job group to enable all of the disabled jobs.
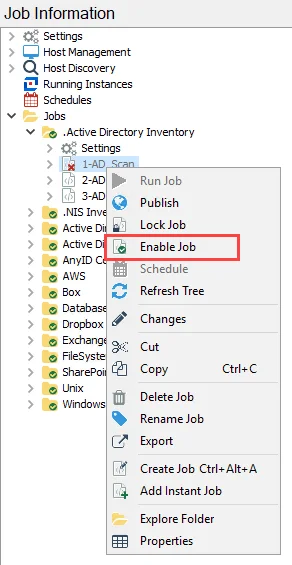
Step 2 – Right-click on the job group or job and select Enable Job(s) from the menu.
The job is now enabled. If a job group was selected, all the jobs in the group are now enabled.
Jobs
An Enterprise Auditor job is responsible for running data collection, conducting data analysis, executing actions on collected or analyzed data, or generating reports. Each of these are configured in the corresponding section under the job’s Configure node. A single job can be configured to execute one or multiple tasks. See the Configure Node topic for additional information.

RECOMMENDED: Use job group organization to spread these tasks across jobs. For example, create a job to run a query and a second job to run analysis or generate a report. Then use the job group structure to run those jobs together in the proper order.
Jobs do not have a Settings node like a job group. Job Properties provide the option to break inheritance on global or job group settings. See the Job Properties topic for additional information.
Once a job has been configured and is being executed, job progress can be viewed at the Running Instances node on the Navigation pane. See the Running Instances Node topic for additional information.
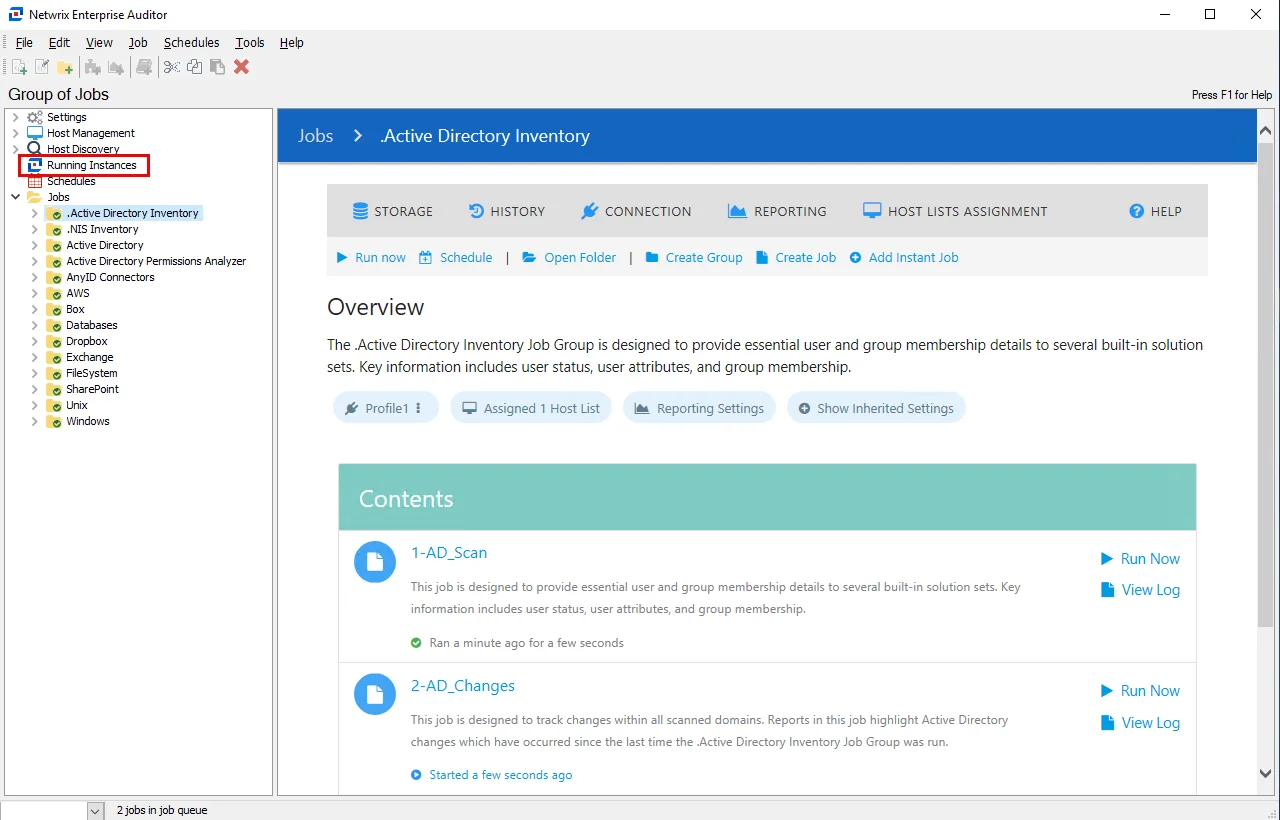
At the bottom of the Enterprise Auditor Console, there is an indication of how many jobs are in queue and the View Job Progress link, which opens the Running Instances node.
When a job execution has completed, the tables, views, and reports generated by the job are accessible under the job’s Status and Results nodes. See the Status Node and Results Node topics for additional information. Reports are also accessible through the Web Console.
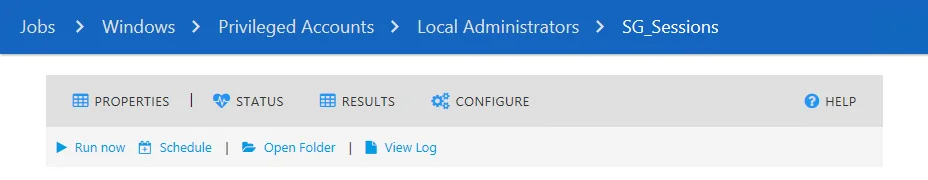
Job Description Page
The Job Description page displays shortcuts, links, and important information on the job. The Job Page allows users to view and modify common job configurations, such as Connection and Storage profiles, job properties, SQL analysis parameters, and PowerShell parameters. Depending on the type of job, the description page will appear different and display information specific to the job selected.
 |  |
|---|---|
| Pre-Configured Job | User-Created Job |
The two types of Job Groups in Enterprise Auditor are:
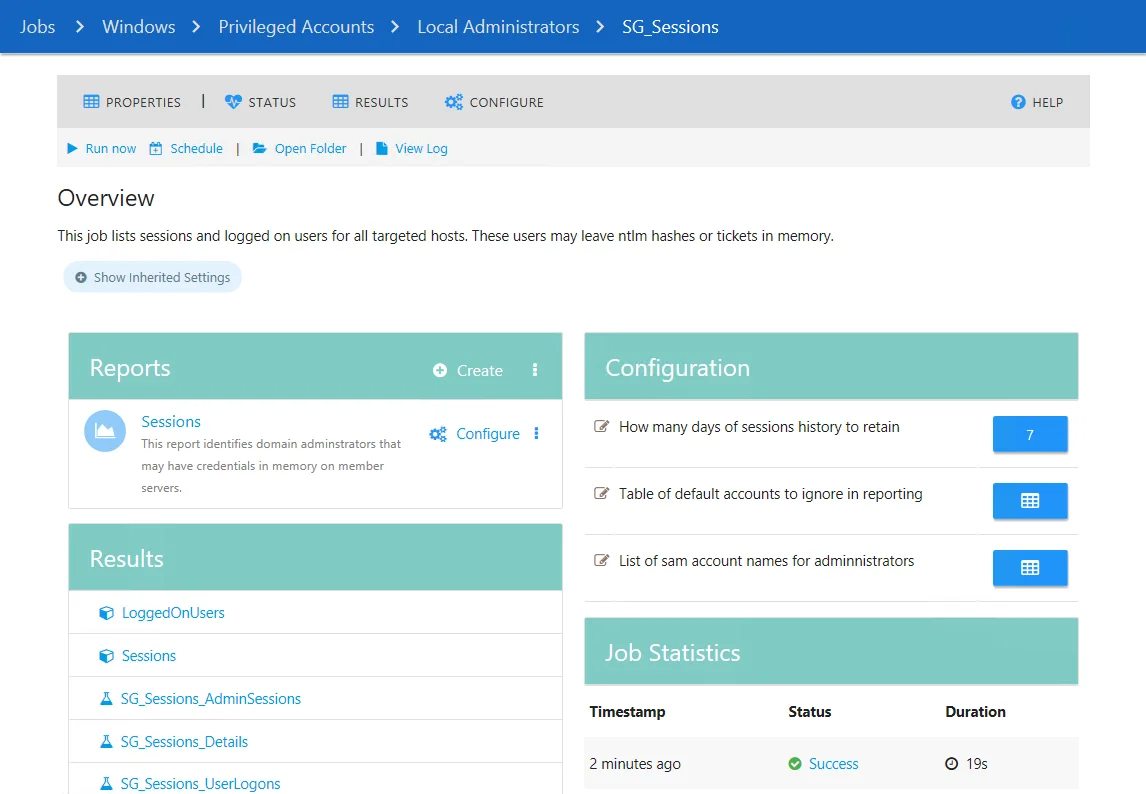
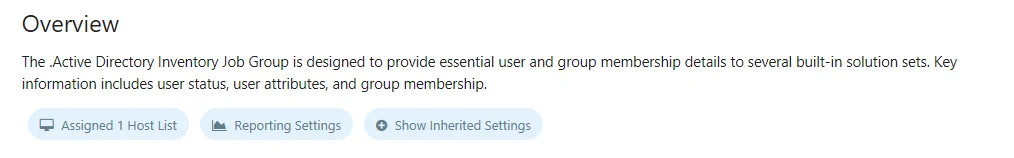
- Pre-configured – The job description page provides a brief summary of the purpose of the job, the reports and data contained within it, and summary information of the last five times the job was executed
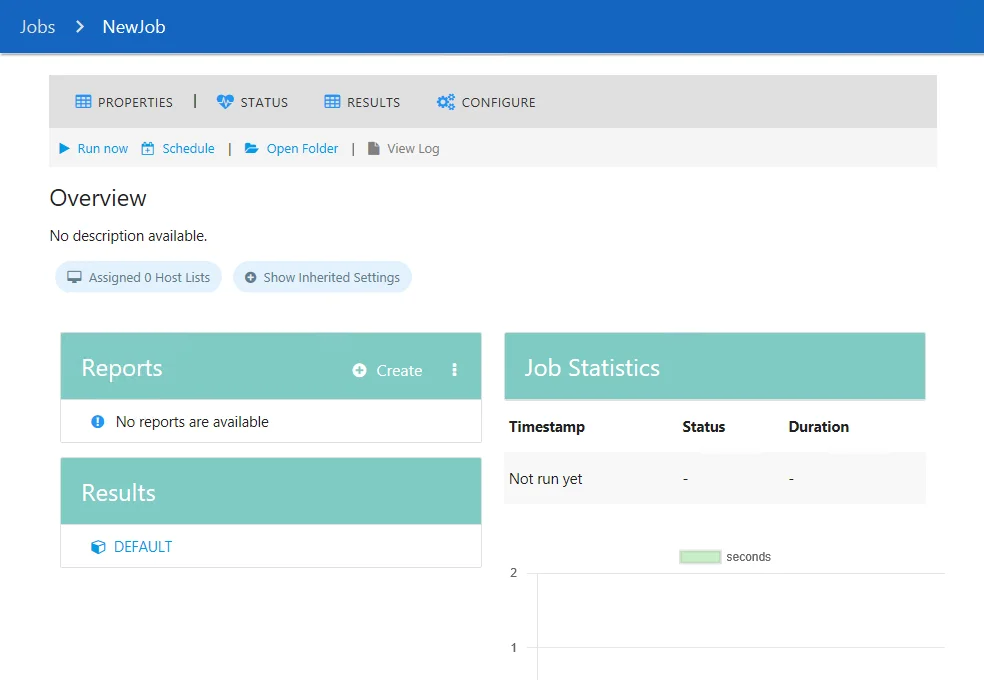
- User Created – The job description page of User Created jobs will be blank until the job is configured
Pre-configured job description pages provide users with shortcuts and links to many of the functions that can be accessed under the [Job Group] > [Job] node in the Jobs Tree in the Navigation Pane.
The sections and options of the job description page are:
- Properties – Opens the Job Properties window. See the Job Properties topic for additional information.
- Status – Opens the job Status page. See the Status Node topic for additional information.
- Results – Opens the job Results page. See the Results Node topic for additional information.
- Configure – Opens the job Configure page. See the Configure Node topic for additional information.
- Run Now – Executes the job
- Schedule – Opens the Schedule Wizard
- Open Folder – Opens the job folder location with supporting files in the Windows Explorer
- View Log – Opens the job’s log
The Overview section provides summary information about the job, and includes the following information:
-
Inherited settings – Job settings can be applied directly or inherited from a parent job group or even the General Settings level. See the Jobs with Inherited Settings topic for additional information.
-
Reports – Displays a list of reports that are generated by this job
-
Results – Displays a list of data tables and views created and populated by the job
-
Configuration - If applicable, configure parameters for the job's analysis tasks
- See the Parameter Configuration topic for additional information.
-
Job Statistics – Displays important information for the last five times the job was executed including:
- Timestamp – Date timestamp of when job was initiated
- Status – Displays information on job status (Running, Success, Error)
- Duration – Displays length of time each job took
-
Graph – Displays a line graph that has information for the last five times the job was executed
Prior to running any job or job group, ensure the following have been properly configured:
- Queries, Analysis, Actions, and Reports are configured as desired
- If collecting data, at least one host list has been assigned
- If a host list is assigned, the appropriate Connection Profile with credentials to collect data from the targeted hosts has been assigned
Finally, ensure these settings are configured at the recommended location for the job or job group and that the inheritance of settings is adjusted accordingly.
Jobs with Inherited Settings
Job settings can be applied directly or inherited from a parent job group or even the General Settings level. If settings are applied directly to a job, these are shown in the Overview section under the job description:
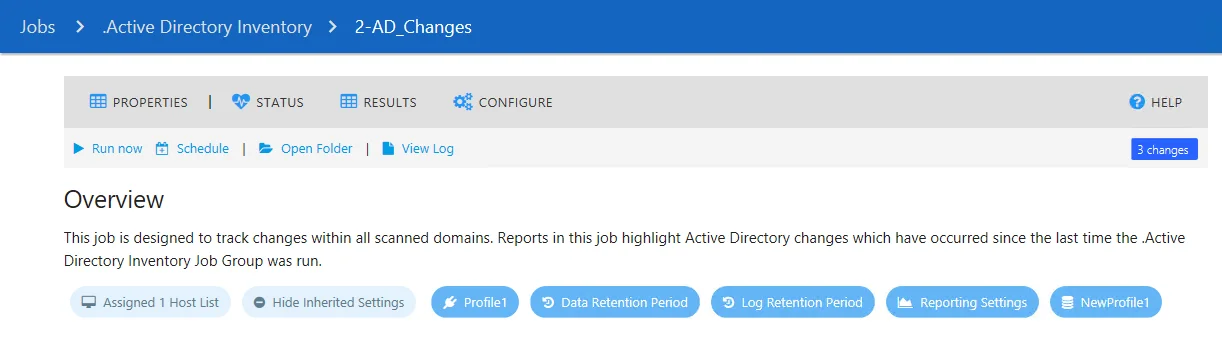
In the example above, the Assigned 1 Host List setting is applied directly to the job. Other settings are inherited from the parent job group. Clicking the Show inherited settings button opens this list of the inherited settings.
The following settings can be inherited from a parent:
| Setting | Description |
|---|---|
| Connection profile | The tooltip shows the account name used in the connection profile. Clicking the button opens the parent Connection settings for the selected job. See the Connection Node topic for additional information. Clicking the three dots menu on the right part of the button opens the Edit menu. The following options are available: - Edit the Profile – Clicking the link opens the Connection settings for the current profile - Use Default Profile – Clicking the link applies the connection profile set as default on a global level to a job. In this case, this setting will be hidden under the Show Inherited Settings button. - List of existing profiles – Allows switching between existing connection profiles and apply a desired one to a job |
| Data Retention Period | The tooltip shows the current value for the data retention period (by default, Never retain previous job data). Clicking the button opens the parent History settings for the selected job. See the History Node topic for additional information. |
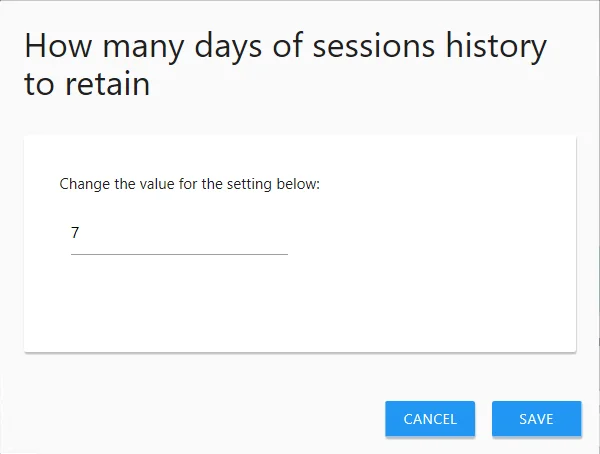
| Log Retention Period | The tooltip shows the current value for the log retention period (by default, Retain previous job log for 7 times). Clicking the button opens the parent History settings for the selected job. See the History Node topic for additional information. |
| Hosts Lists | The tooltip shows the number and the names of the host lists assigned to this job. If you have more than three host lists assigned to a job, the tooltip shows 3 hosts name and the number of other hosts lists assigned (for example, if 5 hosts are assigned it shows Host1, Host2, Host3 + 2 more). Clicking the button opens the parent Host Lists setting for the selected job. See the Hosts Node topic for additional information. |
| Reporting Settings | Clicking the Reporting Settings button opens the parent Reporting settings for the selected job including publishing options, email settings, and roles. See the Reporting Node topic for additional information. |
| Storage Profile | The tooltip shows the current SQL Server instance, database name, user account, and authentication type used for the selected job. See the Storage Node topic for additional information. Clicking the three dots menu on the right part of the button opens the Edit menu. The following options are available - Edit This Profile – Clicking the link opens the Storage settings for the current profile - Use Default Profile – Clicking the link applies the storage profile set as default on a global level to a job. In this case, this setting will be hidden under the Show Inherited Settings button - List of existing profiles – Allows switching between existing storage profiles and apply a desired one to a job |
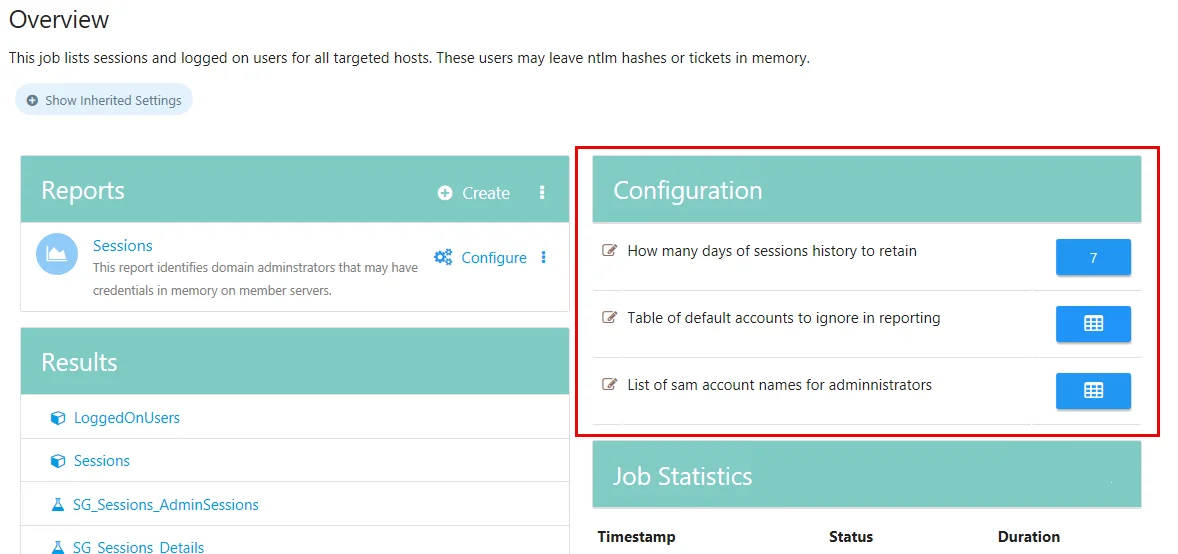
Parameter Configuration
If a job has analysis parameters that can be customized, those parameters can be configured in the Configuration section of the Job Description Page.
Follow the steps to configure customizable parameters using the Configuration option on the Job Description Page:
Step 1 – Navigate to the Jobs > [Job Group] > [Job] node. If the job has customizable parameters, they will be located under Configuration in the job's Overview section.
Step 2 – Click on a parameter to open the Parameter Configuration window.
NOTE: To view a tool-tip that contains information about the Variable Name and the Task Name that the parameter is associated with, hover the mouse over the parameter.
Step 3 – Configure the parameter in the Parameter Configuration window. Click Save to save changes and exit the window. Click Cancel to exit without saving.
The parameter has now been configured. The parameters can also be configured in the Analysis Node under the job's Configure Node. See the Analysis Node topic for additional information.
Auto Retry Tab
The Auto Retry tab provides the option to schedule the job to re-execute against hosts that match the selected host status values: Offline, Failed, Errors, and Warnings.
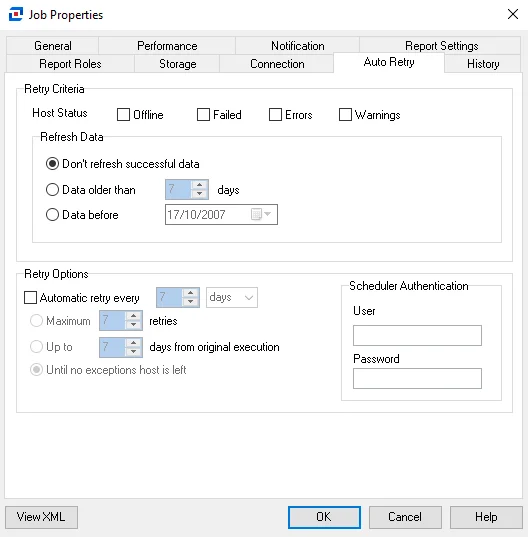
Check the desired Host Status values to generate a retry, and then configure the Refresh Data and Retry Options settings. Finally, enter a User name (domain\user) and Password in the Scheduler Authentication section.
NOTE: To update the password for an existing account, enter a new password in the Password field.
Click OK to save configuration changes and close the Job Properties window. Click Cancel if no changes were made.
Connection Tab
The Connection tab is for configuring the Connection Profile. Choose to use the default settings (the global configuration or configuration set via broken inheritance at a job group level), to use the system default (the account being used to run Enterprise Auditor), or to select another Connection Profile.
NOTE: It is a best practice to set the Connection Profile at the same level where the job’s host list is set. For example, if the host list is set under the job group’s Settings node, then that is where the Connection Profile should be configured. If the host list is set under the [Job] > Configure node, then this is where the Connection Profile should be configured.
Select the desired option to identify the required Connection Profile for the job. See the Connection Node topic for additional information for the three connection options.
Click OK to save configuration changes and close the Job Properties window. Click Cancel if no changes were made.
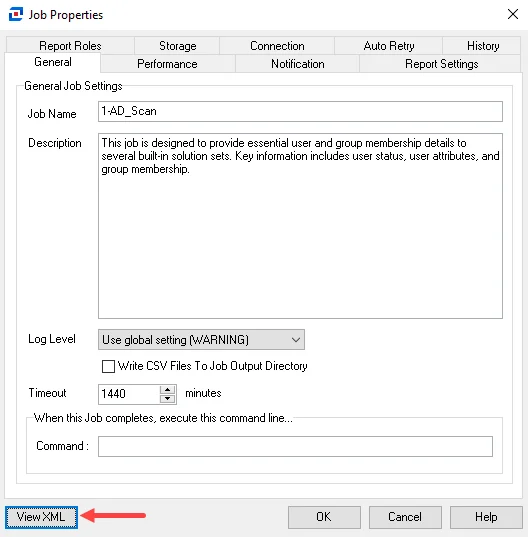
General Tab
The General tab is for changing the job name and description.
The following options are available:
- Job Name
- Description
- Log Level – Indicates the job log level, which can be inherited from the global Settings > Application log level or customized here. See below for additional information.
- Write CSV Files To Job Output Directory – Exports the native data table created by a query to a CSV file in the job’s output directory. If there are multiple tables in the job, this option creates one file per table.
- Timeout [value] minutes – Job’s thread timeout value
- Command – Provides the ability to enter a command that will be executed from the command line upon job completion
Log Level
The log level feature includes the following options:
-
Use global setting – use the Application log level feature, configured at the global level.
NOTE: By selecting the another option from the drop-down list, you break inheritance for this job.
-
Debug – Records everything that happens during job execution, most verbose level of logging
- Records all Info level information
- Records everything else that happens
- Creates the largest file
-
Info – Records information about what stage of the job is being performed when errors or warnings occurred
- Records all Warning level information
- Records job progress information
-
Warning – Records all warnings which occur during job execution
- Records all Error level information
- Records all warnings and the time of occurrence
-
Error – Records all errors which occur during job execution
- Records job start time
- Records errors and the time of occurrence
- Records job completion time
NOTE: You can switch between log levels. All the levels, including the one that you choose, shall be set for messaging in the application.

For example, this is where you set the messaging for Info, Warning, or Error at a job level.
History Tab
The History tab is for configuring the Data Retention and Log Retention periods. Choose either to use the default settings, which could be either the global configuration or configuration set via broken inheritance at a job group level, or to configure settings just for this job.
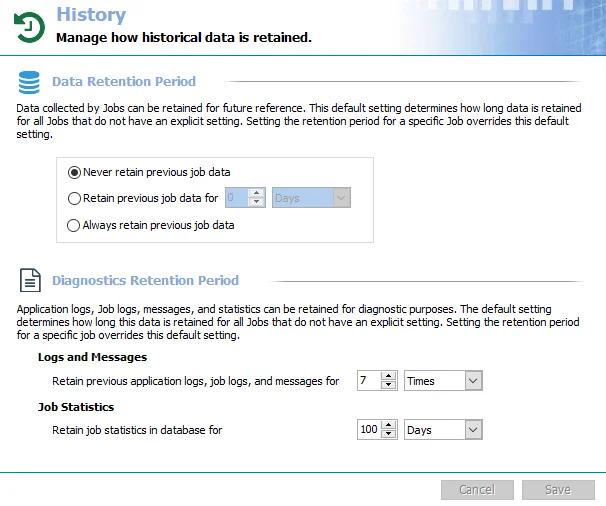
By default, all jobs are set to inherit the Data Retention Period and Log Retention Period settings, the Use Default Setting option. Deselect the Use Default Settings option to configure custom settings for the job. Then provide the desired Data Retention Period and Log Retention Period settings. See the History topic for additional information.
Click OK to save configuration changes and close the Job Properties window. Click Cancel if no changes were made.
Notification Tab
The Notification tab is where email notifications are configured at the job level. Choose either to inherit the global configuration or to configure settings just for this job.
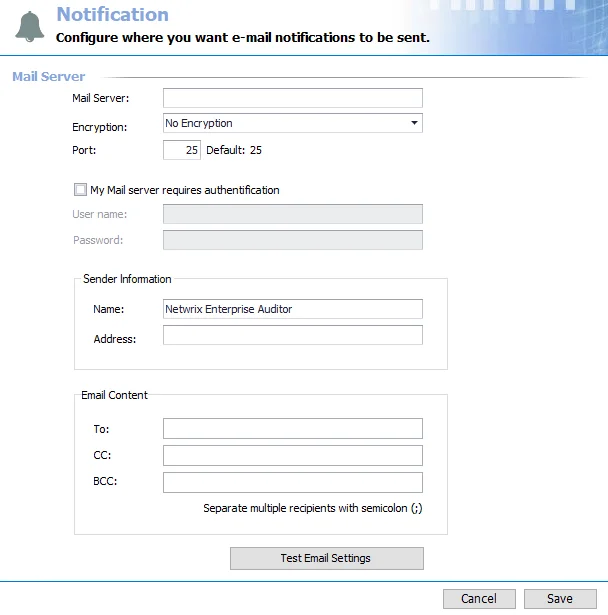
Deselect the Use Global Settings option to configure custom settings for the job. Then provide a specific list of recipients for email notifications generated by this job. Multiple email addresses can be input by adding a semicolon (;) and space between entries. This is specific to Notification analysis module tasks.
Click OK to save configuration changes and close the Job Properties window. Click Cancel if no changes were made.
Job Properties
Jobs can be configured to inherit global settings down through parent job groups or to be individually configured at the job level through the Job Properties window.
To configure a job’s properties, open the Job Properties window by right-clicking on the job's node in the Navigation pane and selecting Properties.
The properties can be configured at the job level within the Job Properties window using the following tabs:
- General Tab
- Performance Tab
- Notification Tab
- Report Settings Tab
- Report Roles Tab
- Storage Tab
- Connection Tab
- Auto Retry Tab
- History Tab
You can click the View XML button at the bottom of the window to open the job’s XML file. See the View Job XML File for additional information.
Click OK to save configuration changes and close the Job Properties window. Click Cancel if no changes were made.
Performance Tab
The Performance tab provides options that can be used to improve job performance and runtime.
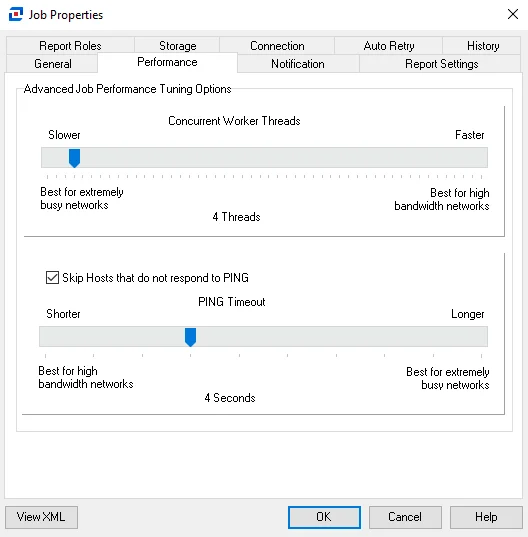
Adjust the following settings by sliding the needle up and down the line:
-
Concurrent Worker Threads – The number of worker threads selected equals the number of hosts being queried concurrently. If needed, this value can be increased.
-
Skip Hosts that do not respond to PING – Selected by default. Deselect if a target host has been configured to not respond to PING requests, allowing Enterprise Auditor to scan the target host without a PING response.
NOTE: In most cases, it is not recommend to deselect this option, as it causes the job to continue querying offline hosts until the job timeout value is reached, set by default to 20 minutes.
-
PING Timeout – The PING timeout value is the number of seconds before a host is identified as offline for not responding to PING
Click OK to save configuration changes and close the Job Properties window. Click Cancel if no changes were made.
Report Roles Tab
The Report Roles tab is part of the Role Bases Access feature of Enterprise Auditor. If Role Based Access has been enabled, the table displays all accounts that can view reports within the Web Console. If Role Based Access has not been enabled, all accounts have access to all reports, and the table is blank. See the Role Based Access topic for additional information.
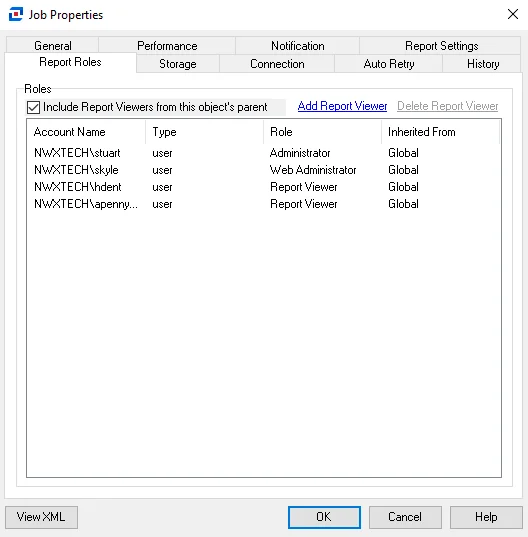
On the Report Roles tab, report role inheritance cannot be broken. Access to reports is inherited from the global level to job groups to jobs to report configuration. All user roles configured at the global level (Settings > Roles) are inherited down to all reports. Only the Global Options Administrator, the Access Administrator, and the Host Management Administrator do not have access to reports.
The Include Report Viewers from this object's parent option can be unchecked to automatically remove any user with the Report Viewer role inherited from a parent object to the job. Remember, this does not apply to global inheritance.
Additional accounts can be added with the Report Viewer role at the job level and inherited down to all reports generated by the job. Click Add Report Viewer to open the Select User or Group window and grant a new account access to these reports. Inheritance can be broken for accounts that have not inherited the report role from the global level. Select an account and click Delete Report Viewer to deny access to the reports.
The table displays the following information:
- Account Name – NT Style account name
- Type – Account type (user or group)
- Role – Role assigned to account which grants access to reports
- Inherited From – Indicates the level at which the account was granted access to reports. Remember, global inheritance cannot be broken.
Click OK to save configuration changes and close the Job Properties window. Click Cancel if no changes were made.
Report Settings Tab
The Report Settings tab is for configuring publishing of Enterprise Auditor reports generated by this job. Choose either to use the default settings, which could be either the global configuration or configuration set via broken inheritance at a job group level, or to configure settings just for this job.
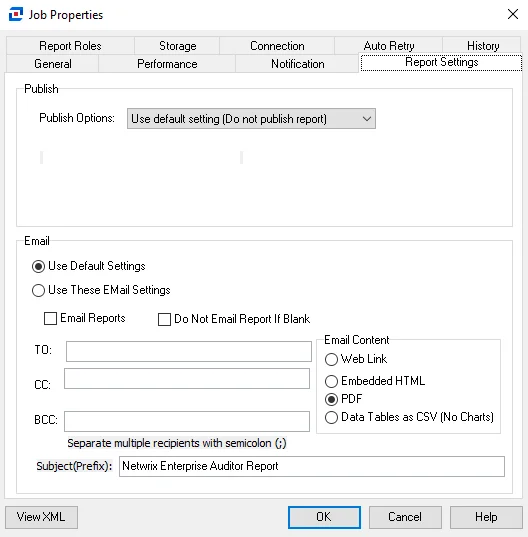
Use the Publish Options drop-down menu to customize the publish setting for the job. To configure custom Email settings for the job, select the Use These Email Settings option and then provide the desired Email information. Multiple email addresses can be input by adding a semicolon (;) and space between entries. See the Reporting Node topic for additional information on the Publish and Email options.
Click OK to save configuration changes and close the Job Properties window. Click Cancel if no changes were made.
Storage Tab
The Storage tab is for configuring the Storage Profile. Choose either to use the default settings, which could be either the global configuration or configuration set via broken inheritance at a job group level, or to configure settings just for this job.
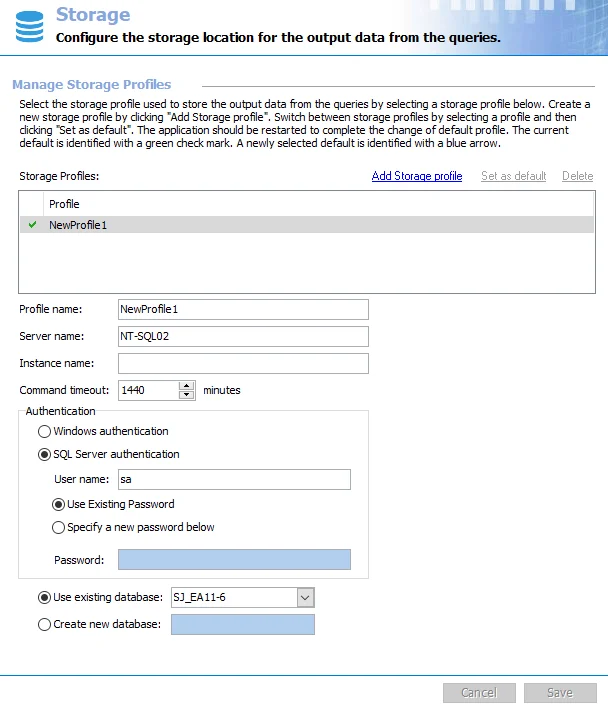
By default, all jobs are set to inherit the storage setting, the Use Default option. To configure a different profile for the job, select the Use This Profile option and select the desired Storage Profile from the drop-down menu. Storage Profiles can only be configured at the Settings > Storage node. See the Storage topic for additional information.
Click OK to save configuration changes and close the Job Properties window. Click Cancel if no changes were made.
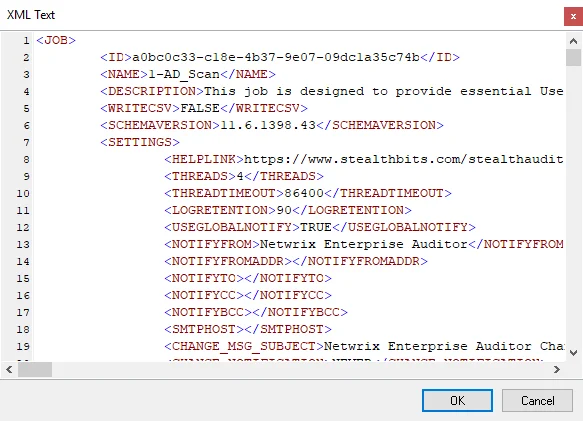
View Job XML File
At the bottom of the Job Properties window is the View XML button. To view the XML file, click View XML.
 | |
|---|---|
| Job Properties Window | Job XML File |
This opens the job’s XML file, which contains all of the job, query, and reporting configurations.
When the log level is directly set at job level, the job XML <JOBLOGLEVEL> parameter will show a
value of:
- 0 for Debug
- 1 for Info
- 2 for Warning
- 3 for Error
NOTE: Job analysis configurations are kept in a separate XML file.
Results Node
Once a job has been executed, the query populated native data tables, the analysis and action populated materialized tables and views, and the generated reports can be viewed under the job’s Results node.
NOTE: Native data tables are only populated by jobs with configured queries. Materialized tables and views are only generated by jobs with configured analysis or action tasks. Reports are only generated by jobs with configured reports.
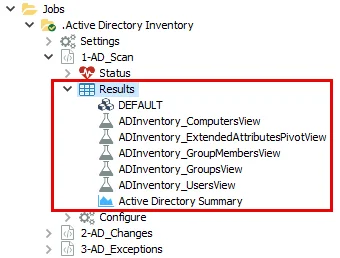
Every job generates a native data table when executed, which appears at the top of the Results node. The native data table, or raw data table, is produced by query execution. It contains all raw data collected by the scan. It is often named DEFAULT, but may have another name that is set during query configuration. If no query is executed by the job, the DEFAULT table is listed as a placeholder only and will be empty (0 rows). It is possible to have multiple queries in the same job, though not recommended. These queries could write to the same native data table, or each query could write to its own native data table. If multiple native data tables are being generated by one job, they are listed in alphanumeric order at the top of the Results node list.
Analysis tasks can be configured to generate materialized tables and views. Action tasks create action status tables. These appear beneath the native data tables under the Results node in alphanumeric order.
Finally, any reports generated by the job, both published and unpublished, will be listed beneath the materialized tables and views in alphanumeric order.
Status Node
Once a job has been executed, it always generates the tables providing information on host connection status, job statistics, job task statistics, and error and warning messages can be viewed under the job’s Status node:

The Status node tables are:
-
ConnectStatus table – Lists all hosts queried during job execution and the access status of the scan, unless the System Default is being used
-
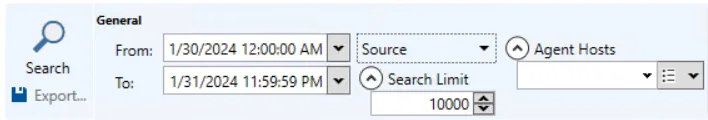
Job Stats table – Provides information on the selected job’s runtime details, according to the global configuration set in the Settings > Application node. By default, this is set to not filter the data.
-
Task Stats table – Provides information for each task run during job execution, according to the global configuration set in the Settings > Application node. By default, this is set to filter to the most recent data.
NOTE: The Job Statistics Retention settings in the Settings > Application node control how long the job statistics history is kept in the database and displayed Job Stats and Task Stats tables. See the Application topic for additional information.
-
Messages table – Provides a list of any warning or error messages that occurred during the execution of the job. For example, a frequently generated message is
WARNING: No Host found for processing.- If this message is generated by an analysis or reporting job, then there is no problem as that type of job does not need a host list assigned
- However, if this message is generated by a job running a data collection query, this warning would explain why the native data table is empty