Running Job Details
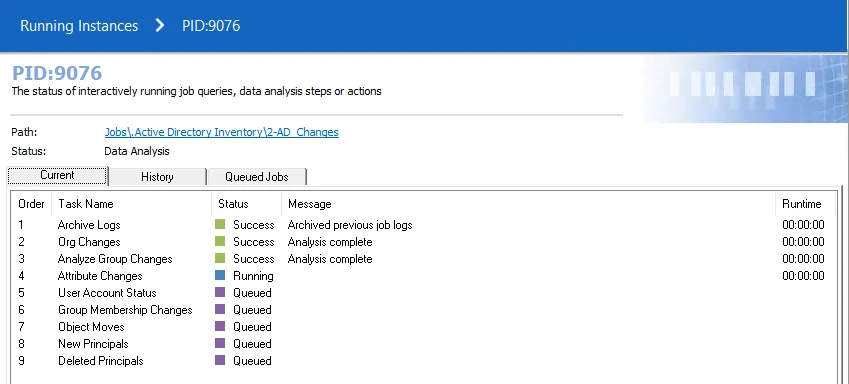
Both the Process ID and the View Details links open the running job's Details page. The path of the job and the component are displayed at the top.
-
Path – Folder path in the Jobs directory. For example,
Jobs\GROUP_.Active Directory Inventory\JOB_3-AD_Exceptions.- The link opens the job’s directory in a Windows Explorer window
-
Status – While the job is running, this field displays the component that is running. When the job has completed execution, it displays a completed status and lists the completion time.
- Job configuration components include Query, Data Analysis, Action, and Report
There are three tabs: Current, History, and Queued Jobs.
Current Tab
The Current tab displays information on the job actively being executed.
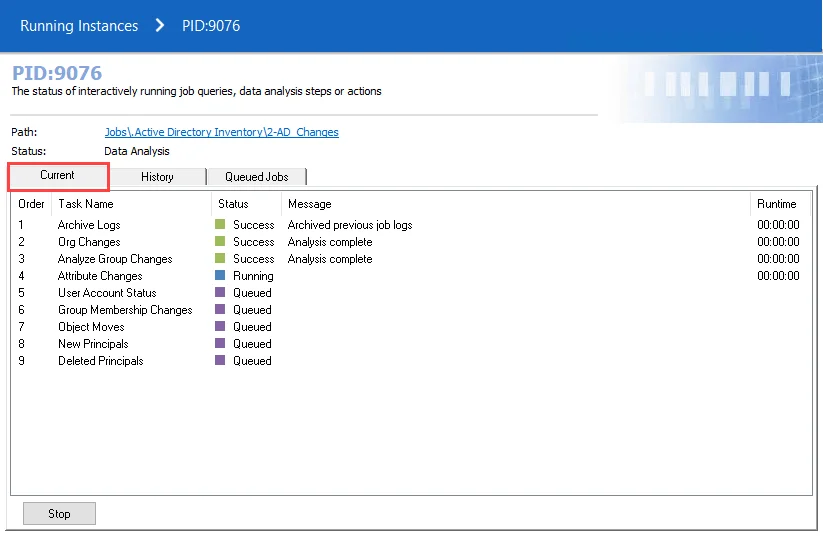
The tab includes:
- Order – Order in which the tasks in the job are being run
- Host Name – Name of the targeted host, only visible when a query is executing
- Query – Name of the running query task, only visible when a query is executing
- Task Name – Name of the running task, when applicable to Data Analysis, Actions, or Reports. This information is only visible when an analysis task or an action task are executing, or a report is being generated.
- Status – Execution status, for example Queued, Running, Success, or Warning.
- Message – Enterprise Auditor message regarding runtime activity
- Runtime – Duration of task execution
- Stop – Aborts all currently running instances
History Tab
The History tab only displays information for the last job that completed.
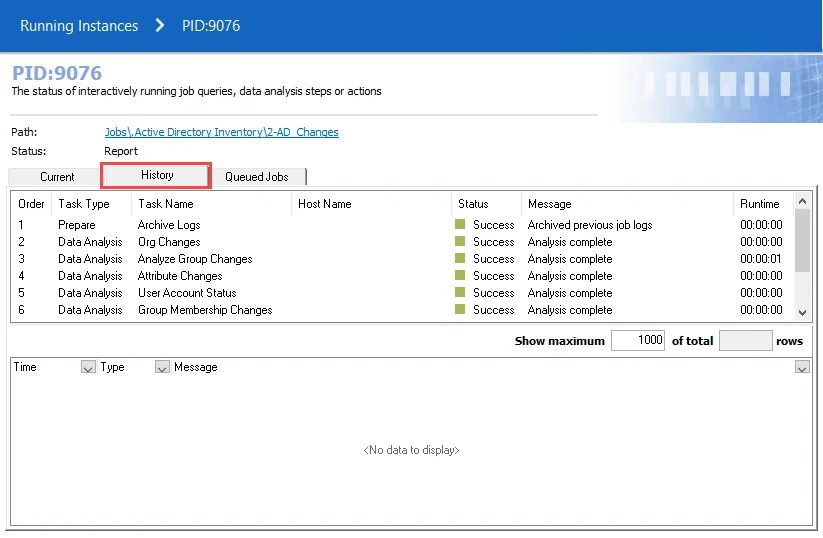
The tab includes:
- Order – Order in which the tasks within the job ran
- Task Type – Name of the component associated to the task
- Task Name – Name of the task
- Host Name – Name of the targeted host associated with the running job, if any
- Status – Status of the completed task
- Message – Enterprise Auditor message associated to the Status
- Runtime – Duration of task execution
Messages
In the bottom pane, the History tab includes a section to display any messages for individual job components returned from a job execution. Clicking a Task Name displays the messages for that component.
You can filter what messages display by using the three filters in the message pane. By clicking on a filter arrow in the column header and selecting an available option, you can filter by Time, Type, or Message.

If you select Custom, you can create a complex filter. See the Custom Filter topic for additional information.
Queued Jobs Tab
The Queued Jobs tab displays a list of jobs in queue and the order in which they are executed.
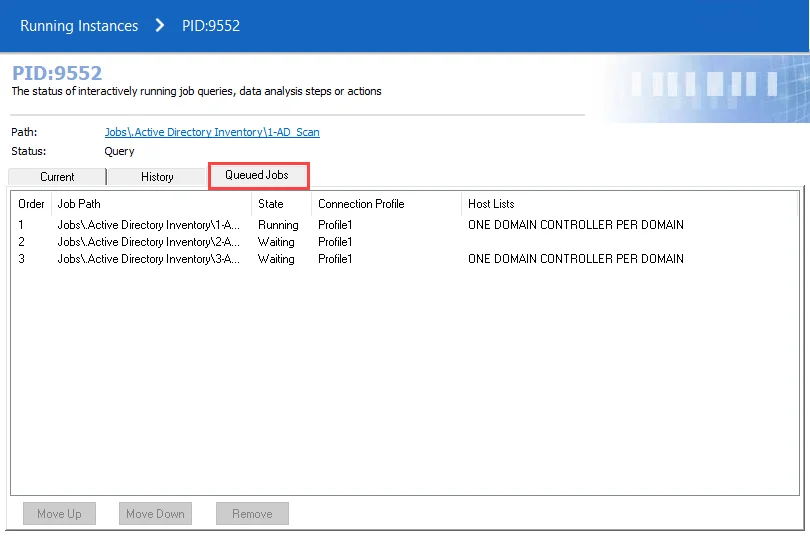
The tab includes:
- Order – Order in which the queued jobs are executed. This order can be changed on the Queued Jobs tab by using the buttons at the bottom.
- Job Path – Folder path in Jobs directory
- State – Queue status, for example Running or Waiting
- Connection Profile – The Connection Profile assigned to the job, if applicable
- Host Lists – The host list assigned to the job, if applicable
The Move Up, Move Down, and Remove buttons are for changing the order or removing a job from the queue.
Running Instances Node
The Running Instances node displays progress for all running jobs. This includes jobs that are run by a scheduled task, interactively within the open Enterprise Auditor instance, or interactively in any other running instance of Enterprise Auditor. The Running Instances node displays the instance name, its status and position in the queue, run times for all instances, and detailed views of each instance.
This is the primary view of the Running Instances node that displays the progress of all jobs running.
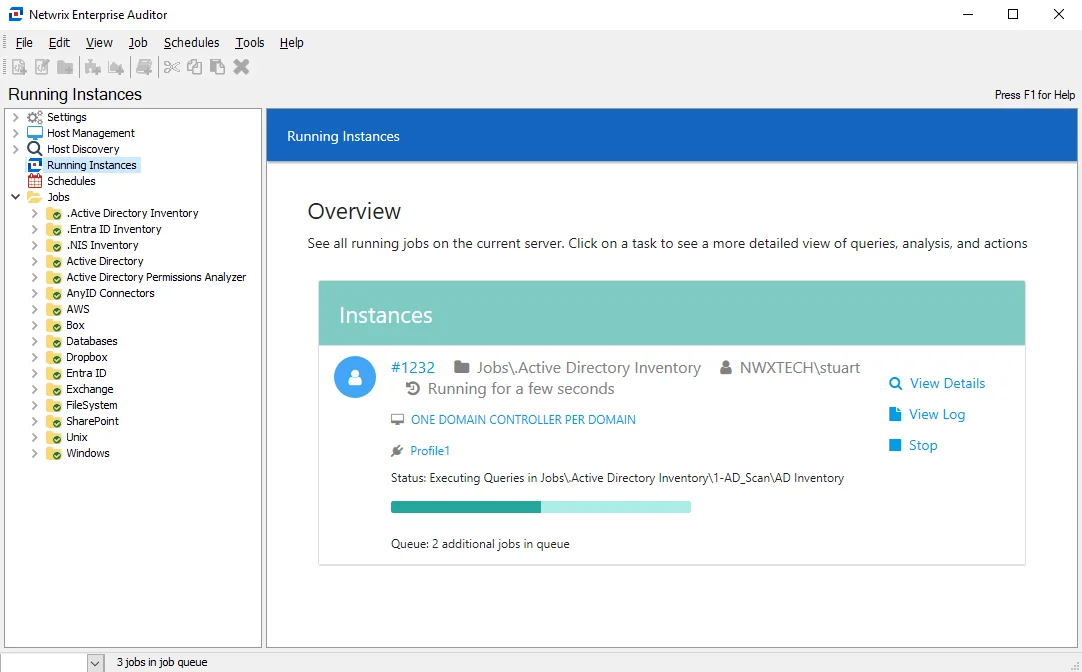
Overview
The Overview page displays information about all running jobs on the current server.
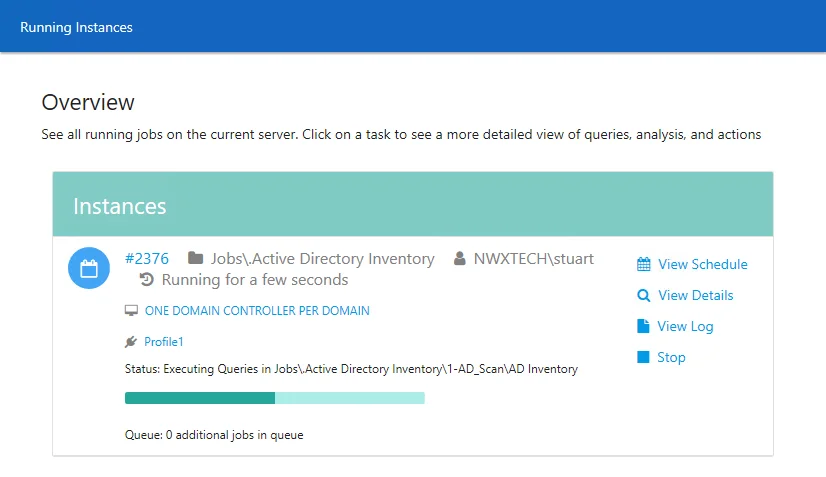
For each instance this screen provides :
- Job path
- Credential used
- Running time of the job
- Status of the running job
- Number of jobs scheduled in queue
It also has hyperlinks for:
- Process ID
- Host Name
- Connection Profile
- View Details
- View Log
- Stop
- View Schedule
Clicking on any of the hyperlinks displays more information about the running job. The ProcessID, View Details, View Log, and Stop links only work while the job is running. Once the job is complete, these links are disabled. The host and Connection Profile links continue to work. The View Schedule link only displays and is valid for jobs that are running via a scheduled task and is not enabled for interactive job executions.

The number of jobs currently being run can be found in the lower-left-hand corner of the Enterprise Auditor Console.
View Host
This view identifies the host list associated with the running job.
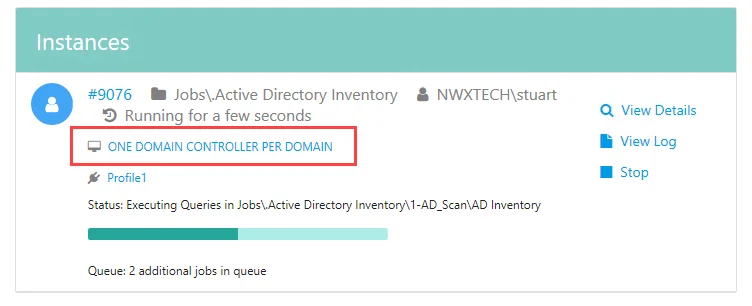
Click the host list link to display the hosts assigned to the running job.
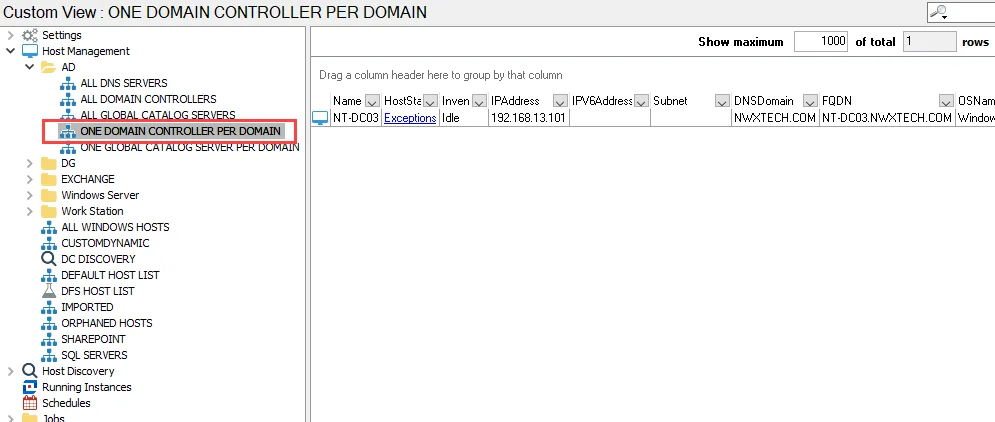
This view displays the host list table with host inventory data.
Process ID
The Process ID correlates to the Process ID of the running instance of Enterprise Auditor in Task Manager. In addition, the Process ID comes coupled with the file path of associated scheduled tasks, an identifier for the account running the current instance of Enterprise Auditor, and a timestamp for the length of the instance.
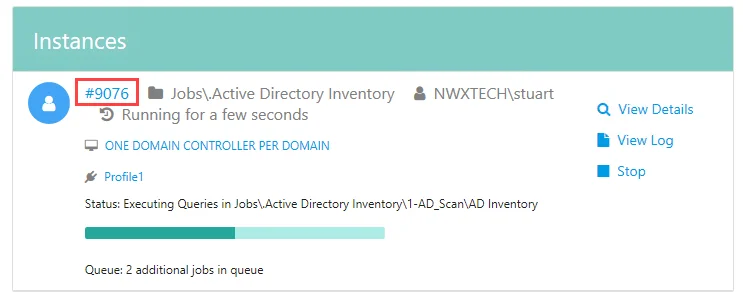
Click the Process ID link for additional details of the job status and queue.
The Process ID link displays a page with three tabs of information with details about the running job. See the Running Job Details topic for additional information.
View Details
Additional details on the status of the tasks the job is running are available.
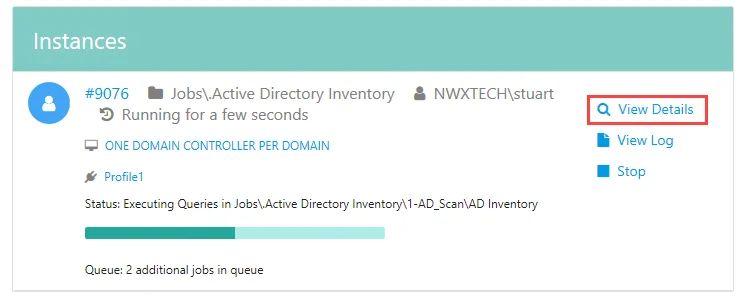
Click the View Details link to display additional details of the job status and queue.
The View Details link opens the running job's details with three tabs of information. See the Running Job Details topic for additional information.
View Log
The log for this running job can be opened in a text editor, such as Notepad.
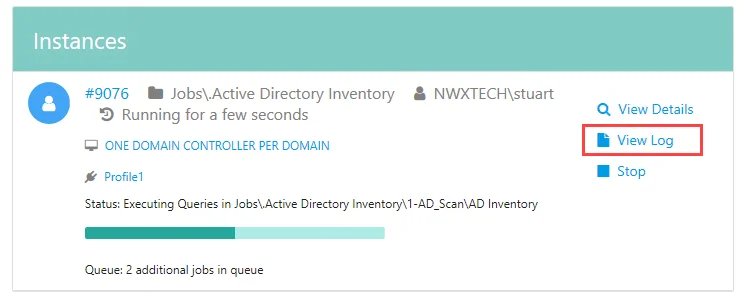
Click View Log to display the current job log. The View Log link is only enabled while a job is running.
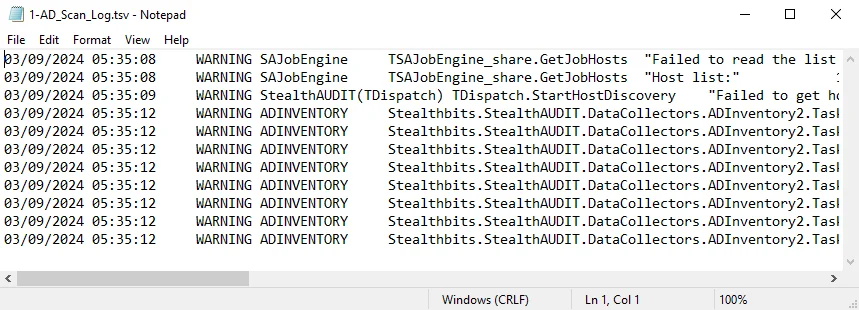
The Log displays such details as errors, aborts, and terminations.
View Schedule
The Enterprise Auditor Console can only run one job at a time. However, with the Schedule Service Account, the StealthAUDIT application can run multiple jobs simultaneously via Windows Task Scheduler.
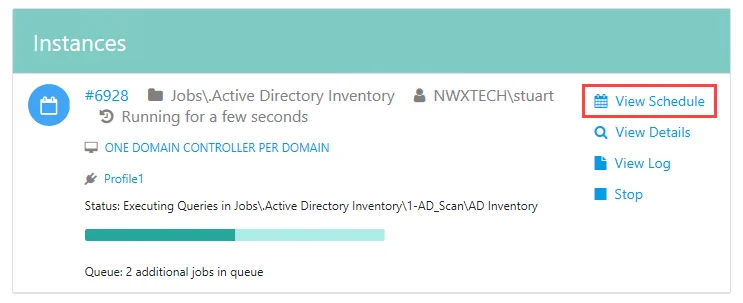
Click the View Schedule link to display the corresponding Scheduled Task for the running job or job group. This link is only enabled for jobs that are running via scheduled task and will not be enabled for interactive job executions.
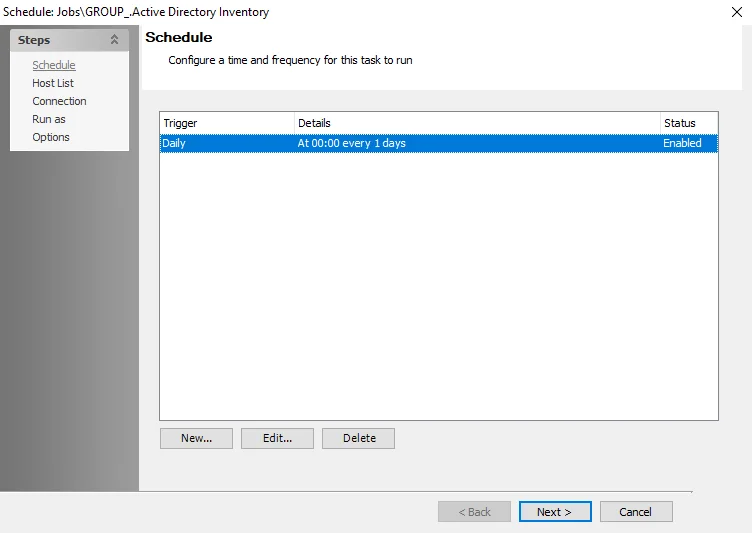
The Schedule wizard for the running task opens. See the Schedule Wizard topic for additional information.
Stop
The job execution can be stopped if needed.
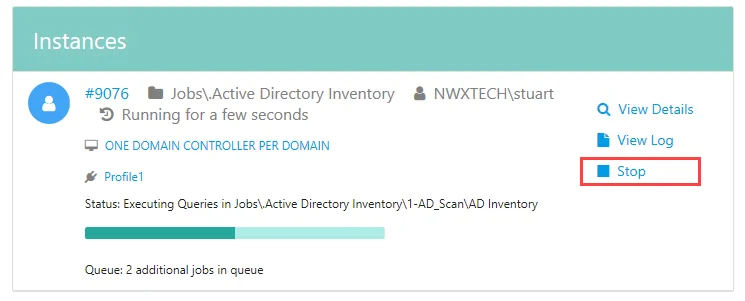
Click Stop to abort all instances in the job queue. This link is only enabled while a job is running.