Copying Cells
Copying an individual cell within a generated report enables easier searching for information using the AIC or other tools. The copy feature can only be used on interactive grids. Each cell listed under a column can be selected and copied to the clipboard.
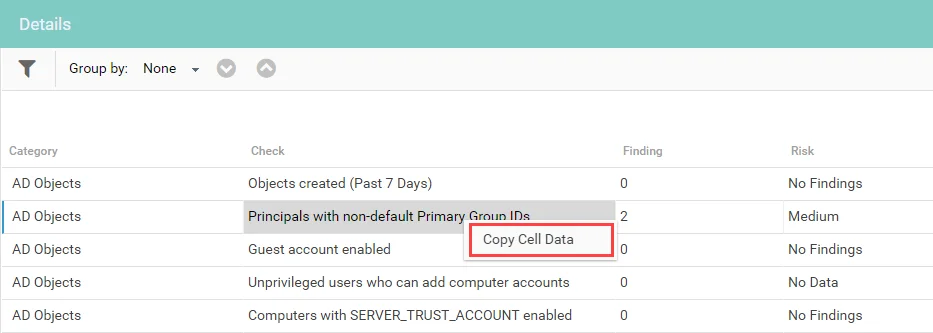
To copy a cell, select the cell, then right-click on it and select Copy Cell Data.
NOTE: You may need to allow programmatic clipboard access for your browser the first time you attempt to copy a cell.
Grouping Data
If grouping is enabled, the Group by field provides a drop-down list of categories by which the data can be grouped.
NOTE: Grouping and filtering cannot be enabled at the same time. If grouping is enabled, the Filter icon is disabled in the report.
The following example shows an interactive grid in which grouping has been enabled. See the Grid topic for additional information.
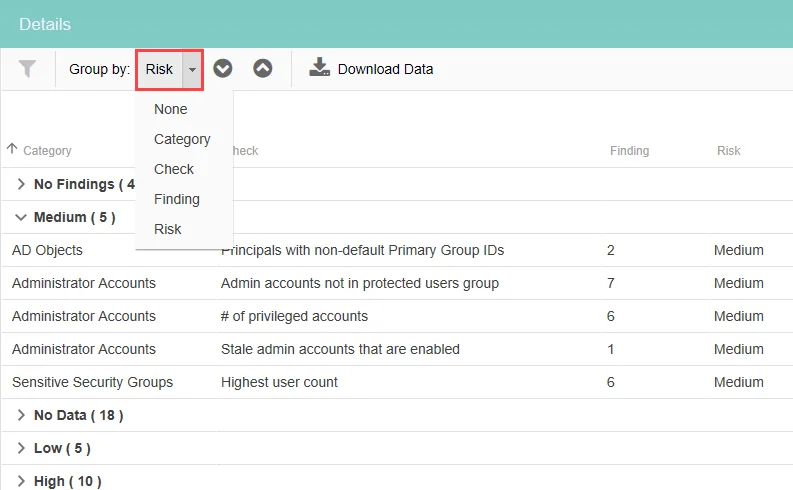
The drop-down list to the right of the Group by field can be accessed by clicking the down arrow. Click an item from the drop-down list to group the report by that category.
Interactive Grids
Interactive grids in the table section of a report provide the ability to interact with the data and filter it as required. Interactive grids allow you to perform the following actions:
- Group data
- Search and filter data
- Paging
- Download data to a CSV file

The toolbar in an interactive grid can display the following options:
- Filter icon – Click this icon to activate searching and filter the data
- Group by – Provides a drop-down list of available categories to select for grouping. When grouping is enabled, searching is disabled.
- Up arrow and down arrow – Click to expand or collapse the groups
- Download Data – Click to download all data to a CSV file. This option is displayed when the Export table data as CSV checkbox has been selected for the report, see the Grid topic for additional information.
When enumeration is set on an interactive grid, a second download button is displayed. A CSV file can be downloaded that contains only data for the selected enumeration.

When grouping data, interactive grids display the percentage of data that has loaded on the page.
Paging
Paging allows users to interact with large sets of data more efficiently when viewing, filtering, and sorting generated report tables by limiting the amount of data being displayed at a given time. Reports provide the ability to navigate to specific pages using arrows at the bottom of the report. Paging is enabled by default. See the Grid topic for additional information.
NOTE: Paging and grouping cannot be enabled at the same time. When Paging is enabled, the Grouping options are disabled for the report.
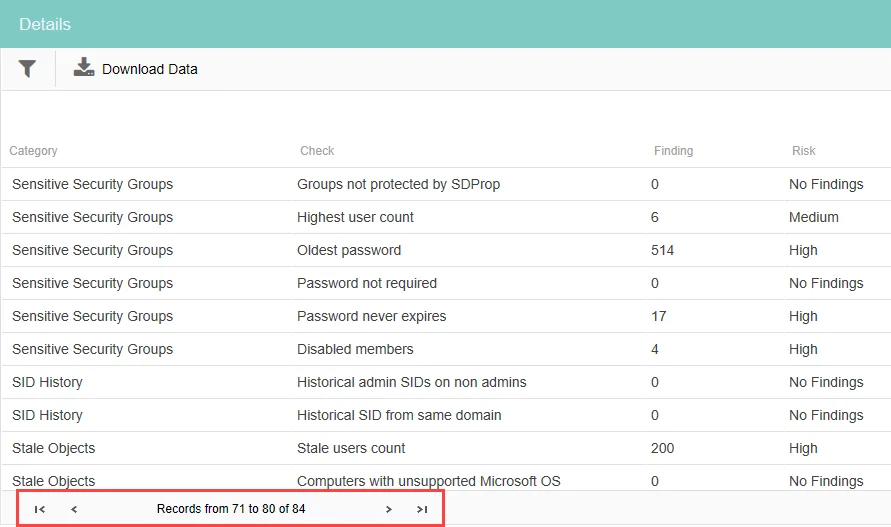
When paging is enabled, arrows are displayed that allow you to navigate to the next page, last page, previous page, or first page. If the data is filtered, it is indicated at the end of the line. Each page contains 10 records.
Searching and Filtering Data
When dealing with large sets of data, it may be useful to search for a desired attribute. This can be done using the Filter icon.
NOTE: Searching and grouping cannot be enabled at the same time. If grouping is enabled, the Search icon is disabled in the report.
The following example shows an interactive grid in which searching has been enabled. See the Grid topic for additional information.
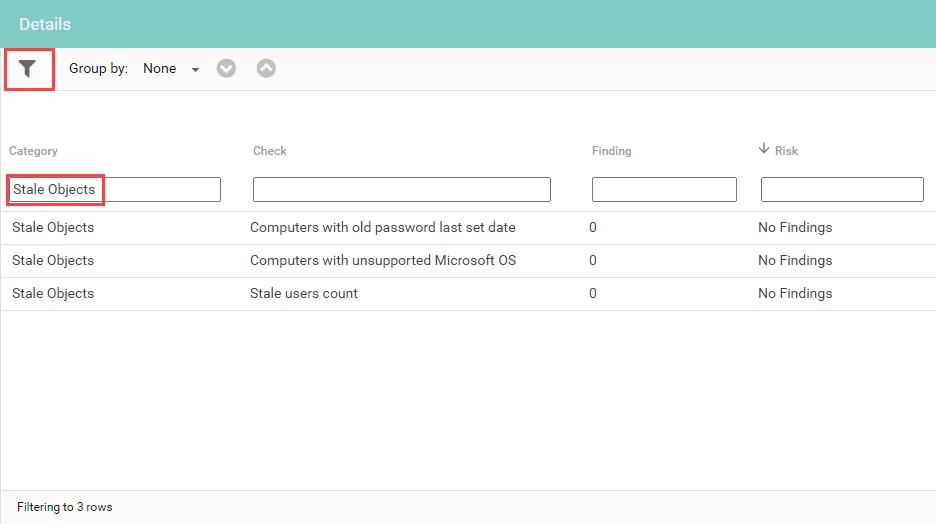
Enter search criteria in the boxes under the columns to filter the data. Click the search icon again to clear the filters.
Click on a column to sort by that column. Clicking on a cell in a column automatically expands the column size to fit the largest length of text contained in the column.
Searching Enumerated Tables
Enabling the enumerated column option, and choosing a column from the data set adds a list of column types to display as enumerated tables.
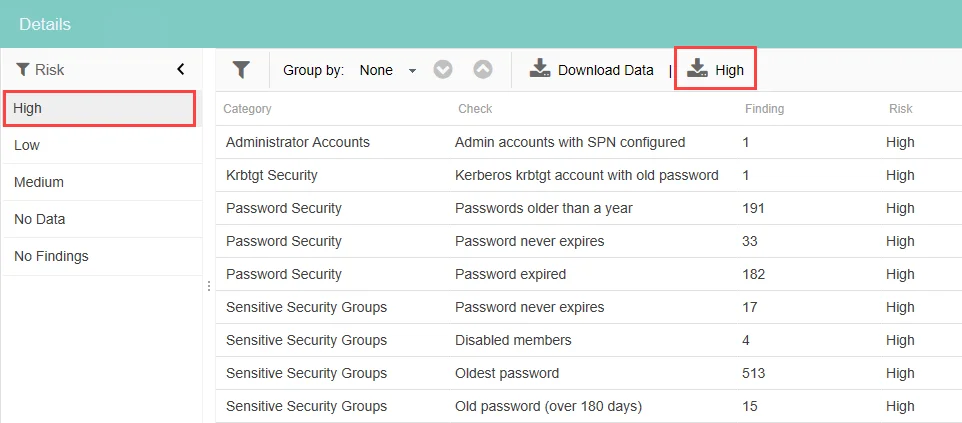
To change the enumeration in the report, select an option from the enumerated column list. When enumeration is set on an interactive grid, a second download button is displayed with the name of the currently selected enumerated column. You can use this to download a CSV file that only contains the data for the selected enumeration.
Filtering on Dates & Times
Data can also be filtered on dates and times. Expanding the column’s width activates hyperlinks to filter on specific time periods.
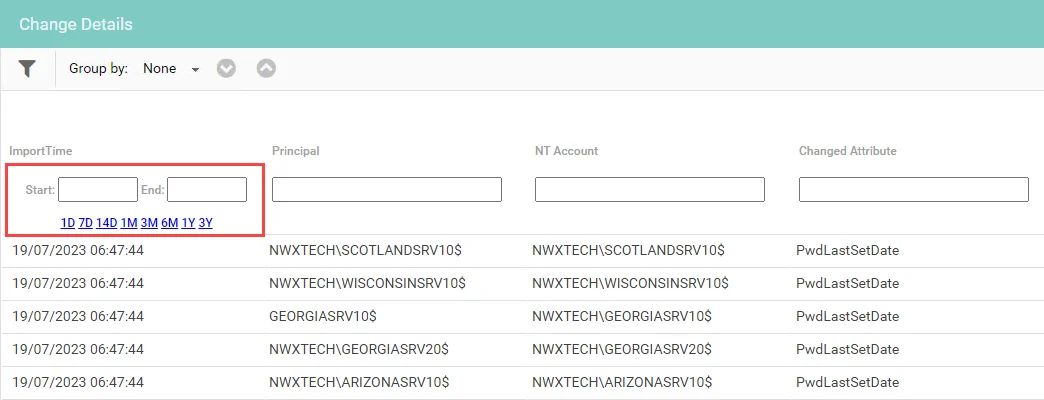
Enter a Start and End date and select the desired time period.
Filtering on Numeric Columns
Comparison operators can also be used for filtering. Comparison operators which can be used for filtering include the following:
| Description | Operator |
|---|---|
| Equal to | = |
| Greater than | > |
| Less than | < |
| Less than or equal to | <= |
| Greater than or equal to | >= |
| A range of values | n1..n2 |
Adding & Removing Columns
Columns can be added or removed from the table.
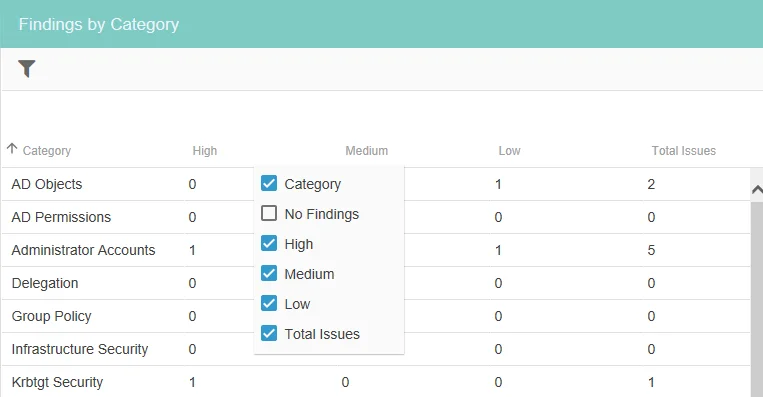
Right-click on a column to display a list of the available columns. Select the checkboxes of the columns you want to be displayed. Click the up or down arrows to scroll through the list of columns.