SQLViewCreations: Columns
The Result Columns page lists the tables selected on the Input Select page.
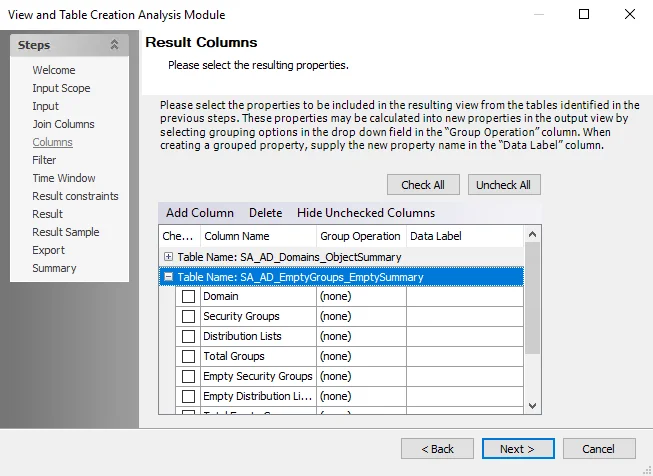
Expand the table to show its columns. Then, select the checkbox next to the column to include it in the resulting table or view. If two data tables are being joined, the resulting table displays at the bottom of the grid. Use the scroll bar to view any hidden tables or data points.
The grid provides the following options for formatting the resulting table or view:
-
Check All – Selects all checkboxes in the Checked column
-
Uncheck All – Clears all checkboxes in the Checked column
-
Add Column – Opens the New Trend Column window, where columns can be added to the table
-
Delete – Deletes a selected column
- Original columns cannot be deleted. Only columns that have been added by users can be deleted.
-
Show All Columns/Hide Unchecked Columns – Hides rows that are not currently selected ,or if columns are currently hidden, displays all columns in the table
-
Checked – Selects data columns for inclusion in the resulting table or view
-
Column Name – Displays the data column name
-
Group Operation – Accesses the available group operations that can be applied to individual data points. Click on a cell in this column to display the drop-down arrow. The following operations are available:
- (none)
- Average
- Count
- Maximum
- Minimum
- Sum
- Variance
-
Data Label – Displays any data label for the associated data point. Data labels override the column name on the materialized table or view. If applying a group operation, a default data label shows. To apply a custom label, click in the cell and enter the label.
-
Order By Operation – Accesses the available order-by operations that can be applied to individual data points. Click on a cell in this column to display the drop-down arrow. The following operations are available:
- None
- Ascending
- Descending
NOTE: If at least one columns is sorted by value, the With ties option is enabled on the Result Constraints page. See the SQLViewCreation: Result Constraints topic for additional information.
After selecting the columns to include in the resulting table or view, click Next to further filter the sourced data.
SQLViewCreation: Export
Use the Export settings page to specify data export settings.
![]()
Select the Export results data checkbox to enable the settings. The following options control the file type and destination of the exported data:
-
Format – Use the drop-down menu to select the file format of the exported data
- MS Excel file – Converts file to Microsoft Excel format. If Excel is not installed on the console, a warning message shows and another export file format needs to be selected.
- CSV file – Converts file to Comma-Separated Values format. Includes the option to compress the file to a zip file.
- ML file – Converts file to Extensible Markup Language format. Includes the option to compress the file to a zip file.
-
Location – Displays the export location path. To edit this field, clear the Use the job output folder checkbox. Click the ellipsis (…) to browse for a location, or edit the field directly.
-
Use the job output folder – Use the default export location and displays the path within the Location field. To specify a different location, clear the checkbox and edit the Location field.
Once the options are selected, click Next.
SQLViewCreation: Filter
Use this page to add custom filters to the table using the Filter Builder.
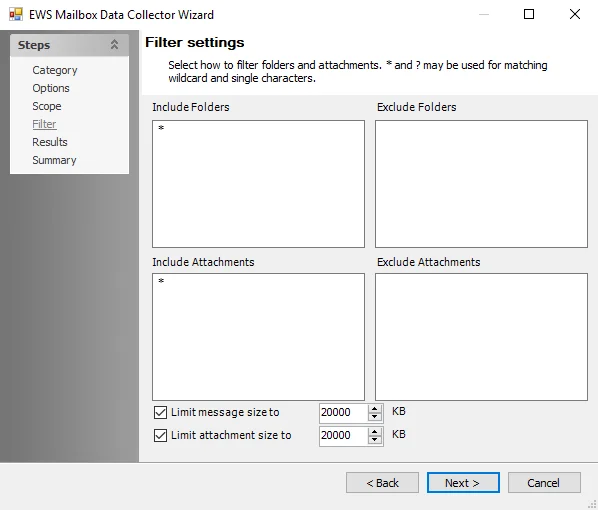
Filters reduce the amount of data visible in a column imported to the resulting table or view. By default, when the filter page is blank, all the data within each column is included. Use the following options to add and remove filters:
-
Edit – Opens the Filter window
- See the Advanced Search topic for additional information
-
Clear – Clears any specified filters
SQLViewCreation: Input Source
Use the Input Source page to select the source tables or views, containing data, to join or aggregate into a resulting table or view.
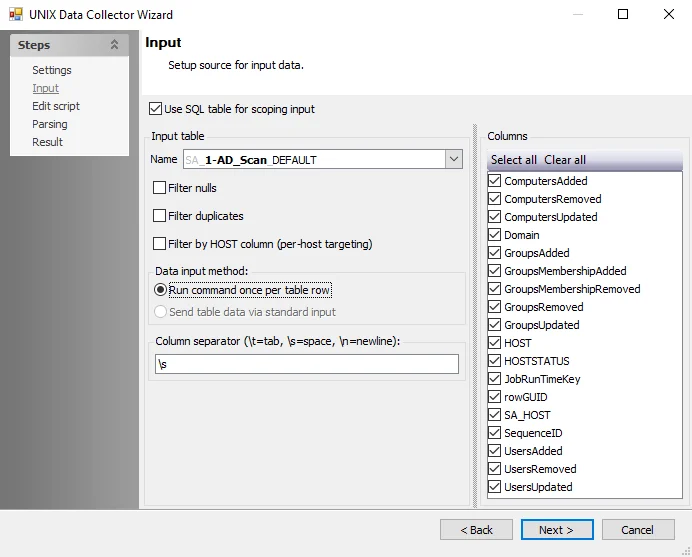
At the first drop-down, select a table. The drop-down lists on this page are determined by the selection made on the Input Scope page. To join or aggregate data from two tables, select a second table at the second drop-down menu. To remove the second table from the field, click the X button.
NOTE: It is important to choose tables that are compatible with one another or share similar columns.
When the two sources of data are selected, click Next to create a joint column within the resulting table or view.
SQLViewCreation: Input Scope
Use the Input Selection page to scope the source data tables. This option affects the tables available for selection on the subsequent pages.
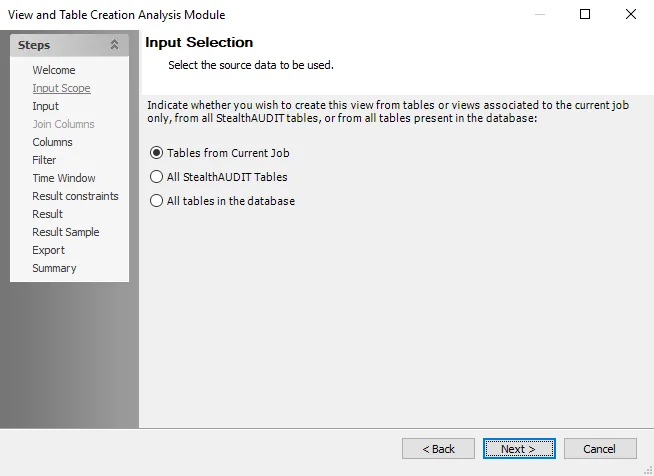
Select the source data to be used from the following options:
- Tables from Current Job – Targets all tables generated by the current job within the SQL Server database
- All Enterprise Auditor Tables – Targets tables within the SQL Server database that begin with
SA - All tables in the database – Targets all tables within the SQL Server database
After selecting the initial scope for the data sources, click Next.
SQLViewCreations: Join Columns
Use the Join Columns page to select a column from each source table to join together on the resulting table or view. The options on this page are only enabled if two tables are selected on the Input Source page.
NOTE: The SQLViewCreation analysis module can join two tables, using a simple equi-join condition of two predicates. For composite joins with two or more tables using a conjunction of predicates, use the SQLscripting analysis module. See the SQLscripting Analysis Module topic for additional information.
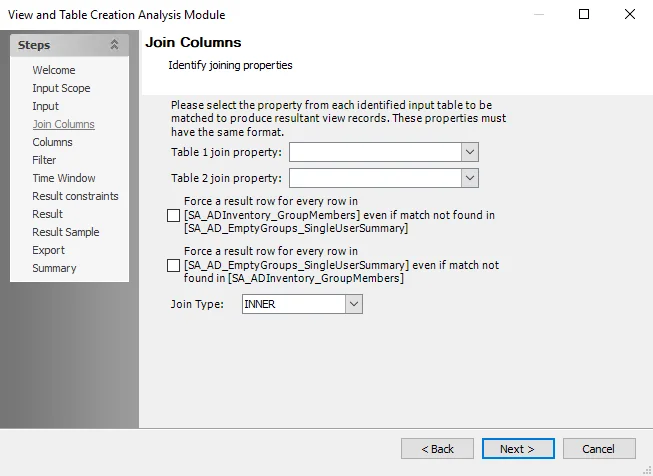
Use the Table 1 join property and Table 2 join property fields to select join predicates from both tables. Join predicates are columns containing analogous values that are used to match records in referenced tables.
Next, specify how to join these tables. To automatically select the appropriate join type, select one or more of the checkboxes. The selection in the Join Type field updates based on user selections.
To manually select, use the Join Type field. The selection here may update the above checkboxes. The following options are available:
-
Join Type – Select a join type from the drop-down:
NOTE: Left is the first table referenced, right is the second table.
- Inner Join – Returns records that have matching values in both tables
- Right Outer Join – Returns all records from the left table, and the matched records from the right table
- Left Outer Join – Return all records from the right table, and the matched records from the left table
- Full Outer Join – Return all records when there is a match in either left or right table
NOTE: The join property is the column found within both tables. The two columns can have different names. However, in the results set, everywhere a value in the first column matches the value in the second column, rows from the respective tables are joined together.
After selecting a column from each data source to join, click Next to select columns to transfer to the resulting table or view.
SQLViewCreation Analysis Module
The SQLViewCreation analysis module provides the ability to create new views or tables that are used in Enterprise Auditor actions and reports. These views or tables are re-created during job execution.
CAUTION: Consider the impact on storage and performance when choosing to create views versus tables. Tables require more storage space in the database.
Configuration
This analysis module provides the View and Table Creation Analysis Module wizard to assist in configuring the module. Before the wizard, collect the desired data for manipulation.
The wizard contains the following pages:
- Welcome
- SQLViewCreation: Input Scope
- SQLViewCreation: Input Source
- SQLViewCreations: Join Columns
- SQLViewCreations: Columns
- SQLViewCreation: Filter
- SQLViewCreation: Time Window
- SQLViewCreation: Result Constraints
- SQLViewCreation: Result Type
- SQLViewCreation: Result Sample
- SQLViewCreation: Export
- SQLViewCreation: Summary
The Welcome page provides an overview of the analysis module.
There are no configurable settings on the Welcome page. Click Next to begin configuring a custom table or view using two formatted data sources, or use the Steps navigation pane to open another page in the wizard.
SQLViewCreation: Result Type
Use the Result Type page to choose a SQL database table or view for the result’s output.
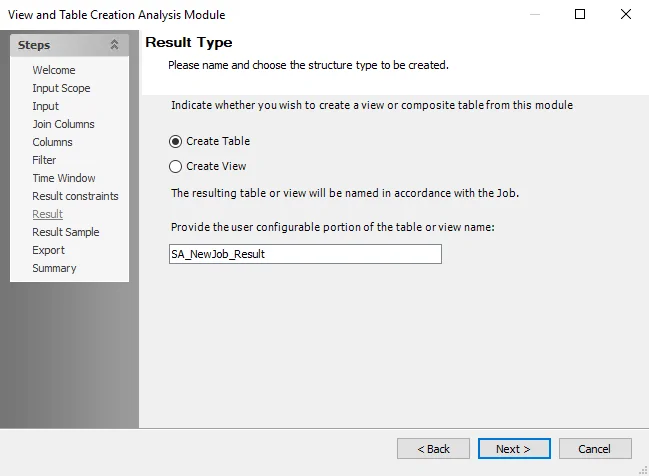
The options on this page determine the visual representation and name of the combined data from the two sourced tables. Select from the following two options:
- Create Table – Creates a table output for the resulting dataset
- Create View – Creates a view output for the resulting dataset
A default name of SA_[job name]_Result is provided in the name field. You can customize this name
for the resulting table or view.
The name must start with SA to be recognized as a Enterprise Auditor table or view.
After selecting the resulting table or view’s visual representation and name, click Next.
SQLViewCreation: Result Constraints
Use the Result Constraints page to impose restraints on the dataset.
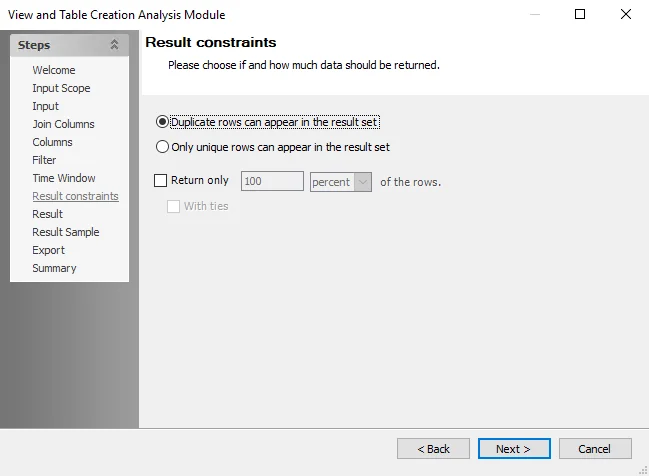
Select one of the following options to choose if and how much data should be returned:
-
Duplicate rows can appear in the result set
-
Only unique rows can appear in the result set
-
Return only [number] [unit] of the rows – Select this checkbox to specify a numeric value and unit of measurement to return for the rows that appear in the resulting table or view
-
With ties – Include all instances of identical values in the sorted columns with the results. To include only one instance of identical values, do not select this option.. See the With Ties Example topic for additional information.
NOTE: This field is enabled by sorting at least one column in the table by value (for SQL, only a sorted column can contain ties). To sort columns, use the Order By Operation field on the Columns page. See the SQLViewCreations: Columns topic for additional information.
-
With Ties Example
The following example explains how the With ties option works.

Consider a table that has ten rows with one repeating entry under the value column.

If the table is sorted by the value column in ascending order and the Return only option is set to 40 percent, then there should be four rows visible in the resulting table or view output.

However, if the first three values in the sort column are unique but the fourth value matches the fifth, selecting the With ties option returns the first three rows as well as both the fourth and fifth rows for a total of five rows.
NOTE: If sorting multiple columns, With ties evaluates all sorted columns to determine ties between columns with the same inputs.
SQLViewCreation: Result Sample
Use this page to preview a sampling of the completed data manipulation.
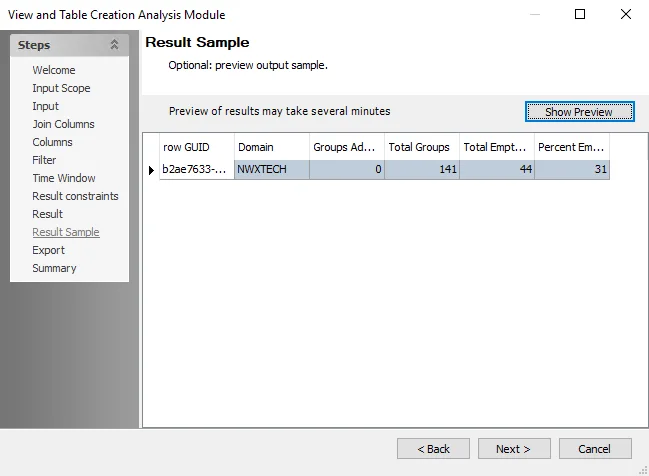
Click Show Preview to populate the window with the selections from the previous pages. If the window does not populate, check the configurations for errors and try again.
NOTE: The Show Preview option does not always apply the filter conditions specified within the wizard, but the resulting table or view applies all filters.
If the preview is satisfactory, click Next to continue.
SQLViewCreation: Summary
This page provides an overview of all the settings configured in the wizard.
Click Finish to save configuration changes. If no changes were made, it is a best practice to click Cancel to close the View and Table Creation Analysis Module wizard to ensure that no accidental clicks are saved.
SQLViewCreation: Time Window
Use the Source and Time Window page to specify which data to access if using multiple Enterprise Auditor Consoles or history is enabled.
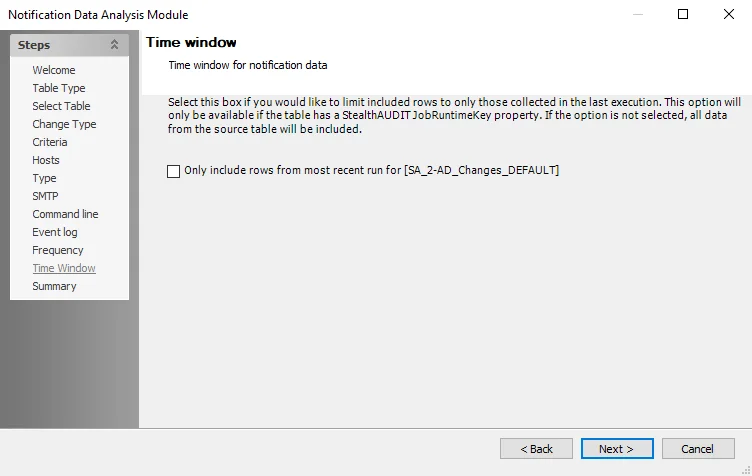
Use the following options to select which sources of data to permit and the time frame in which the data was collected:
-
Source Data Details – Choose a data source. This option is for when the selected tables are from two separate Enterprise Auditor Consoles using tables generated by the same job.
NOTE: This section is enabled after selecting All Enterprise Auditor Tables or All tables in the database on the Input Scope page.
- All data – Uses all data available from the selected option on the Input Scope page and merges the data
- Data from this Enterprise Auditor Console only – Uses only data from the Enterprise Auditor Console generating the current analysis module
-
Time Window – Select a time window for each table in the analysis. The drop-down menu selections vary based on each table's history settings.