ActiveSync > EX_ActiveSync Job
The EX_ActiveSync job provides visibility into ActiveSync Traffic in the Organization.

The EX_ActiveSync job is located in the ActiveSync job group.
Analysis Tasks for the EX_ActiveSync Job
View the analysis tasks by navigating to the Exchange > 2. CAS Metrics > ActiveSync > EX_ActiveSync > Configure node and select Analysis.
CAUTION: Most of these analysis tasks are preconfigured and should not be modified or deselected. There are some that are deselected by default, as they are for troubleshooting purposes.
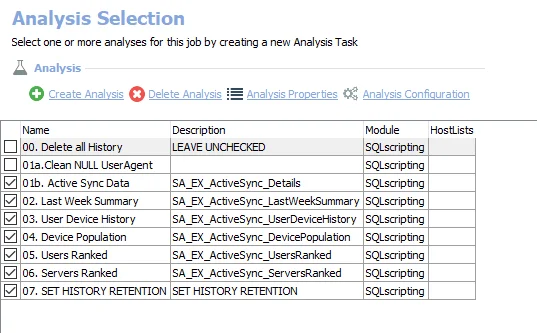
The following analysis tasks are selected by default:
-
01b. Active Sync Data – Creates the SA_EX_ActiveSync_Details table, accessible under the job’s Results node
-
- Last Week Summary – Creates an interim processing table in the database for use by downstream analysis and report generation
-
- User Device History – Creates the SA_EX_ActiveSync_UserDeviceHistory table, accessible under the job’s Results node
-
- Device Population – Creates the SA_EX_ActiveSync_DevicePopulation table, accessible under the job’s Results node
-
- Users Ranked – Creates the SA_EX_ActiveSync_UsersRanked table accessible, under the job’s Results node
-
- Servers Ranked – Creates the SA_EX_ActiveSync_ServersRanked table accessible, under the job’s Results node
-
- SET HISTORY RETENTION – Sets retention period in months
- The default is 6 months. It can be modified.
- See the Exchange History Retention topic for additional information
The following analysis task deletes table data from the analysis jobs. This analysis task should remain cleared unless specifically needed:
CAUTION: Do not select the 00. Deletes all History option. This analysis task is for troubleshooting and cleanup only. Data will be deleted from the database.
-
- Delete all History
- See the Troubleshooting Data Collection topic for additional information
The following analysis task updates the table to clean the data so that any UserAgent information that is returned as NULL is updated based on existing data in the table:
- 01a. Clean NULL UserAgent – Updates UserAgent information which was returned as NULL based on existing data
In addition to the tables and views created by the analysis tasks, the EX_ActiveSync Job produces the following pre-configured reports:
| Report | Description | Default Tags | Report Elements |
|---|---|---|---|
| Device Types (Device Population) | This report identifies what device models are currently being used with ActiveSync, and the average load they put on the environment each day. | None | This report is comprised of two elements: - Bar Chart – Displays most popular devices - Table – Provides details on most popular devices |
| Server Traffic (Top Servers by Average Daily Traffic) | This report ranks CAS servers by volume of ActiveSync traffic. | None | This report is comprised of two elements: - Bar Chart – Displays top users by average daily traffic - Table – Provides details on top users by average daily traffic |
| Top Users (Top Users by Average Daily Traffic) | This report shows the top users of ActiveSync. | None | This report is comprised of two elements: - Bar Chart – Displays top users by average daily traffic - Table – Provides details on top users by average daily traffic |
| User Devices (User Phones) | This report identifies all devices which have been associated with a User, and the time frames when they were used. | None | This report is comprised of one element: - Table – Provides details on user devices |
EX_ASPolicies Job
The EX_ASPolicies Job provides insight into what policies are enabled for which users.
Queries for the EX_ASPolicies Job
The EX_ASPolicies Job uses the ExchangePS Data Collector.
The following query is included in the EX_ASPolicies Job.
-
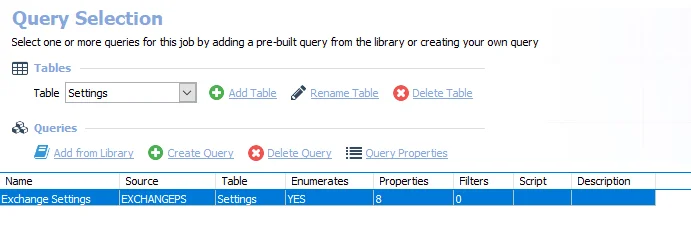
Exchange Settings – Collects user policy information
- By default set to search all mailboxes. However, it can be scoped.
- See the Scope the ExchangePS Data Collector topic for additional information
Scope the ExchangePS Data Collector
The ExchangePS Data Collector can be scoped if desired.
Follow the steps to scope the ExchangePS Data Collector:
Step 1 – Navigate to job’s Configure node and select Queries.
Step 2 – In the Query Selection view, select the Exchange Settings query and click Query Properties. The Query Properties window opens.
Step 3 – Select the Data Source tab, and click Configure. The ExchangePS Data Collector Wizard opens.
CAUTION: Do not modify other wizard pages. The wizard pages are pre-configured for this job.
Step 4 – Navigate to the Scope page, and select the desired scoping method from those available. See the ExchangePS: Scope topic for additional information.
- Scope by Database – Select the Scope by Database Target Host: Local Host option. Then, click Next and identify the desired databases on the Scope by Databases page. See the ExchangePS: Scope by DB topic for additional information.
- Scope by Mailbox – Select the Scope by Mailbox Target Host: Local Host option. Then, click Next and identify the desired mailboxes on the Scope by Mailboxes page. See the ExchangePS: Scope by Mailboxes topic for additional information.
- Scope by Server – Select the Scope by Server Target Host: Exchange MB Server option. The job returns results for specific servers selected in job’s Configure > Hosts node.
- Scope by Public Folder – Select the Scope by Public Folder option. Then, click Next and identify the desired mailboxes on the Scope by Public Folders page. See the ExchangePS: Scope by Public Folders topic for additional information.
- Remember, the scoping options available vary based on the pre-defined query configurations.
Step 5 – Navigate to the Summary page. Click Finish.
The job applies the modification to future job executions.
Analysis Tasks for the EX_ASPolicies Job
View the analysis tasks by navigating to the Exchange > 2. CAS Metrics > EX_ASPolicies > Configure node and select Analysis.
CAUTION: Do not modify or deselect the selected analysis task. The analysis task is preconfigured for this job.
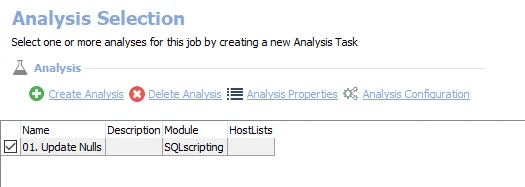
The following analysis task is selected by default:
-
- Update Nulls – Updates the NULLs in the table to show information
In addition to the tables and views created by the analysis task, the EX_ASPolicies Job produces the following pre-configured report:
| Report | Description | Default Tags | Report Elements |
|---|---|---|---|
| User ActiveSync Policies (ActiveSync Settings) | Exchange introduced many ActiveSync policies and settings which can be applied to users. This report identifies which users have these settings enabled. | None | This report is comprised of two elements: - Pie Chart – Displays ActiveSync Policies - Table – Provides details ActiveSync Policies |
0.Collection > EX_IISLogs Job
The 0.Collection > EX_IISLogs Job provides data collection to be utilized in the ActiveSync, Outlook Web Access, and Outlook Anywhere Reports. This job goes out to each server that contains the IIS Logs and parses the log to return the data to the Enterprise Auditor database.

The EX_IISLogs job is located in the 0.Collection Job Group.
Queries for the EX_IISLogs Job
The EX_IISLogs Job uses the SMARTLog Data Collector.
The following query is included in the EX_IISLogs Job:
-
IIS Logs – Collects IIS Logs
- By default set to process log files for the last 3 days. This time frame can be modified
- See the Configure the IIS Logs Query topic for additional information
Configure the IIS Logs Query
The EX_IISLogs Job has been preconfigured to run with the default settings with the Log Type of Internet Information Server Log. However, the time frame for the log files to be processed can be modified on the Target Log page of the SMART Log DC Wizard. See the SMARTLog Data Collector topic for additional information.
Follow the steps to modify the query configuration.
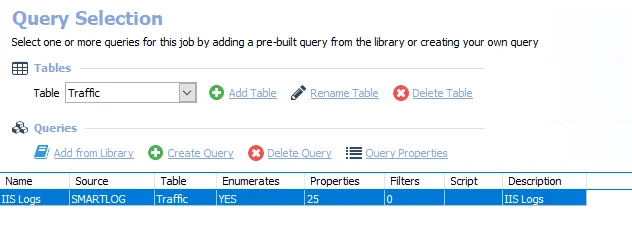
Step 1 – Navigate to the Exchange > 2. CAS Metrics > 0. Collection > EX_IISLogs > Configure node and select Queries.
Step 2 – In the Query Selection view, click Query Properties. The Query Properties window opens.
Step 3 – Select the Data Source tab, and click Configure. The SMART Log DC Wizard opens.
CAUTION: Do not modify other wizard pages. The other wizard pages are pre-configured for this job.
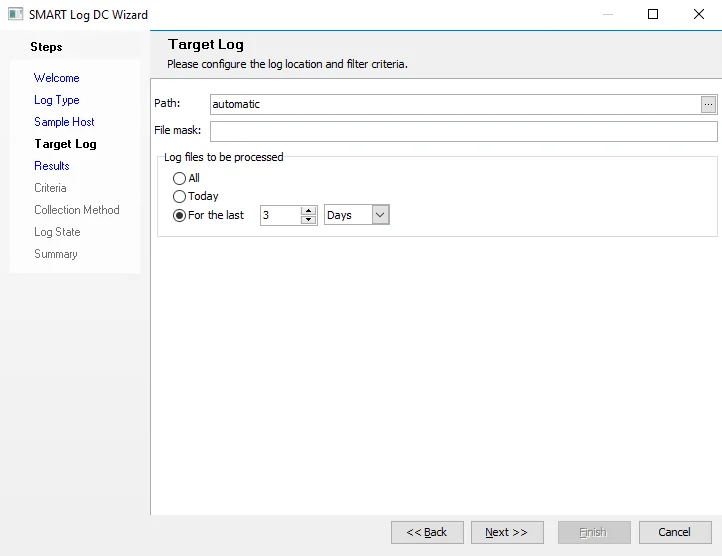
Step 4 – Navigate to the Target Log page, and configure the time frame as required. See the SMARTLog: Target Log topic for additional information.
Remember, if the date range configuration includes data older than the last scan, the Persist Log State checkbox on the Log State page must be disabled.
Step 5 – Navigate to the Summary page. Click Finish.
The EX_IISLogs Job applies the modifications to future job executions.
Outlook Web Access > EX_OWATraffic Job
The EX_OWATraffic Job provides visibility into Outlook Web Access Traffic in the organization.

The EX_OWATraffic job is located in the Outlook Web Access Job Group.
Analysis Tasks for the EX_OWATraffic Job
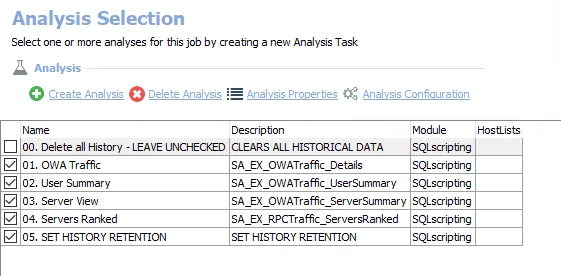
View the analysis tasks by navigating to the Exchange > 2. CAS Metrics > Outlook Web Access > EX_OWATraffic > Configure node and select Analysis.
CAUTION: Most of these analysis tasks are preconfigured and should not be modified ordeselected. There is one that is deselected by default, as it is for troubleshooting purposes.
The following analysis tasks are selected by default:
-
- OWA Traffic – Creates the SA_EX_OWATraffic_Details table, accessible under the job’s Results node
-
- User Summary – Creates the SA_EX_OWATraffic_UserSummary table, accessible under the job’s Results node
-
- Server View – Creates the SA_EX_OWATraffic_ServerSummary table, accessible under the job’s Results node
-
- Server View – Creates the SA_EX_OWATraffic_ServerRanked table, accessible under the job’s Results node
-
- SET HISTORY RETENTION – Sets retention period in months
- By default it is set to retain 6 months. This can be modified.
- See the Exchange History Retention topic for additional information
The following analysis task deletes table data from data collection and analysis jobs. This analysis task should remain cleared unless specifically needed:
CAUTION: Do not select the 00. Delete all History option. This analysis task is for troubleshooting and cleanup only. Data will be deleted from the database.
-
- Deletes all History - LEAVE UNCHECKED – Clears all historical data
- See the Troubleshooting Data Collection topic for additional information
In addition to the tables and views created by the analysis tasks, the EX_OWATraffic Job produces the following pre-configured reports:
| Report | Description | Default Tags | Report Elements |
|---|---|---|---|
| Top Servers by Average Load | This report shows servers with the highest average load. | None | This report is comprised of two elements: - Bar Chart – Displays top servers by average daily user count - Table – Provides details on top servers by average daily user count |
| Top Users (Outlook Web Access Traffic) | This report identifies top users of OWA. | None | This report is comprised of two elements: - Bar Chart – Displays top users - Table – Provides details on top users |
Outlook Anywhere > EX_RPCTraffic Job
The EX_RPCTraffic job provides visibility into Outlook Anywhere or RPC\HTTPs Traffic in the organization.

The EX_RPCTraffic job is located in the Outlook Anywhere job group.
Analysis Tasks for the EX_RPCTraffic Job
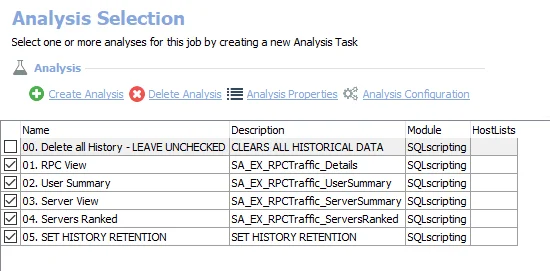
View the analysis tasks by navigating to the Exchange > 2. CAS Metrics > Outlook Anywhere > EX_RPCTraffic > Configure node and select Analysis.
CAUTION: Do not modify or deselect the selected analysis tasks. The analysis tasks are preconfigured for this job.
The following analysis tasks are selected by default:
-
- RPC View – Creates the SA_EX_RPCTraffic_Details table, accessible under the job’s Results node
-
- User Summary – Creates the SA_EX_RPCTraffic_UserSummary table, accessible under the job’s Results node
-
- Server View – Creates the SA_EX_RPCTraffic_ServerSummary table, accessible under the job’s Results node
-
- Servers Ranked – Creates the SA_EX_RPCTraffic_ServerRanked table, accessible under the job’s Results node
-
- SET HISTORY RETENTION – Sets retention period in months
- The default is 6 months. It can be modified.
- See the Exchange History Retention topic for additional information
The following analysis tasks deletes table data from data collection and analysis jobs. These analysis tasks should remain cleared unless specifically needed:
CAUTION: Do not select the 00. Delete all History option. This analysis task is for troubleshooting and cleanup only. Data will be deleted from the database.
-
- Delete all History - LEAVE UNCHECKED – Clears all historical data
- See the Troubleshooting Data Collection topic for additional information
In addition to the tables and views created by the analysis tasks, the EX_RPCTraffic Job produces the following pre-configured reports:
| Report | Description | Default Tags | Report Elements |
|---|---|---|---|
| Top Servers by Average Load ( Top Servers by Average Daily User Count) | This report shows servers with the highest average load. | None | This report is comprised of two elements: - Stacked Bar Chart – Displays top servers by average daily user count - Table – Provides details on top servers by average daily user count |
| Top Users (Outlook Anywhere Traffic) | This report identifies top users of Outlook Anywhere. | None | This report is comprised of two elements: - Bar Chart – Displays top users - Table – Provides details on top users |
2.CAS Metrics Job Group
The 2. CAS Metrics Job Group is comprised of data collection, analysis and reports that focus on remote connections (Outlook Web Access, ActiveSync, and Outlook Anywhere Access) occurring within your organization. This job group goes out to each server that contains the IIS Logs and parses the logs to return the data to the Enterprise Auditor database.
The jobs in the 2.CAS Metrics Job Group are:
-
0.Collection > EX_IISLogs Job – Provides data collection to be utilized in the ActiveSync, Outlook Web Access, and Outlook Anywhere Reports. This job group goes out to each server that contains the IIS Logs and parses the logs to return the data to the Enterprise Auditor database.
-
ActiveSync > EX_ActiveSync Job – Provides visibility into ActiveSync Traffic in the Organization
-
Outlook Anywhere > EX_RPCTraffic Job – Provides visibility into Outlook Anywhere or RPC\HTTPs Traffic in the organization
-
Outlook Web Access > EX_OWATraffic Job – Provides visibility into Outlook Web Access Traffic in the organization
-
EX_ASPolicies Job – Comprised of data collection and a report to show information about what policies are enabled for which users
NOTE: An actual CAS name is required for the data collection. When targeting Exchange 2013 or 2016, it is possible for the Settings > Exchange node to have been configured with a web address instead of an actual server. See the ExchangePS Data Collector & Client Access Server topic for additional information.
Recommended Configurations for the 2. CAS Metrics Job Group
Dependencies
The following job groups need to be successfully run:
- .Active Directory Inventory Job Group
- .Entra ID Inventory Job Group
Targeted Hosts
The 0. Collection Job Group has been set to run against the following default dynamic host list:
- Exchange CAS Servers
The EX_ASPolicies Job has been set to run against the following default dynamic host list:
- Exchange MB Servers
NOTE: Default dynamic host lists are populated from hosts in the Host Master Table which meet the host inventory criteria for the list. Ensure the appropriate host lists have been populated through host inventory results.
RECOMMENDED: Modify hosts lists only in the 0. Collection Job Group or EX_ASPolicies Job.
Connection Profile
A Connection Profile must be set directly on the EX_IISLogs Job and the EX_ASPolicies Job.
See the Exchange Remote Connections Permissions topic for the EX_IISLogs Job required permissions. See the Exchange PowerShell Permissions topic for the EX_ASPolicies Job requirements.
See the Connection topic for additional information.
Schedule Frequency
This job group has been designed to run daily one hour after the 1.HUB Metrics Job Group to process and collect the previous day’s message tracking logs.
RECOMMENDED: Run this Job Group at 2:00 AM.
History Retention
History retention should not be enabled on this job group. History is kept through analysis tasks. Modify the following analysis tasks to customize the amount of history which is kept.
| Job Name | Analysis Task Name | Default History |
|---|---|---|
| EX_ActiveSync | SET HISTORY RETENTION | 6 Months |
| EX_RPCTraffic | SET HISTORY RETENTION | 6 Months |
| EX_OWATraffic | SET HISTORY RETENTION | 6 Months |
Query Configuration
The 2. CAS Metrics Job Group is designed to be run with the default query configurations. However, the following queries can be modified:
- 0. Collection > EX_IISLogs Job – IIS Logs Query
- EX_ASPolicies Job – Exchange Settings Query
No other queries should be modified.
Analysis Configuration
The 2. CAS Metrics Job Group should be run with the default analysis configurations.
CAUTION: Most of these analysis tasks are preconfigured and should not be modified or deselected. There are some that are deselected by default, as they are for troubleshooting purposes.
The following analysis tasks should not be deselected, but their parameters can be modified:
- ActiveSync > EX_ActiveSync Job – 07. SET HISTORY RETENTION Analysis Task
- Outlook Anywhere > EX_RPCTraffic Job – 05. SET HISTORY RETENTION Analysis Task
- Outlook Web Access > OWATraffic Job – 05. SET HISTORY RETENTION Analysis Task
Workflow
Step 1 – Set a Connection Profile on the jobs which run data collection.
Step 2 – Ensure the prerequisite 1. HUB Metrics job group is successfully executed.
Step 3 – Schedule the 2. CAS Metrics job group to run daily one hour after running the 1. HUB Metrics job group.
RECOMMENDED: Run Job group at 2:00 AM.
Step 4 – Review the reports generated by the jobs.
.AppletStatusCheck Job
The .AppletStatusCheck Job checks the health and status of the applet deployed to the target Exchange servers.
Queries for the .AppletStatusCheck Job
The .AppletStatusCheck Job uses the Script Data Collector.
CAUTION: Do not modify the query. The query is preconfigured for this job.
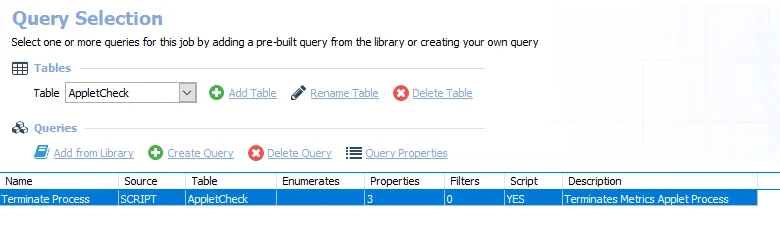
The following query is included with the .AppletStatusCheck Job:
- Terminate Process – Terminates the metrics applet process
EX_MetricsCollection Job
The EX_MetricsCollection Job is comprised of multiple queries that utilize the ExchangeMetrics Data Collector to process and collect the message tracking logs on the Exchange servers in the environment. These queries collect server, domain, user, and distribution list traffic including but not limited to: sent, received, journal, NDRs, and transports messages. These queries are configured to process and collect that previous 7 days of Message Tracking Logs the first time this job is run, after that it only collects the previous day unless the Enable Persistent Log State option has been enabled in the query.
RECOMMENDED: Run this job with the default configuration settings for all queries.
See the ExchangeMetrics Data Collector topic for additional information.
Queries for the EX_MetricsCollection Job
The EX_MetricsCollection Job uses the ExchangeMetrics Data Collector.
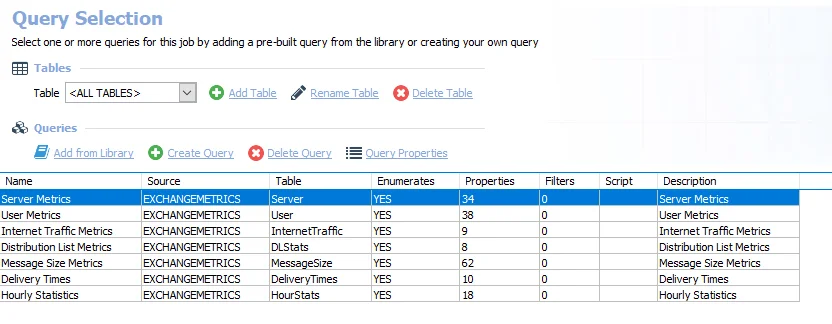
The following queries are included in the EX_MetricsCollection Job:
- Server Metrics – Collects server metrics
- User Metrics – Collects user metrics
- Internet Traffic Metrics – Collects internet traffic metrics
- Distribution List Metrics – Collects distribution list metrics
- Message Size Metrics – Collects message size metrics
- Delivery Time – Collects delivery times metrics
- Hourly Statistics – Collects server metrics
Analysis Tasks for the EX_MetrixCollection Job
View the analysis tasks by navigating to the Exchange > 1. HUB Metrics > 0. Collection > EX_MetricsCollection > Configure node and selecting Analysis.
CAUTION: Do not modify or deselect the selected analysis tasks. The analysis tasks are preconfigured for this job.
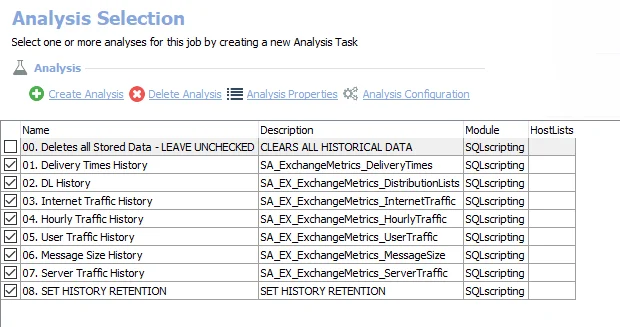
The following analysis tasks are selected by default:
-
- Delivery Times History – Creates the SA_ExhangeMetrics_DeliveryTimes table, accessible under the job’s Results node
-
- DL History – Creates the SAEX ExhangeMetrics_DistributionLists table, accessible under the job’s Results node
-
- Internet Traffic History – Creates the SA_EX_ExhangeMetrics_InternetTraffic table, accessible under the job’s Results node
-
- Hourly Traffic History – Creates the SA_EX_ExhangeMetrics_HourlyTraffic table, accessible under the job’s Results node
-
- User Traffic History – Creates the SA_EX_ExhangeMetrics_UserTraffic table, accessible under the job’s Results node
-
- Message Size History – Creates the SA_EX_ExhangeMetrics_MessageSize table, accessible under the job’s Results node
-
- Server Traffic History – Creates the SA_EX_ExhangeMetrics_ServerTraffic table, accessible under the job’s Results node
-
- SET HISTORY RETENTION – Sets retention period in months
- By default set to retain 6 months
- This retention period can be modified. See the Exchange History Retention topic for additional information.
The following analysis task deletes table data from data collection and analysis jobs. This analysis task should remain deselected unless specifically needed:
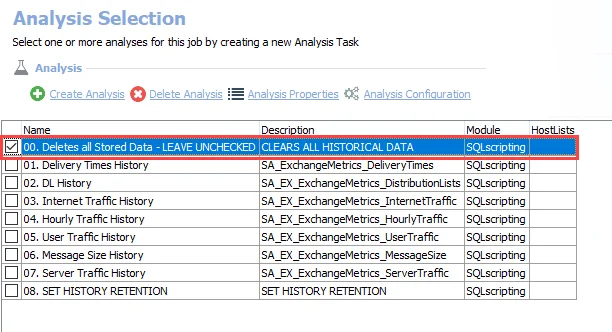
CAUTION: Do not select the 00. Deletes all Stored Data option. This analysis task is for troubleshooting and cleanup only. Data will be deleted from the database.
-
- Deletes all Stored Data - LEAVE UNCHECKED – Clears all historical data
- See the Troubleshooting Data Collection topic for additional information
Exchange History Retention
The 08. SET HISTORY RETENTION analysis task controls the retention period for the job’s data. This is why the Data Retention Period options at the global, job group, or job Properties settings are not supported for the job group. The number of months can be modified. If desired, the parameter can be set to a specified number of days. Follow these steps to modify the history retention period.
Step 1 – Navigate to the job’s Configure node and select Analysis.
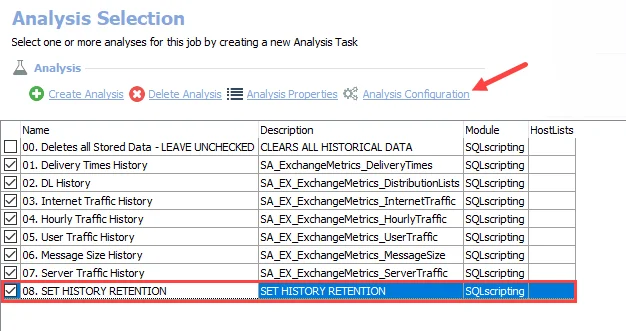
Step 2 – In the Analysis Selection view, select the 08. SET HISTORY RETENTION analysis task and click Analysis Configuration. The SQL Script Editor opens.
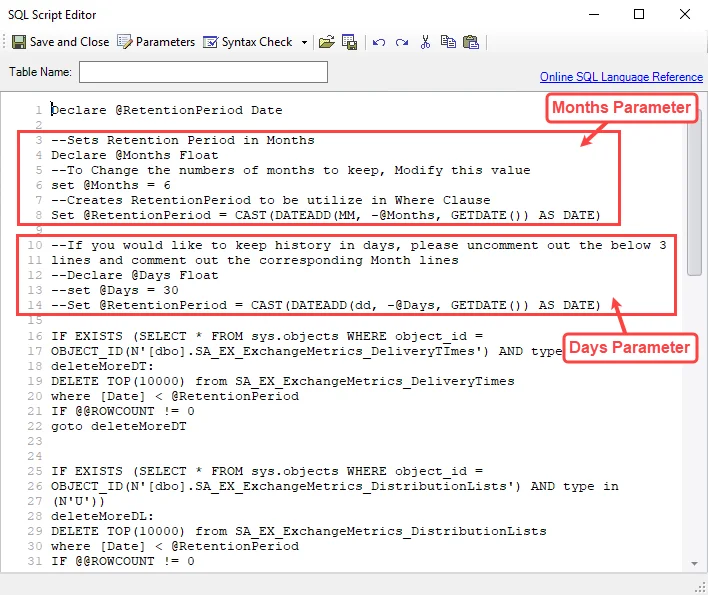
Step 3 – To modify the number of months: On line 6, modify the value for the months parameter:
Skip to Step 5.
Step 4 – To change the period parameter from months to days:
-
Comment out lines 4, 6, and 8 which contain the months parameter. To comment out a line add
--preceding it. The months parameter section should be as follows:--Sets Retention Period in Months
--Declare @Months Float
--To Change the numbers of months to keep, Modify this value
--set @Months = 6
--Creates RetentionPeriod to be utilize in Where Clause
--Set @RetentionPeriod = CAST(DATEADD(MM, -@Months, GETDATE()) AS DATE) -
Uncomment out (remove
--from) lines 12, 13, and 14 (which contain the days parameter). The days parameter section should be as follows: -
If desired, modify the number of days on line 13. The default days parameter is set to 30 days.
Step 5 – Click Save and Close. The SQL Script Editor closes.
The modified history retention period is now applied during future job executions.
Troubleshooting Data Collection
There might be times when it is necessary to purge the data either through dropping the tables from the database or truncating the data within the tables. This option is provided through ananalysis task that is not selected by default. Only one analysis task within a job should be enabled when the desire is to purge that database.
CAUTION: This analysis task deletes information collected or produced by jobs in this solution.
Follow these steps to troubleshoot data collection:
Step 1 – Navigate to the job’s Configure node and select Analysis.
Step 2 – In the Analysis Selection view, clear all default analysis tasks (if any) and select the analysis task which purges data.
Remember, only one task should be selected.
Step 3 – In the Navigation pane, right-click the Analysis node and select Execute Analyses.
Step 4 – After the analysis task has been executed, return to the Analysis Selection view. Deselect the analysis task which was executed and reselect the default analysis tasks (if any had been cleared in Step 2).
The selected purge of data and tables has taken place, and the analysis tasks have been reset to the default state.
EX_MetricsDetails Job
The EX_MetricsDetails Job collects daily user-to-user Traffic. Walk through this jobs query to configure the internal domains to collect the sender to recipient traffic from. By default, the query is configured to collect the previous 1 day of Message Tracking Logs and has @netwrix.com configured as the domain. If the domains are not configured in the query, then most likely data collection does not return.
Queries for the EX_MetricsDetails Job
The EX_MetricsDetails Job uses the ExchangeMetrics Data Collector.
The following query is included in the EX_MetricsDetails Job:
-
Activity metrics – Collects user to user traffic per day
- Domains must be configured for data collection to return data
- See the Configure the Activity Metrics Query topic for additional information
Configure the Activity Metrics Query
The Activity Metrics Query has been preconfigured to run with the ExchangeMetrics Data Collector to collect user traffic per day. The domains must be configured for data collection to return data.
Follow the steps to configure the Activity Metrics Query.
Step 1 – Navigate to the Exchange > 1. HUB Metrics > 0. Collection > EX_MetricsDetails > Configure node and select Queries.
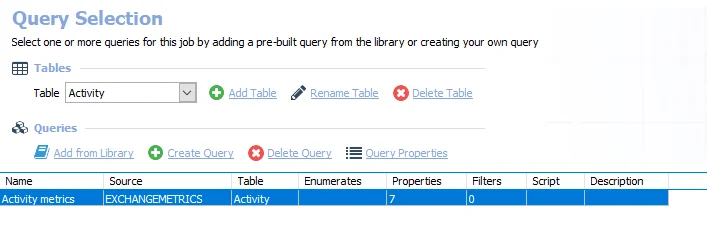
Step 2 – In the Query Selection view, select the Activity metrics Query and click Query Properties. The Query Properties window opens.
Step 3 – Select the Data Source tab, and click Configure. The Exchange Metrics Data Collector Wizard opens.
CAUTION: Do not modify other wizard pages. The wizard pages are pre-configured for this job.
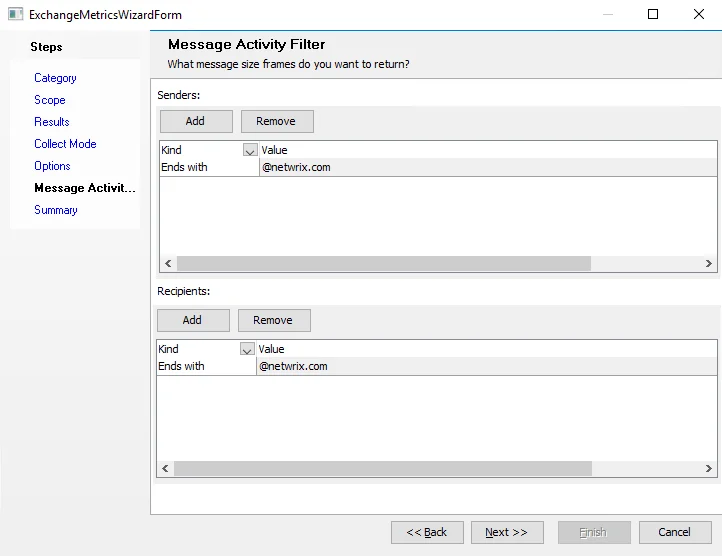
Step 4 – Navigate to the
ExchangeMetrics: Message Activity Filter
page to configure the internal domains from which to collect the sender to recipient traffic. The
filter should remain Ends With. Replace the @netwrix.com variable for both the Senders and
Recipients with the @domain.com variable to be audited.
Step 5 – Navigate to the Summary page and click Finish.
The EX_MetricsDetails Job returns data for the identified sender and recipient domains.
Analysis Tasks for the EX_MetricsDetails Job
View the analysis tasks by navigating to the Exchange > 1. HUB Metrics > 0. Collection > EX_MetricsDetails > Configure node and selecting Analysis.
CAUTION: Do not modify or deselect the selected analysis tasks. The analysis tasks are preconfigured for this job.
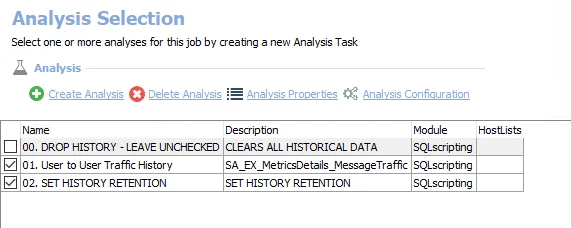
The following analysis tasks are selected by default:
-
- User to User Traffic History – Creates the SA_EX_ExhangeMetrics_MessageTraffic table accessible under the job’s Results node
-
- SET HISTORY RETENTION – Sets retention period in months
- By default set to retain 6 months
- This retention period can be modified. See the Exchange History Retention topic for additional information.
The following analysis task clears table data from data collection and analysis jobs. This analysis task should remain deselected unless specifically needed:
CAUTION: Do not select the 00. DROP HISTORY option. This analysis task is for troubleshooting and cleanup only. Data will be deleted from the database.
-
- DROP HISTORY - LEAVE UNCHECKED – Clears all historical data
- See the Troubleshooting Data Collection topic for additional information
0. Collection Job Group
The 0.Collection Job Group is comprised of jobs that process and analyze the message tracking logs on the Exchange Servers in the environment.
The jobs in the 0.Collection Job Group are:
-
AppletStatusCheck Job – Checks the health and status of the applet deployed to the target Exchange servers
-
EX_MetricsCollection Job – Comprised of multiple queries that utilize the Exchange Metrics Data Collect to process and collect the message tracking logs on the Exchange servers in the environment. These queries collect server, domain, user, and distribution list traffic including but not limited to sent, received, journal, NDRs, and transports message. These queries are configured to process and collect that previous 7 days of Message Tracking Logs the first time this job is run, after that it only collects the previous day assuming persistence has not been disabled inside the query.
-
EX_MetricsDetails Job – Collects user to user traffic per day
NOTE: This job's query needs to be configured to the internal domains from which to collect the sender to recipient traffic. By default, the query is configured to collect the previous 1 day of Message Tracking Logs and has @netwrix.com configured as the domain. If the domains are not configured in the query, then most likely data collection does not return.
EX_DeliveryTimes Job
The EX_DeliveryTimes Job provides information around organizational and server-level delivery times.
Analysis Tasks for the EX_DeliveryTimes Job
View the analysis tasks by navigating to the Exchange > 1. HUB Metrics > EX_DeliveryTimes > Configure node and select Analysis.
CAUTION: Do not modify or deselect the selected analysis tasks. The analysis tasks are preconfigured for this job.
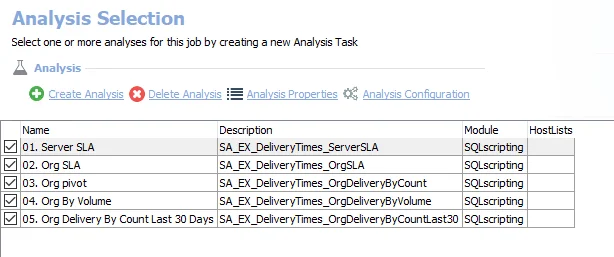
The following analysis tasks are selected by default:
-
- Server SLA – Creates the SA_EX_DeliveryTimes_ServerSLA table, accessible under the job’s Results node
-
- Org SLA – Creates the SA_EX_DeliveryTimes_OrgSLA table, accessible under the job’s Results node
-
- Org pivot – Creates the SA_EX_DeliveryTimes_OrgDeliveryByCount table, accessible under the job’s Results node
-
- Org By Volume – Creates the SA_EX_DeliveryTimes_OrgDeliveryByVolume table, accessible under the job’s Results node
-
- Org Delivery By Count Last 30 Days – Creates the SA_EX_DeliveryTimes_OrgDeliveryByCountLast30 table, accessible under the job’s Results node
In addition to the tables and views created by the analysis tasks, the EX_DeliveryTimes Job produces the following pre-configured report:
| Report | Description | Default Tags | Report Elements |
|---|---|---|---|
| Delivery Times | This report highlights delivery times overall and by server to identify potential issues with SLAs. | None | This report is comprised of three elements: - Line Chart – Displays percent of mail delivered by time frame (last 30 days) - Table – Provides details on mail delivered by time frame - Table – Provides details on percentage of mail delivered in under 1 minute |
EX_DLMetrics Job
The EX_DLMetrics Job provides information around distribution list usage.
Analysis Tasks for the EX_DLMetrics Job
View the analysis tasks by navigating to the Exchange > 1. HUB Metrics > EX_DLMetrics > Configure node and select Analysis.
CAUTION: Do not modify or deselect the selected analysis tasks. The analysis tasks are preconfigured for this job.
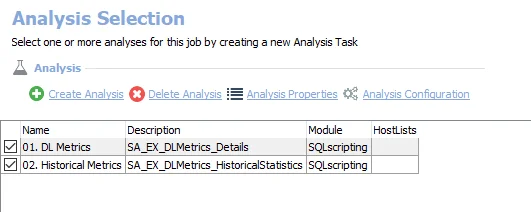
The following analysis tasks are selected by default:
-
- DL Metrics – Creates the SA_EX_DLMetrics_Details table, accessible under the job’s Results node
-
- Historical Metrics – Creates the SA_EX_DLMetrics_HistoricalStatistics table, accessible under the job’s Results node
In addition to the tables and views created by the analysis tasks, the EX_DLMetrics Job produces the following pre-configured reports:
| Report | Description | Default Tags | Report Elements |
|---|---|---|---|
| Distribution Lists by Message Count (Most Active DLs by Message Count) | This report identifies the most active distribution lists by count of messages sent. | None | This report is comprised of two elements: - Bar Chart – Displays top distribution lists by message count (last 30 days) - Table – Provides details on top distribution lists by message count (last 30 days) |
| Distribution Lists by Message Volume (Most Active DLs by Message Volume) | This report identifies the most active distribution lists by volume of messages sent. | None | This report is comprised of two elements: - Bar Chart – Displays top distribution lists by message volume (last 30 days) - Table – Provides details on distribution lists by message volume (last 30 days) |
EX_DomainMetrics Job
The EX_DomainMetrics Job provides information about where the domain’s mail flow is going to and coming from.
Analysis Tasks for the EX_DomainMetrics Job
View the analysis tasks by navigating to the Exchange > 1. HUB Metrics > EX_DomainMetrics > Configure node and select Analysis.
CAUTION: Do not modify or deselect the selected analysis tasks. The analysis tasks are preconfigured for this job.
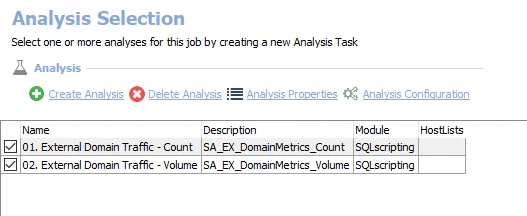
The following analysis tasks are selected by default:
-
- External Domain Traffic - Count – Creates the SA_EX_DomainMetrics_Count table, accessible under the job’s Results node
-
- External Domain Traffic - Volume – Creates the SA_EX_DomainMetrics_Volume table, accessible under the job’s Results node
In addition to the tables and views by the analysis tasks, the EX_DomainMetrics Job produces the following pre-configured reports:
| Report | Description | Default Tags | Report Elements |
|---|---|---|---|
| Top External Domains by Message Count (Top External Domains) | This report identifies which external domains have the largest traffic flow between organizations. | None | This report is comprised of three elements: - Stacked Bar Chart – Displays access by team - Table – Provides a database access summary - Table – Provides database access details |
| Top External Domains by Message Volume (Top External Domains) | This report identifies which external domains have the largest traffic flow between orgs. | None | This report is comprised of two elements: - Stacked Bar Chart – Displays top domain by message count (30 days) - Table – Provides details on top domain by message count (30 days) |
EX_HourlyMetrics Job
The EX_HourlyMetrics Job provides visibility into how much mail-flow the organization sends and receives each hour.
Analysis Tasks for the EX_HourlyMetrics Job
View the analysis tasks by navigating to the Exchange > 1. HUB Metrics > EX_HourlyMetrics > Configure node and select Analysis.
CAUTION: Do not modify or deselect the selected analysis tasks. The analysis tasks are preconfigured for this job.
CAUTION: Do not modify or deselect the selected analysis tasks. The analysis tasks are preconfigured for this job.
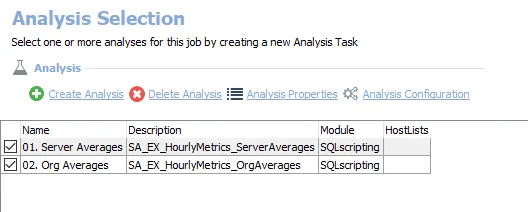
The following analysis tasks are selected by default:
-
- Server Averages – Creates the SA_EX_HourlyMetrics_ServerAverages table, accessible under the job’s Results node
-
- Org Averages – Creates the SA_EX_HourlyMetrics_OrgAverages table, accessible under the job’s Results node
In addition to the tables and views created by the analysis tasks, the EX_HourlyMetrics Job produces the following pre-configured reports:
| Report | Description | Default Tags | Report Elements |
|---|---|---|---|
| Hourly Traffic (Average Hourly Traffic) | This report identifies which hours during the day have the most traffic by count of messages. | None | This report is comprised of two elements: - Column Chart – Displays average hourly traffic by enterprise - Table – Provides details on average hourly traffic by server |
| Hourly Volume (Average Hourly Volume) | This report identifies which hours during the day have the most traffic by volume of messages. | None | This report is comprised of two elements: - Column Chart – Displays average hourly volume (MB) - Table – Provides details on server averages |
EX_MessageSize Job
The EX_MessageSize Job provides information around the size of sent and received messages.
Analysis Tasks for the EX_MessageSize Job
View the analysis task by navigating to the Exchange > 1. HUB Metrics > EX_MessageSize > Configure node and select Analysis.
CAUTION: Do not modify or deselect the selected analysis task. The analysis task is preconfigured for this job.
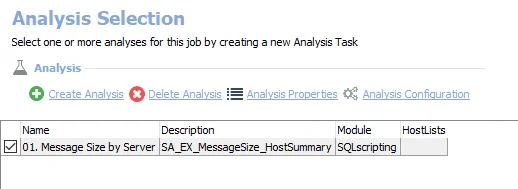
The following analysis task is selected by default:
-
- Message Size by Server – Creates the SA_EX_MessageSize_HostSummary table accessible under the job’s Results node
In addition to the tables and views created by the analysis task, the EX_MessageSize Job produces the following pre-configured report:
| Report | Description | Default Tags | Report Elements |
|---|---|---|---|
| Message Size | This report identifies servers which handle the largest mail. | None | This report is comprised of two elements: - Bar Chart – Displays top servers by average message size (KB) - Table – Provides details on average message size by server (KB) |
EX_ServerMetrics Job
The EX_ServerMetrics Job provides visibility into server mail flow statistics, such as, sent, received, journaling, transport, and NDR counts and sizes.
Analysis Tasks for the EX_ServerMetrics Job
View the analysis tasks by navigating to the Exchange > 1. HUB Metrics > EX_ServerMetrics > Configure node and select Analysis.
CAUTION: Do not modify or deselect the selected analysis tasks. The analysis tasks are preconfigured for this job.
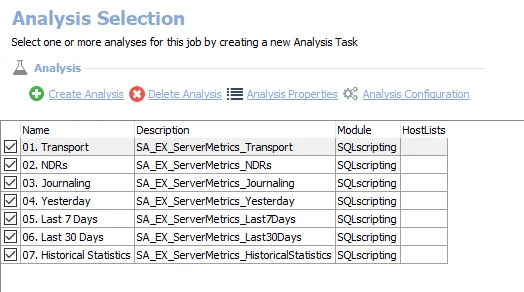
The following analysis tasks are selected by default:
-
- Transport – Creates the SA_EX_ServerMetrics_Transport table, accessible under the job’s Results node
-
- NDRs – Creates the SA_EX_ServerMetrics_NDRs table, accessible under the job’s Results node
-
- Journaling – Creates the SA_EX_ServerMetrics_Journaling table, accessible under the job’s Results node
-
- Yesterday – Creates the SA_EX_ServerMetrics_Yesterday table, accessible under the job’s Results node
-
- Last 7 Days – Creates the SA_EX_ServerMetrics_Last7Days table, accessible under the job’s Results node
-
- Last 30 Days – Creates the SA_EX_ServerMetrics_Last30Days table, accessible under the job’s Results node
-
- Historical Statistics – Creates the SA_EX_ServerMetrics_HistoricalStatistics table, accessible under the job’s Results node
In addition to the tables and views created by the analysis tasks, the EX_ServerMetrics Job produces the following pre-configured reports:
| Report | Description | Default Tags | Report Elements |
|---|---|---|---|
| Journaling (Journaling Traffic) | This report summarizes journaling message traffic across the organization. | None | This report is comprised of two elements: - Bar Chart – Displays top servers by journaling messages (last 30 days) - Table – Provides details on top servers by journaling messages (last 30 days) |
| NDRs (Exchange NDRs) | This report shows NDR counts broken down by server. | None | This report is comprised of two elements: - Bar Chart – Displays top servers by NDRs (last 30 days) - Table – Provides details on top servers by NDRs (last 30 days) |
| Server Traffic (Top Servers by Traffic) | This report summarizes server traffic across the organization for the Last 30 Days. | None | This report is comprised of two elements: - Stacked Bar Chart – Displays top servers by total traffic - Table – Provides details top servers by total traffic |
| Transport (Transport Messages) | This report summarizes transport messages across the exchange organization. | None | This report is comprised of two elements: - Bar Chart – Displays top servers by transport messages (last 30 days) - Table – Provides details on top servers by transport messages (last 30 days) |
EX_UserMetrics Job
The EX_UserMetrics Job provides information around each users mail-flow in the organization.
Analysis Tasks for the EX_UserMetrics Job
View the analysis tasks by navigating to the Exchange > 1. HUB Metrics > EX_UserMetrics > Configure node and select Analysis.
CAUTION: Do not modify or deselect the selected analysis tasks. The analysis tasks are preconfigured for this job.
The following analysis tasks are selected by default:
-
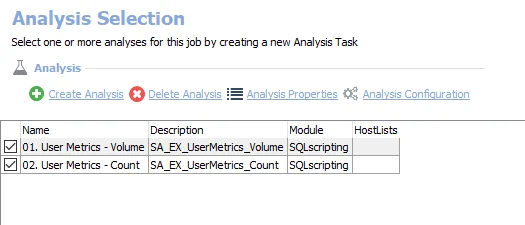
- User Metrics - Volume – Creates the SA_EX_UserMetrics_Volume table, accessible under the job’s Results node
-
- User Metrics - Count – Creates the SA_EX_UserMetrics_Count table, accessible under the job’s Results node
In addition to the tables and views created by the analysis tasks, the EX_UserMetrics Job produces the following pre-configured reports:
| Report | Description | Default Tags | Report Elements |
|---|---|---|---|
| Top Receivers by Message Count | This report identifies users who have received the most messages. | None | This report is comprised of two elements: - Bar Chart – Displays top receivers by message count (last 30 days) - Table – Provides details on top receivers by message count (last 30 days) |
| Top Receivers by Message Volume | This report identifies users who have received the most mail by total volume. | None | This report is comprised of two elements: - Bar Chart – Displays top receivers by message volume (last 30 days) - Table – Provides details on top receivers by message volume (last 30 days) |
| Top Senders by Message Count | This report identifies users who have sent the most mail. | None | This report is comprised of two elements: - Bar Chart – Displays top senders by message count (last 30 days) - Table – Provides details on top senders by message count (last 30 days) |
| Top Senders by Message Volume | This report identifies users who have sent the most mail by total volume. | None | This report is comprised of two elements: - Bar Chart – Displays top senders by message volume (last 30 days) - Table – Provides details on top senders by message volume (last 30 days) |
1.HUB Metrics Job Group
The 1. HUB Metrics Job Group is comprised of data collection, analysis and reports that focus on mail-flow activity occurring within your organization. This job group goes out to each server that contains the Message Tracking Logs and parse the log to return the data to the Enterprise Auditor database.
The following job groups and jobs comprise the 1. HUB Metrics Job Group:
- 0. Collection Job Group – Comprised of jobs that process and analyze the message tracking logs on the Exchange Servers in the environment
- EX_DeliveryTimes Job – Provides information around organizational and server level delivery times
- EX_DLMetrics Job – Provides information around distribution list usage
- EX_DomainMetrics Job – Provides information about which domains mail-flow is going to and coming from
- EX_HourlyMetrics Job – Provides visibility into how much mail-flow the organization sends and receives each hour
- EX_MessageSize Job – Provides information around size of messages sent and received
- EX_ServerMetrics Job – Provides visibility into server mail-flow statistics, such as, sent, received, journaling, transport and NDR counts and sizes
- EX_UserMetrics Job – Provides information around each user’s mail-flow in the organization
Recommended Configurations for the 1. HUB Metrics Job Group
Dependencies
The following Job Groups need to be successfully run:
- Active Directory Inventory Job Group
Targeted Hosts
The 0. Collection Job Group has been set to run against the following default dynamic host lists:
- Exchange 2016 MB Servers
- Exchange 2013 MB Servers
- Exchange HUB Servers
NOTE: Default dynamic host lists are populated from hosts in the Host Master Table which meet the host inventory criteria for the list. Ensure the appropriate host lists have been populated through host inventory results.
RECOMMENDED: Only modify host lists in the 0. Collection Job Group.
Connection Profile
A Connection Profile must be set directly on the EX_MetricsCollection Job and the EX_MetricsDetails Job. See the Exchange Mail-Flow Permissions topic for required permissions.
See the Connection topic for additional information.
Schedule Frequency
This job group has been designed to run daily to process and collect the previous day’s message tracking logs. Run this job after 12:01 AM when the logs on the Exchange servers have rolled over to the next day.
RECOMMENDED: Run this job group at 1:00 AM.
History Retention
History retention should not be enabled on this job group. History is kept through analysis tasks. Modify the following analysis tasks to customize the amount of history which is kept:
| Job Name | Analysis Task Name | Default History |
|---|---|---|
| EX_MetricsCollection | SET HISTORY RETENTION | 6 Months |
| EX_MetricsDetails | SET HISTORY RETENTION | 6 Months |
See the Exchange History Retention topic for additional information.
Query Configuration
The 1. HUB Metrics Job Group is designed to be run with the default query configurations with the following exceptions:
- EX_MetricsDetails Job – The Activity Metrics Query requires domains to be configured
- All queries in the 1.HUB Metrics Job Group that use the ExchangeMetrics Data Collector – (Optional) The Enable Persistent Log State option can be enabled on the Options page of the Exchange Metrics Data Collector Wizard to search the log from where the previous search left off. See the ExchangeMetrics: Options topic for additional information.
Analysis Configuration
The 1. HUB Metrics Job Group should be run with the default analysis configurations.
CAUTION: Most of these analysis tasks are preconfigured and should not be modified or deselected. There are a few which are deselected by default, as they are for troubleshooting purposes.
The following analysis tasks should not be deselected, but their parameters can be modified:
- 0. Collection > EX_MetricsCollection Job – 08. SET HISTORY RETENTION Analysis Task
- 0. Collection > EX_MetricsDetails Job – 02. SET HISTORY RETENTION Analysis Task
Workflow
Step 1 – Set a Connection Profile on the jobs that run data collection.
Step 2 – Schedule the 1. HUB Metrics Job Group to run daily.
RECOMMENDED: Run at 1:00 AM.
Step 3 – Review the reports generated by the jobs.