Viewing Generated Reports
Reports can be viewed either in the Access Analyzer Console in the Results Node of the related job, or published reports can be viewed in the Web Console.
- Results Node – All reports generated by a job are always accessible under the job’s Results node
- Web Console – All published reports generated by all jobs appear in the Published Reports Web Console
Results Node
Each job contains a results node where reports generated by that job can be viewed. Even if the report is unpublished, the report is still displayed here.
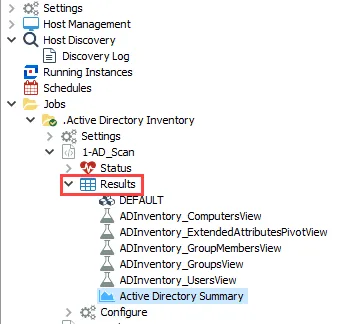
Select the desired report to be viewed. The report displays in the Results pane of the console.
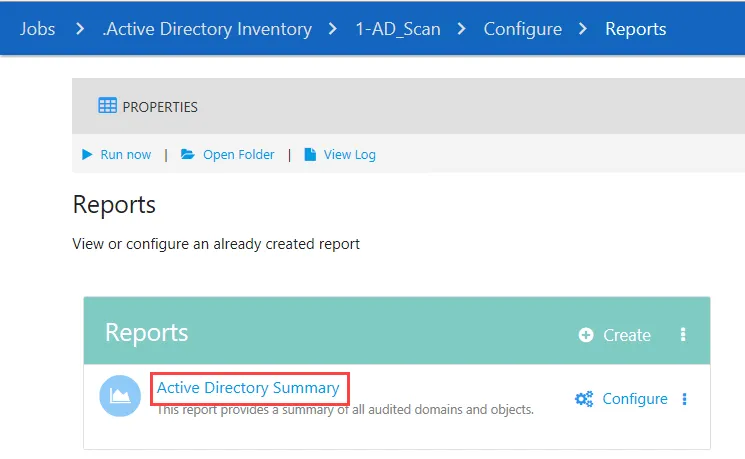
You can also access the report from the Configure > Reports page for the job. Click the report title to view the report.
Web Console
The most common place to view reports is the Web Console. For information on how to access the Web Console, see the Log into the Web Console topic.
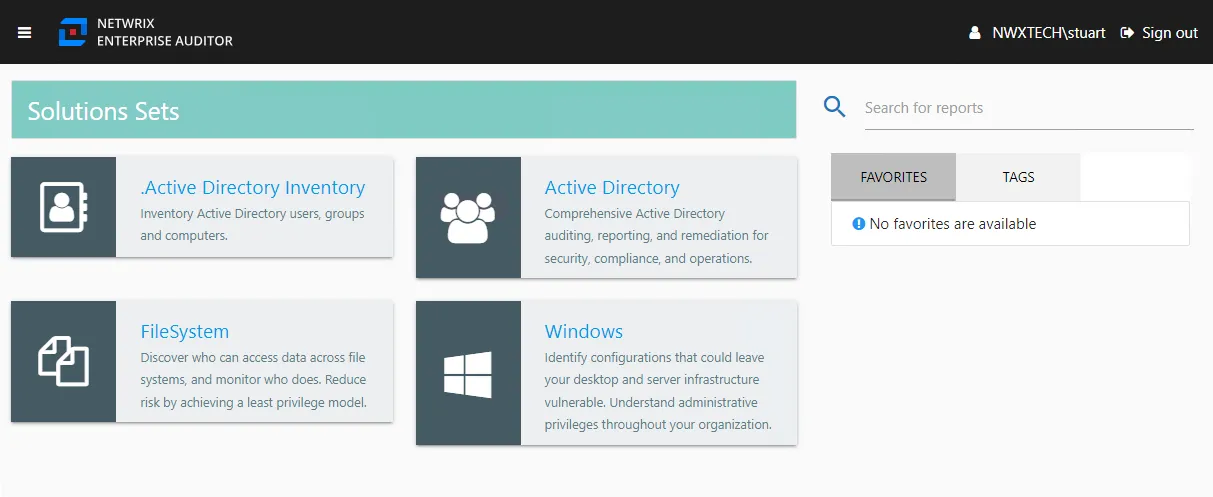
On the home page of the Web Console, select a solution to view a list of all published reports for that solution’s job group. This list includes reports with changed Publish Path locations.
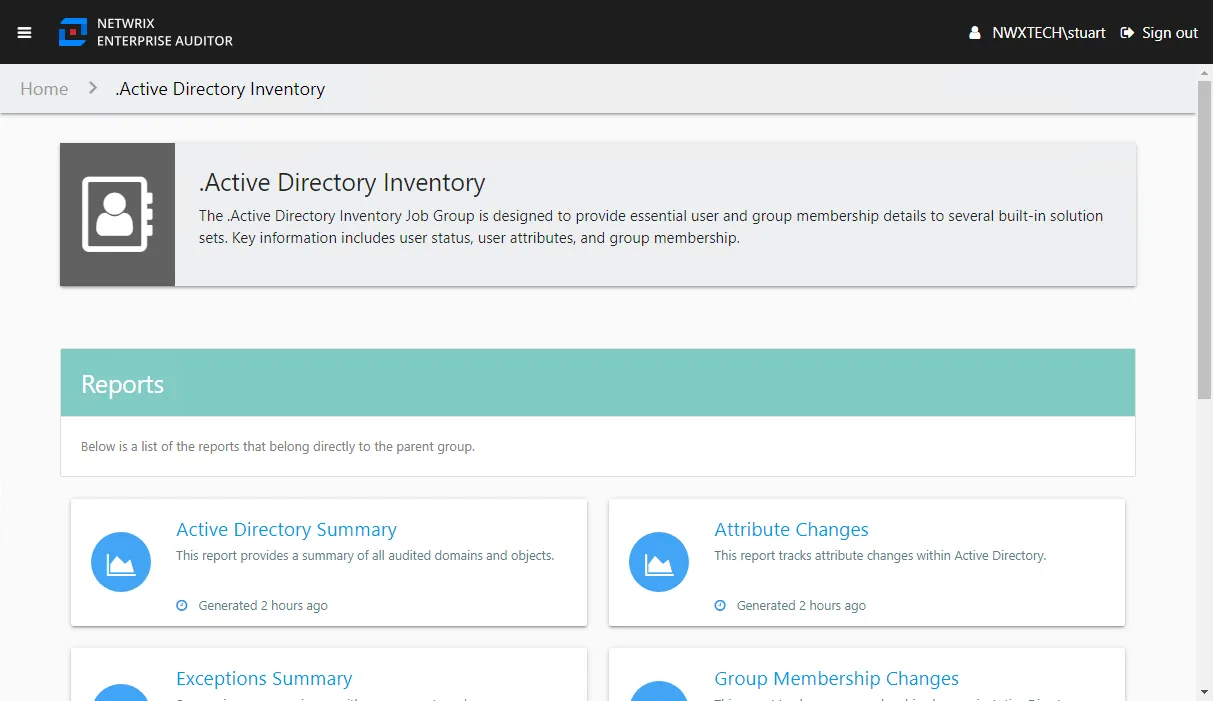
Clicking a report name link opens the selected report, or navigate through the folders to select a report.
From within the Web Console, reports cannot be edited or deleted. However, the interactive grid functions are enabled. See the Interactive Grids topic for additional information. An additional feature available within the Web Console is the option to download data as a CSV file, which can be enabled for grid elements. This exports the data within tables, both interactive grid and plain HTML tables. See the Grid topic for additional information.
NOTE: Any browser used to access the Web Console must have JavaScript allowed for the site. See the Configure JavaScript Settings for the Web Console topic for additional information.