Activity Statistics Report
The Activity Statistics report for a user object provides statistical activity event information for the audited user during the selected date range. This report includes a line graph for Traffic Trend.
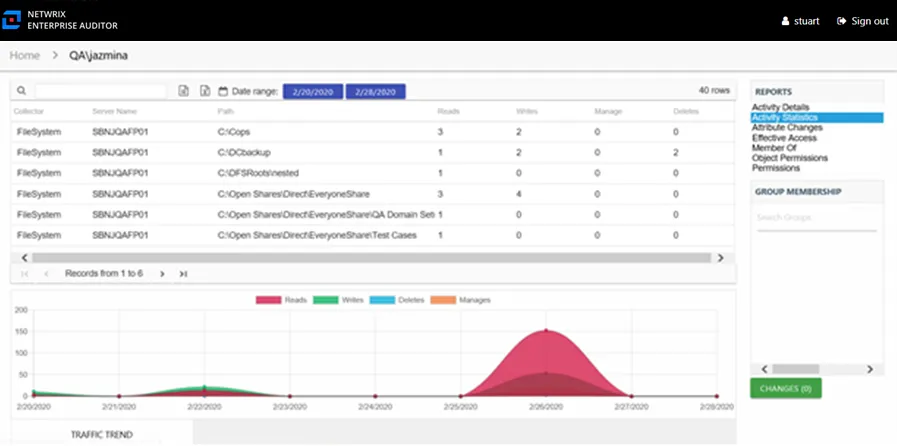
This report is comprised of the following columns:
- Collector – Refers to the collection source for the permission (for example, FileSystem for the Access Analyzer File System Solution, SharePoint for the Access Analyzer SharePoint Solution, and so on)
- Server Name – Name of the file system server or SharePoint farm/instance where the activity event occurred
- Path – Location of the resource where the activity event occurred
- Reads – Count of view/read operations on resource
- Writes – Count of edit/modify operations on resource
- Manages – Count of permission change operations on resource
- Deletes – Count of delete operations on resource
The table data grid behaves like other table grids. See the Data Grid Features topic for additional information.
The Traffic Trend line graph at the bottom displays the number of operation events by type over the selected date range. Each operation type appears in a different color, as shown in the legend. The graph indicates the volume of operations per day. See the Activity Report Results Pane Features topic for instructions on filtering the Trend graph.