Host Properties Window
Once a host has been added to the Monitored Hosts list, the configuration settings can be modified through the host’s Properties window.
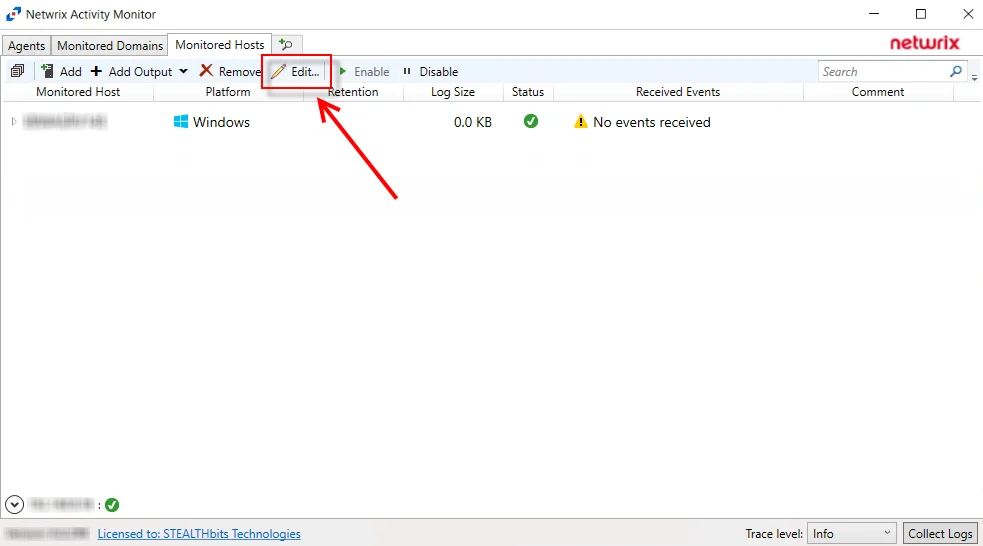
On the Monitored Hosts tab, select the host and click Edit, or right-click on a host and select Edit Host from the right-click menu, to open the host’s Properties window. The tabs vary based on the type of host selected:
- Auditing Tab — Dell Isilon/PowerScale devices only
- Connection Tab — Microsoft Entra ID, Exchange Online, and SharePoint Online only
- Dell Tab — Dell devices only
- FPolicy Tab — NetApp devices only
- Hitachi NAS Tab — Hitachi NAS devices only
- Inactivity Alerts Tab
- Logon Trigger Tab — SQL Server hosts only
- MS SQL Server Tab — SQL Server hosts only
- Nasuni Tab — Nasuni Edge Appliances only
- NetApp Tab — NetApp devices only
- Nutanix Tab — Nutanix devices only
- Panzura Tab — Panzura devices only
- Qumulo Tab — Qumulo devices only
- SharePoint Tab — SharePoint only
- Tweak Options Tab — SQL Server hosts only
- Unix IDs Tab — NetApp devices, Dell devices, and Nasuni Edge Appliances only
- Windows Tab — Windows hosts only
Auditing Tab
The Auditing tab allows users to modify to modify the Isilon Options setting which was populated with the information entered when the Dell Isilon host is added to the Monitored Hosts list.
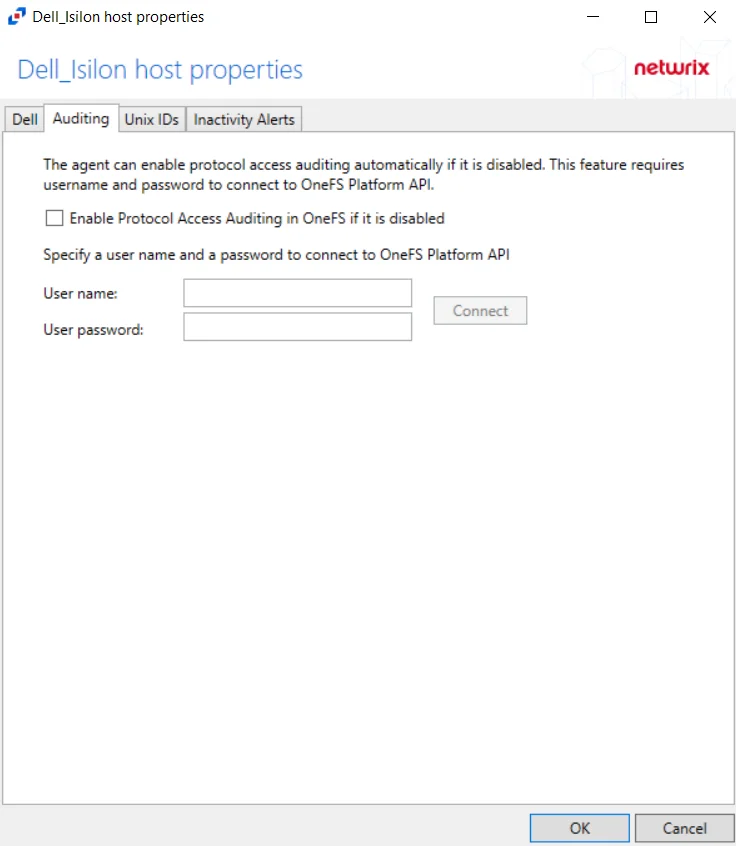
The Enable Protocol Access Auditing in OneFS if it is disabled box allows the activity agent to automatically enable and configure auditing on the Isilon cluster. If a manual configuration has been completed, do not enable these options. This option requires credentials for an Administrator account on the Dell Isilon device and click Connect.
If the connection is successful, discovered access zones appear in the Available box. By default, all available access zones are monitored. To monitor specific access zones, use the arrow buttons to move access zones to the Monitored box. All activity for this configuration for the host is collected and placed in a single activity log file per day. This is the supported option for integration with StealthAUDIT, which requires all access zones to be monitored from a single configuration.
To have one activity log file per access zone, create multiple output configurations for the Dell Isilon device. Add one access zone to each configuration of the monitored host. When adding an Isilon host for each access zone, the Dell device name will be the same for each configuration, but the CIFS/NFS server name must have a unique value.
Connection Tab
Once a host is added to the monitored hosts table, the configuration settings are edited through the tabs in the host’s Properties window. The Connection tab on a host’s Properties window is specific to Microsoft Entra ID (formerly Azure AD), Exchange Online, and SharePoint Online hosts.
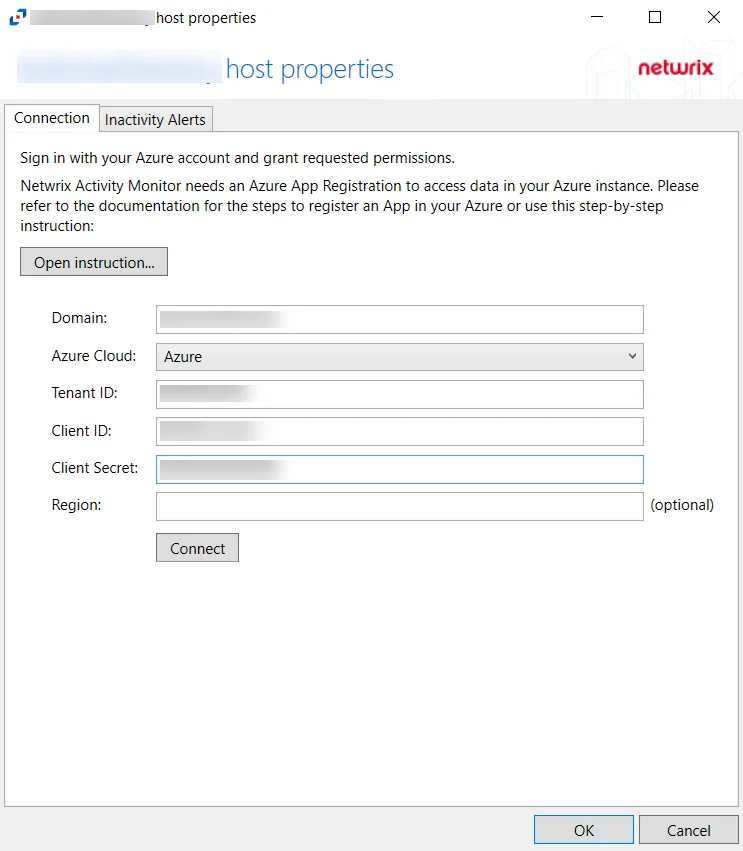
Configure App Registration information for a Microsoft Entra ID host in the Connection Tab of the host's Properties window. Click Open instructions... for steps on registering the Activity Monitor. Click Sign out to sign out of the Azure account.
The options that can be configured on the Connection Tab are:
- Domain
- Azure Cloud
- Tenant ID
- Client ID
- Client Secret
- Region
Click OK to apply changes and exit, or Cancel to exit without saving any changes.
Dell Tab
The Dell tab on a host’s Properties window displays the Dell Celerra/VNX, Dell Isilon/PowerScale, Dell PowerStore, or Dell Unity host to be monitored for activity and any host aliases. This tab is populated with the information entered when the Dell host is added to the monitored hosts table. If desired, specify a different device to be monitored for activity.
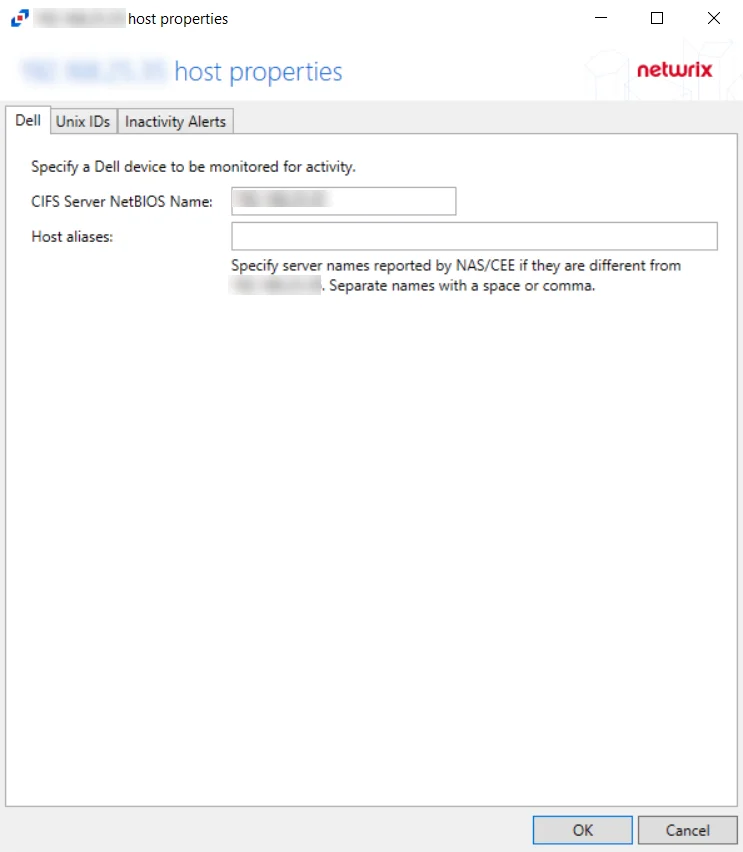
If changes are made to these configuration options, click OK to save the changes.
FPolicy Tab
The FPolicy tab allows users to modify FPolicy settings for NetApp devices, privileged access, and enabling/connecting to cluster nodes.
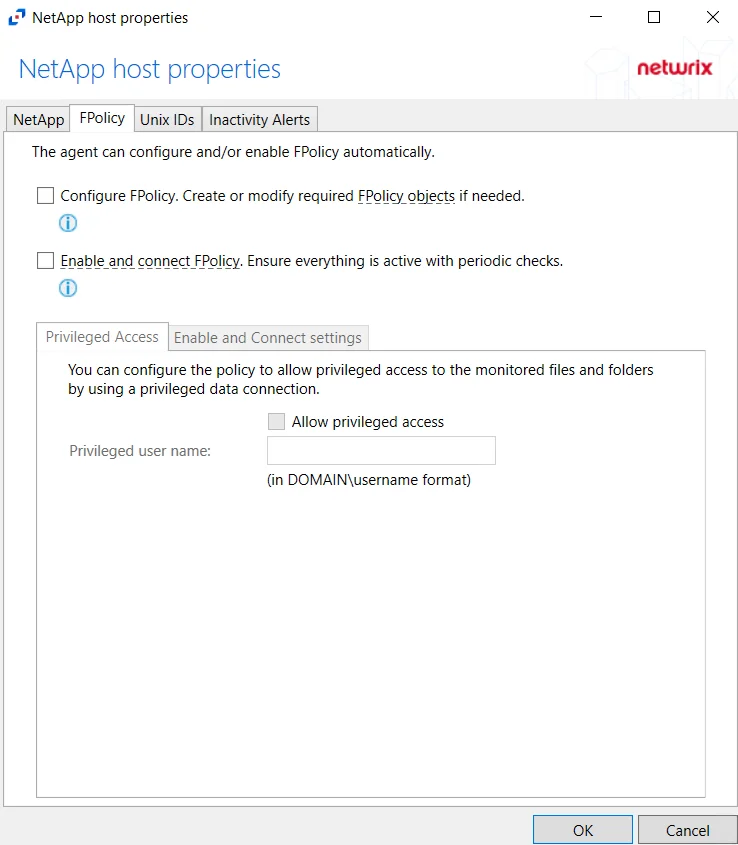
On the FPolicy tab, the agent can configure and/or enable FPolicy automatically. The recommended setting is dependent on the type of NetApp device being targeted. The permissions required for each option are listed. See the NetApp Data ONTAP 7-Mode Activity Auditing Configuration topic or the NetApp Data ONTAP Cluster-Mode Activity Auditing Configuration topic for additional information.
At the bottom are two additional tabs with setting options. On this tab, specify the protocols to monitor by selecting the radio buttons.
Privileged Access Tab
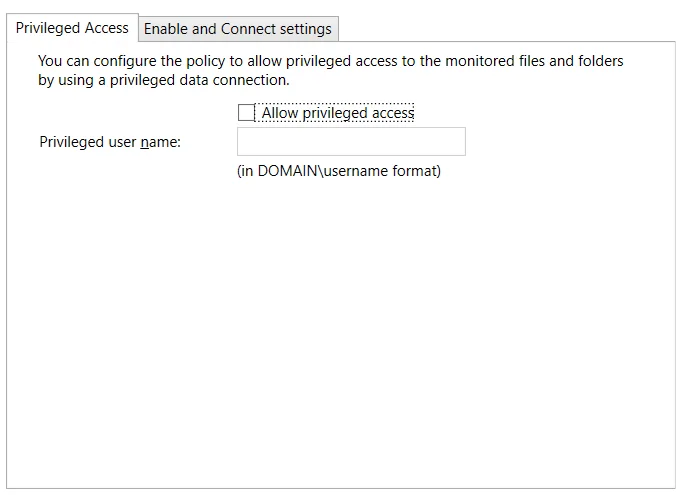
The Privileged Access tab is enabled when the Configure FPolicy checkbox is selected at the top. The Privileged Access tab must be configured if automatic configuration of the FPolicy for NetApp Data ONTAP Cluster-Mode devices is used. See the Configure Privileged Access topic for additional information.
Enable and Connect settings Tab
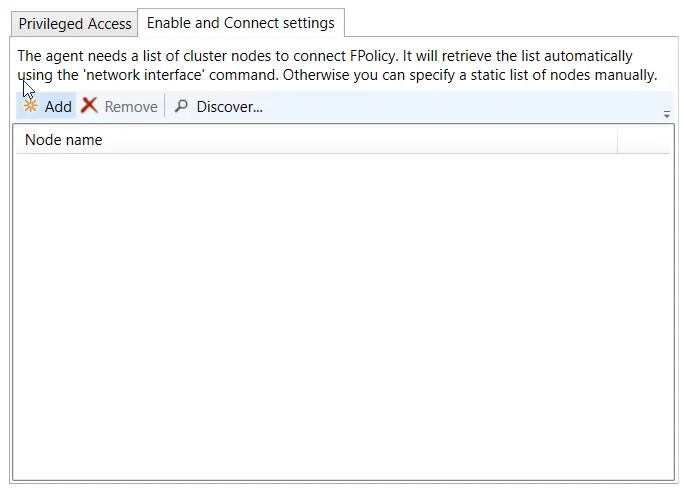
The Enable and Connect settings tab is enabled when the Enable and connect FPolicy checkbox is selected.
NOTE: Adding nodes are not needed if set user is using a role that has Network Interface permissions.

Add a list of cluster nodes to connect to FPolicy by clicking Add, which opens the Add or Edit Cluster Node window. Enter at least one cluster node in the textbox. Separate multiple nodes with either commas (,), semicolons (;), or spaces. Click OK and the node(s) is displayed in the Node name list.
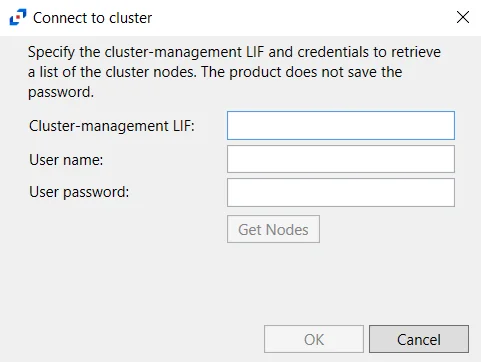
Click Discover to open the Connect to cluster window and retrieve nodes from the cluster.
Specify the Cluster-management LIF and then enter user credentials which will be used to retrieve a list of the cluster nodes. This credential must have at least read-only rights to run the system node show command on the cluster. Click Get Nodes. If a successful connection is not achieved, the message indicates the error. If a successful connection is achieved, the message indicates how many cluster nodes were discovered. Click OK and all discovered nodes are displayed in the Node name list.
Use the Remove button to remove the selected node from the list.
Changing the FPolicy Heartbeat Interval
The activity agent periodically checks for and re-enables any StealthAUDIT filter policies which had been disabled for any reason, i.e. a network outage. Follow the steps to change the frequency of checks.
Step 1 – Using Regedt32 navigate to:
HKEY_LOCAL_MACHINE\SYSTEM\CurrentCotrolSet\Services\FPolicyServerSvc\Parameters
Step 2 – Right-click on TimeInterval and select Modify.
Step 3 – Change “Base” to Decimal.
Step 4 – Set the “Value Data” to an integer value which represents how often, in minutes, the service should poll corresponding NetApp filers.
Step 5 – Restart both the Stealthbits NetApp File Activity Monitoring Service (FPolicyServerSvc) and the Stealthbits Logging Service for Network Appliances (FSACLogging) on the activity agent server.
The activity agent now checks for disabled filter policies according to the modified heartbeat interval.
Resources Required for NetApp Monitoring
Each individual NetApp filer being monitored impacts local system resources and requires disk space. These vary based on configuration settings chosen along with user activity. Average FPolicy and associated Logging service resource consumption may be around 2% CPU usage and 10 MB of RAM. Average disk space required per daily activity log file retained locally may be around 300 MB per filer.
Hitachi NAS Tab
Once a Hitachi host is added to the monitored hosts table, the configuration settings are edited through the tabs in the host’s Properties window. The Hitachi NAS tab on a host’s Properties window is specific to Hitachi hosts.
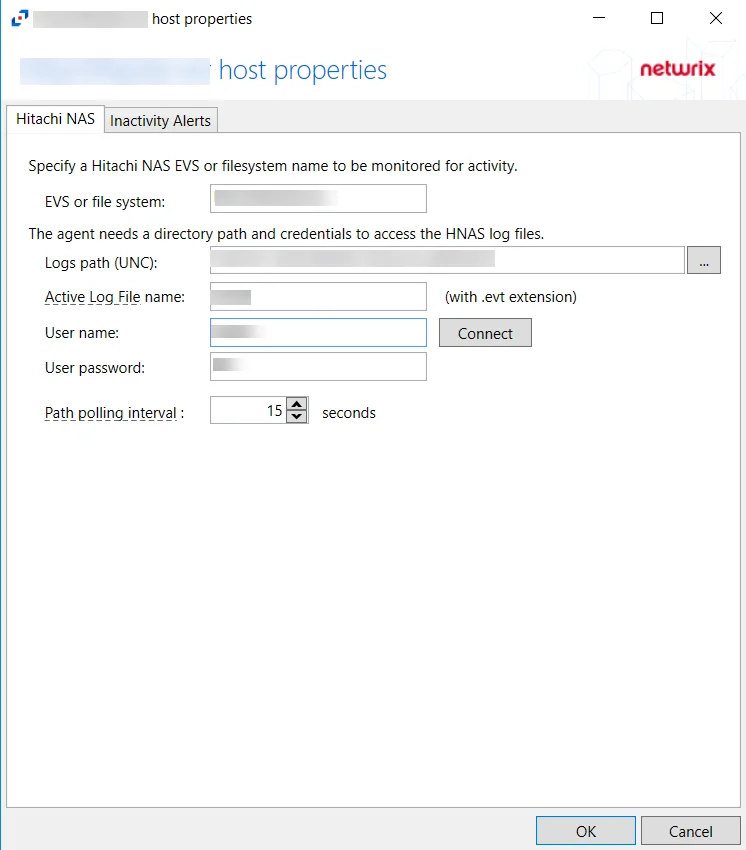
The Hitachi NAS tab allows users to modify settings that were populated with the information entered when the Hitachi host was added. Additionally, the Path pooling interval can be configured. The Path pooling interval is set to 15 seconds by default.
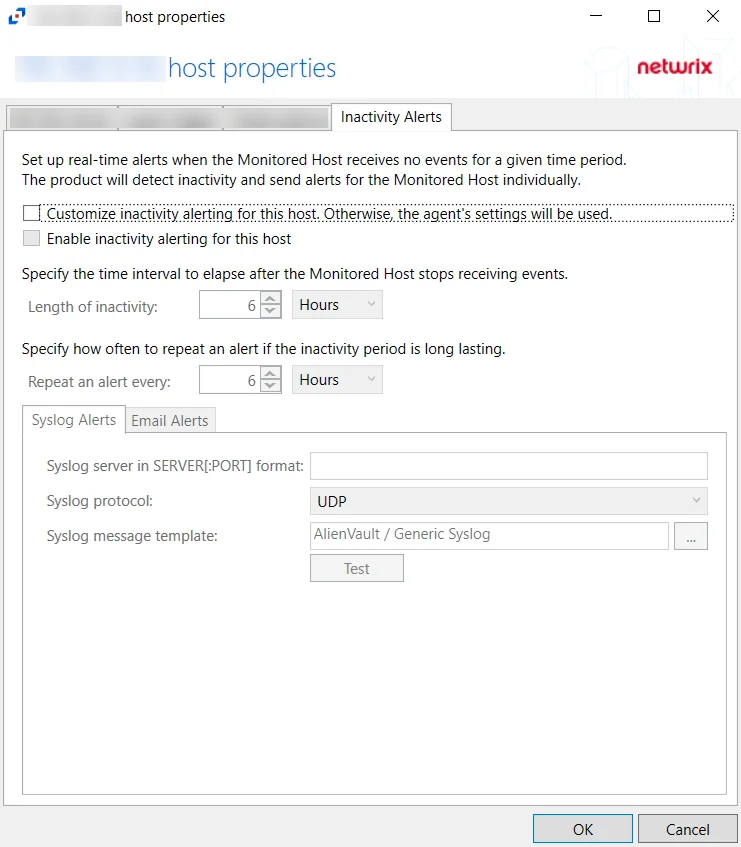
Inactivity Alerts Tab
The Inactivity Alerts tab on a host's Properties window is used to configure alerts that are sent when monitored hosts receive no events for a specified period of time.
The configurable options are:
- Customize inactivity alerting for this host. Otherwise, the agent's settings will be used – Check this box to enable customization of alert settings for Monitored Hosts
- Enable inactivity alerting for this host – Check this box to enable inactivity alerts for host.
- Length of inactivity – Specify how much time must pass before an inactivity alert is sent out. The default is 6 hours.
- Repeat an alert every – Specify how often an alert is sent out during periods of inactivity. The default is 6 hours.
Syslog Alerts Tab
Configure Syslog alerts using the Syslog Alerts Tab.

The configurable options are:
-
Syslog server in SERVER[:PORT] format – Type the Syslog server name with a SERVER:Port format in the textbox.
-
Syslog protocol – Identify the Syslog protocol to be used for the alerts
- UDP
- TCP
- TLS
-
Syslog message template – Click the ellipsis (…) to open the Syslog Message Template window. The following Syslog templates have been provided:
- AlienVault / Generic Syslog
- CEF – Incorporates the CEF message format
- HP Arcsight
- LEEF – Incorporates the LEEF message format
- LogRhythm
- McAfee
- QRadar – Use this template for IBM QRadar integration. See the Netwrix File Activity Monitor App for QRadar topic for additional information.
- Splunk – Use this template for Splunk integration. See the File Activity Monitor App for Splunk section for additional information.
- StealthDEFEND – Use this template for Netwrix Threat Manager integration. This is the only supported template for Threat Manager.
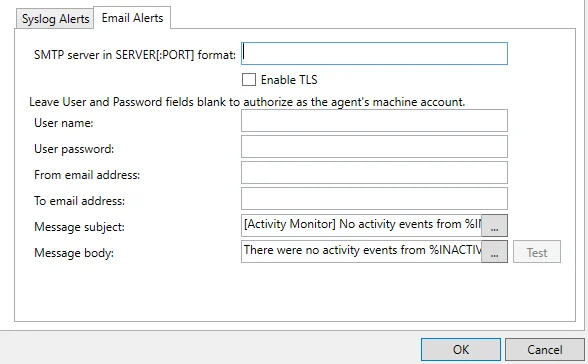
Email Alerts Tab
Configure Email alerts using the Email Alerts Tab.
The configurable options are:
-
SMTP server in SERVER[:PORT] format – Enter the SMTP server for the email alerts
- Enable TLS – Check the box to enable TLS encryption
-
User name – (Optional) User name for the email alert
-
User password – (Optional) Password for the username
-
From email address – Email address that the alert is sent from
-
To email address – Email address that the alert is sent to
-
Message subject – Subject line used for the email alert. Click the ellipses (...) to open the Message Template window.
-
Message body – Body of the message used for the email alert. Click the ellipses (...) to open the Message Template window.
Logon Trigger Tab
The Logon trigger tab on a SQL Server host's properties window is used to configure logon triggers for SQL activity monitoring.
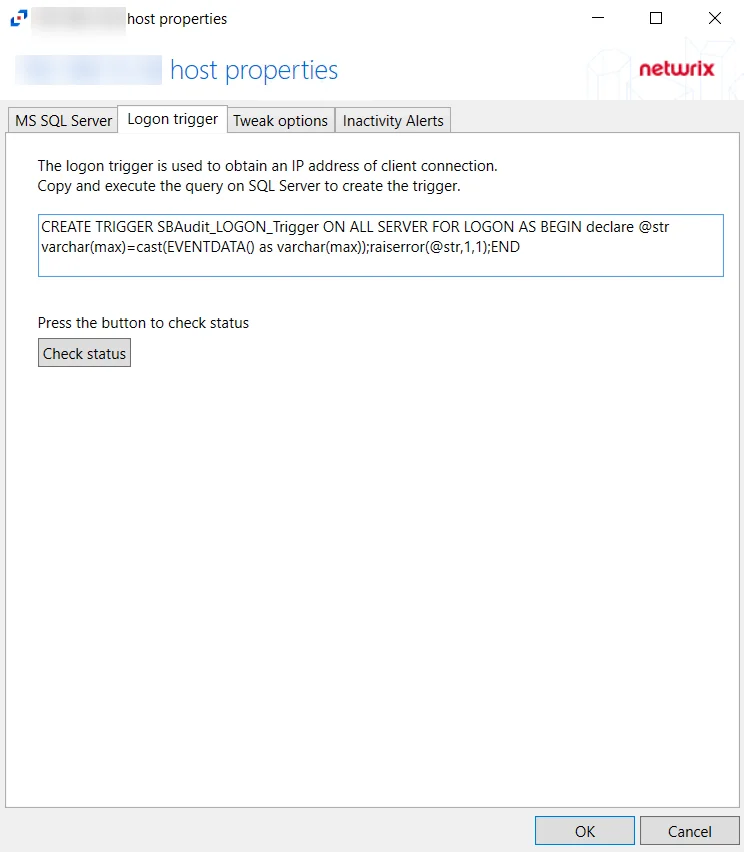
Copy and paste the SQL Script into a SQL query and execute to enable the Activity Monitor to obtain IP addresses of client connections. Click Check Status to check if the trigger is properly configured on the SQL server.
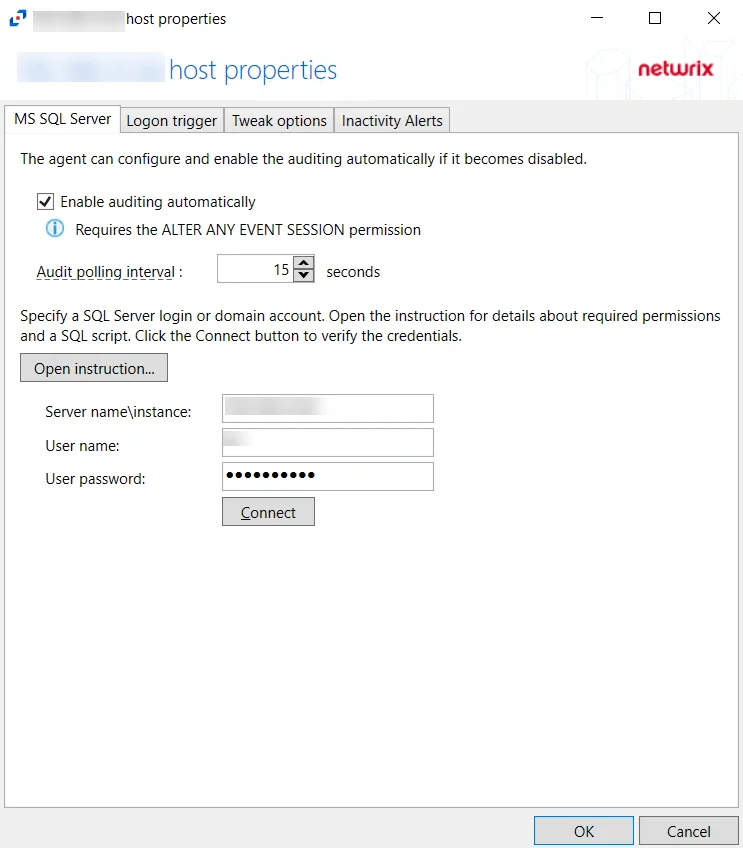
MS SQL Server Tab
The MS SQL Server tab on SQL Server host's properties window is used to configure properties for SQL activity monitoring on the host.
The configurable options are:
-
Enable Trace automatically — Check the box to enable the activity monitor to enable Trace automatically if it is disabled
-
Audit polling interval — Configure the interval between audits. The default is 15 seconds.
-
Open instruction... — Click Open Instruction... to view steps on how to create a login for SQL monitoring
- Certain permissions are required to create a login for SQL monitoring. See the
-
Server name\instance — Server name\instance of the SQL Server to be monitored
-
User name — User for the SQL Server
-
User password — Password for the SQL Server
-
Connect — Click Connect to test the settings
Nasuni Tab
After a Nasuni host is added to the monitored hosts table, the configuration settings are edited using the tabs in the Properties window of the host.
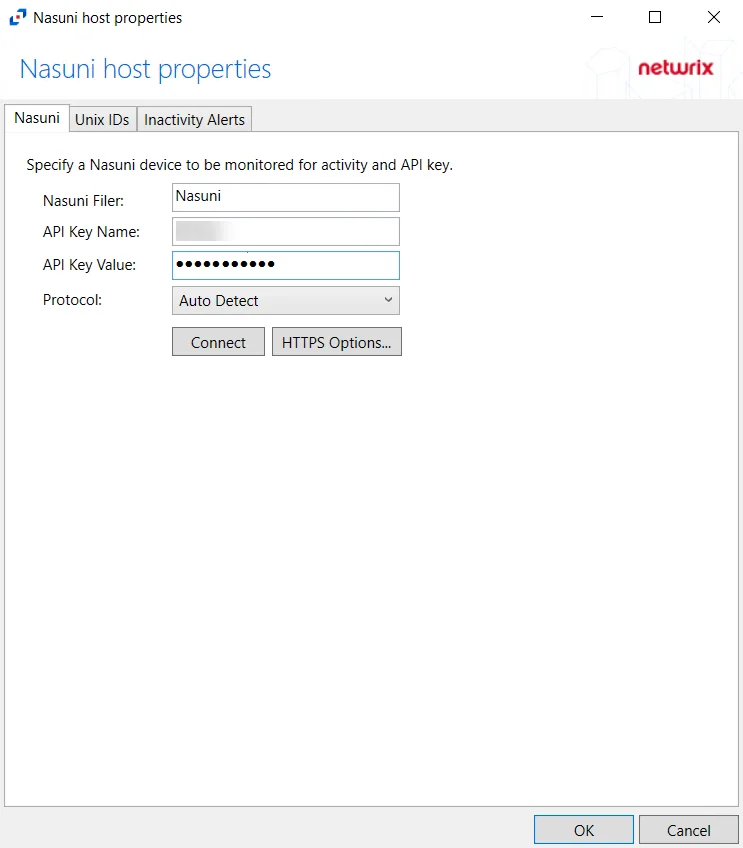
The Nasuni tab allows users to modify settings which were populated with the information entered when the Nasuni host was added.
The configurable options are:
-
Nasuni Filer – Enter the name of the filer
-
Username – Enter the user name for the Nasuni account
-
Password – Enter the password for the user name
-
Protocol – Select from the following options in the drop-down list:
- Auto Detect
- HTTPS
- HTTPS, ignore certificate errors
-
Connect – Click to connect using the selected protocol and validate the connection with Nasuni
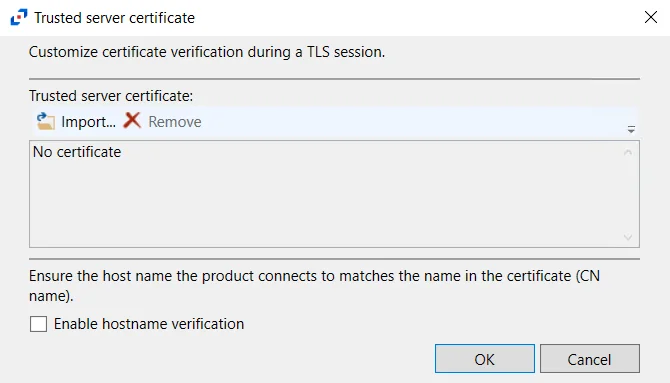 -
HTTPS Options – Opens the Trusted server certificate window to customize the certificate
verification during a TLS session
-
HTTPS Options – Opens the Trusted server certificate window to customize the certificate
verification during a TLS session
- Import – Click to browse for a trusted server certificate
- Remove – Click to remove the selected trusted server certificate
- Enable hostname verification – Select this checkbox to ensure that the host name the product connects and matches the name in the certificate (CN name)
- Click OK to close the window and save the modifications.
NetApp Tab
The NetApp tab on a host’s Properties window allows users to modify settings, which are populated with the information entered when the NetApp host is added to the monitored hosts table.
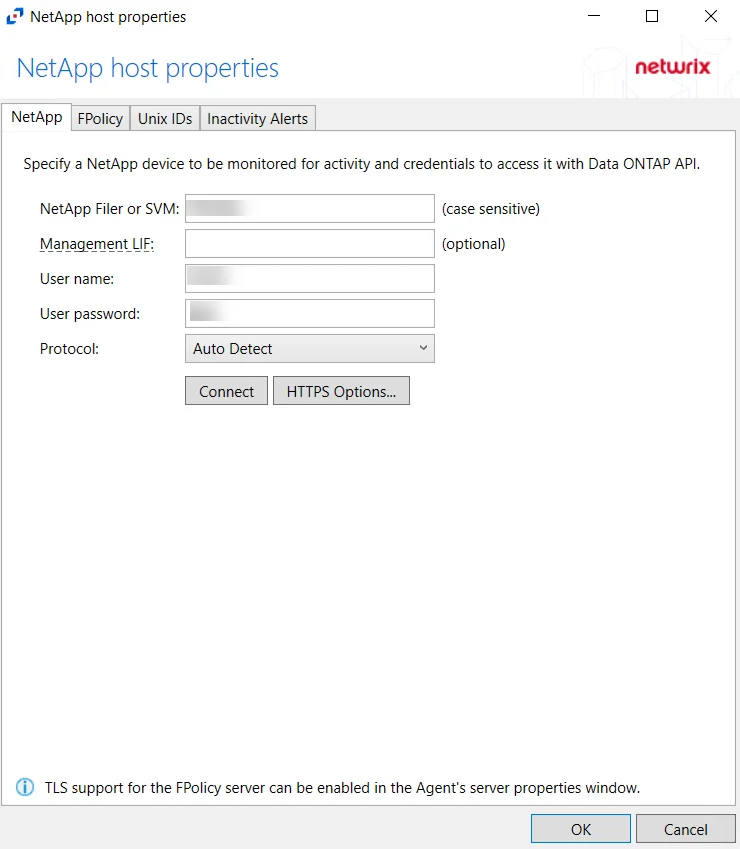
Modify the targeted NetApp device by specifying a NetApp device to be monitored for activity and credentials to access it with the Data ONTAP API.
- Protocol – Select from the following options in the drop-down list:
- Auto Detect
- HTTPS
- HTTPS, ignore certificate errors
- HTTP
- Connect – Click to connect using the selected protocol and validate the connection with NetApp
-
HTTPS Options – Opens the Trusted server certificate window to customize the certificate
verification during a TLS session
- Import – Click to browse for a trusted server certificate
- Remove – Click to remove the selected trusted server certificate
- Enable hostname verification – Select this checkbox to ensure that the host name the product connects and matches the name in the certificate (CN name)
- Click OK to close the window and save the modifications.
Nutanix Tab
The Nutanix tab allows users to modify settings after a Nutanix host has been configured. Once a Nutanix host is added to the monitored hosts table, the configuration can be edited in the host Properties.
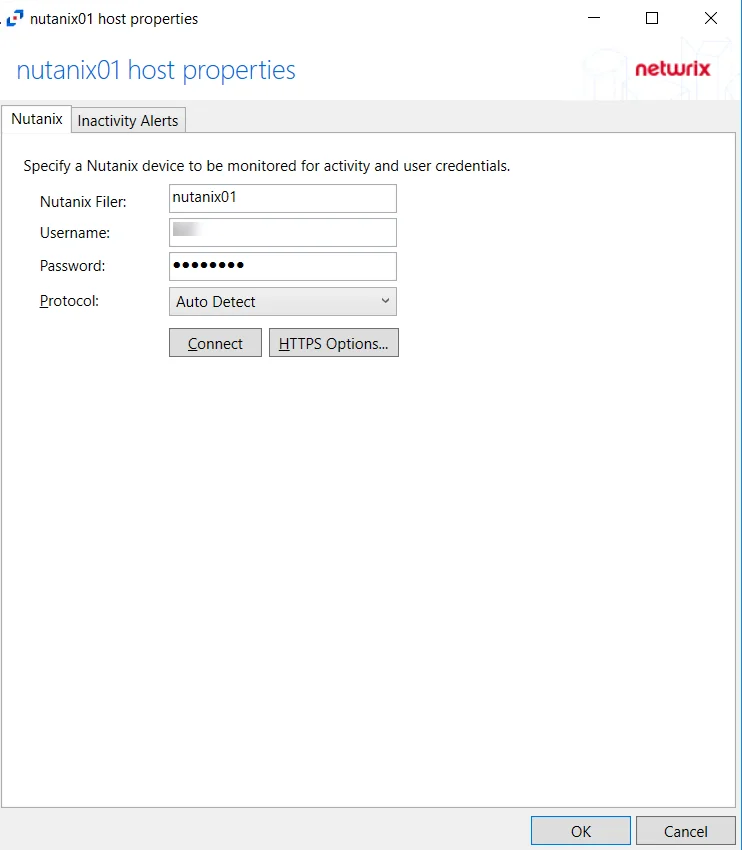
The configurable options are:
-
Nutanix Filer – Enter the name of the filer
-
Username – Enter the user name for the Nutanix account with REST API access
-
Password – Enter the password for the user name
-
Protocol – Select a protocol for the REST API access from the drop-down menu:
- Auto Detect
- HTTPS
- HTTPS, ignore certificate errors
-
Connect – Click to connect using the selected protocol and validate the connection with Nutanix
-
HTTPS Options – Opens the Trusted server certificate window to customize the certificate
verification during a TLS session
- Import – Click to browse for a trusted server certificate
- Remove – Click to remove the selected trusted server certificate
- Enable hostname verification – Select this checkbox to ensure that the host name the product connects and matches the name in the certificate (CN name)
- Click OK to close the window and save the modifications.
NOTE: Nutanix Files does not report events for activity originating from a server where the Activity Monitor Agent is installed.
Panzura Tab
After a Panzura host is added to the monitored hosts table, the configuration settings are edited using the tabs in the Properties window of the host.
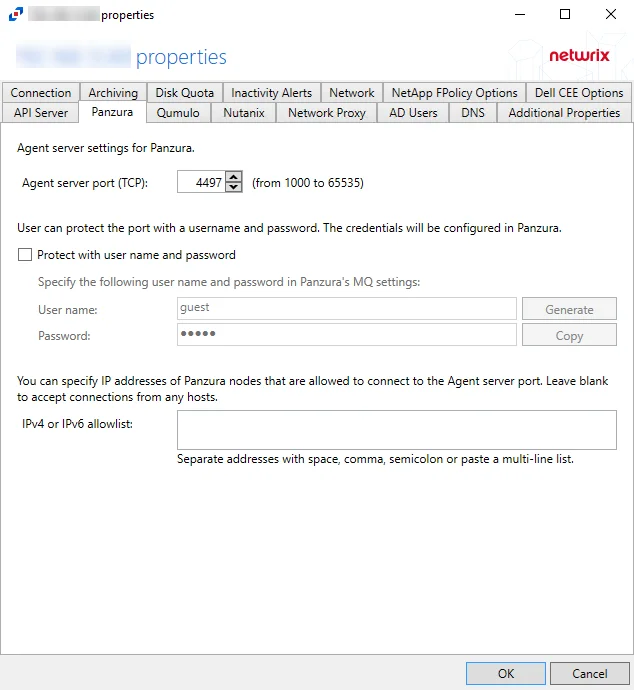
The Panzura tab allows users to modify settings which were populated with the information entered when the Panzura host was added.
The configurable options are:
-
Panzura Filer – Enter the name of the filer
-
Username – Enter the user name for the Panzura account
-
Password – Enter the password for the user name
-
Protocol – Select from the following options in the drop-down list:
- Auto Detect
- HTTPS
- HTTPS, ignore certificate errors
-
Connect – Click to connect using the selected protocol and validate the connection with Panzura
-
HTTPS Options – Opens the Trusted server certificate window to customize the certificate
verification during a TLS session
- Import – Click to browse for a trusted server certificate
- Remove – Click to remove the selected trusted server certificate
- Enable hostname verification – Select this checkbox to ensure that the host name the product connects and matches the name in the certificate (CN name)
- Click OK to close the window and save the modifications.
Qumulo Tab
The Qumulo tab allows users to modify settings after a Qumulo host has been configured. Once a Qumulo host is added to the monitored hosts table, the configuration can be edited in the host Properties.
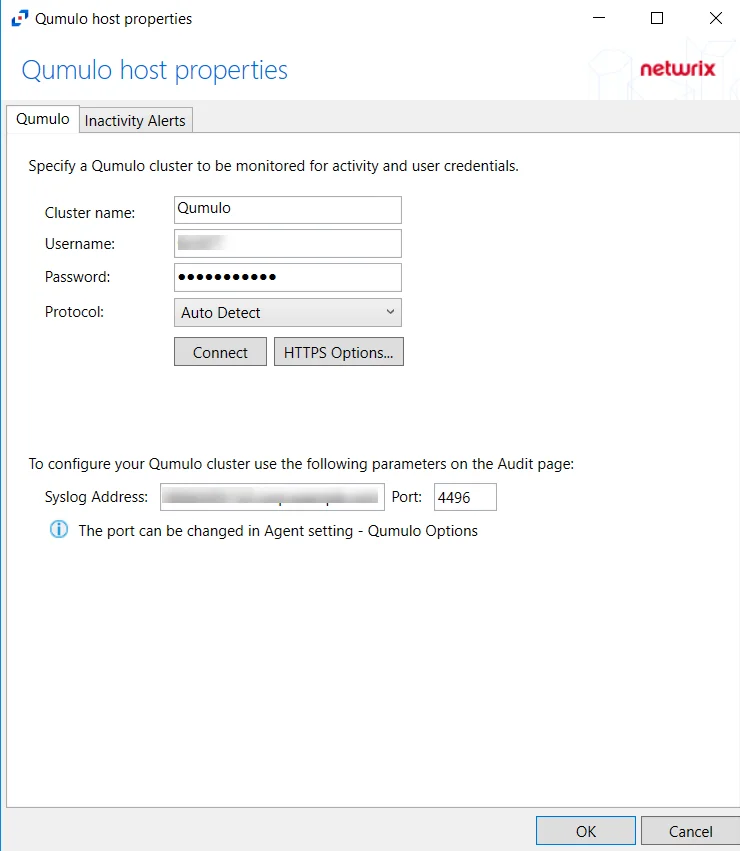
The configurable options are:
-
Cluster name – Enter the name of the filer
-
Username – Enter the user name for the Qumulo user
-
Password – Enter the password for the user name
-
Protocol – Select one of the following protocols from the drop-down menu:
- Auto Detect
- HTTPS
- HTTPS, ignore certificate errors
-
Connect – Click to connect using the selected protocol and validate the connection with Qumulo
-
HTTPS Options – Opens the Trusted server certificate window to customize the certificate
verification during a TLS session
- Import – Click to browse for a trusted server certificate
- Remove – Click to remove the selected trusted server certificate
- Enable hostname verification – Select this checkbox to ensure that the host name the product connects and matches the name in the certificate (CN name)
- Click OK to close the window and save the modifications.
SharePoint Tab
The SharePoint tab on a host’s Properties window allows users to modify settings that are populated with the information entered when the SharePoint host is added.
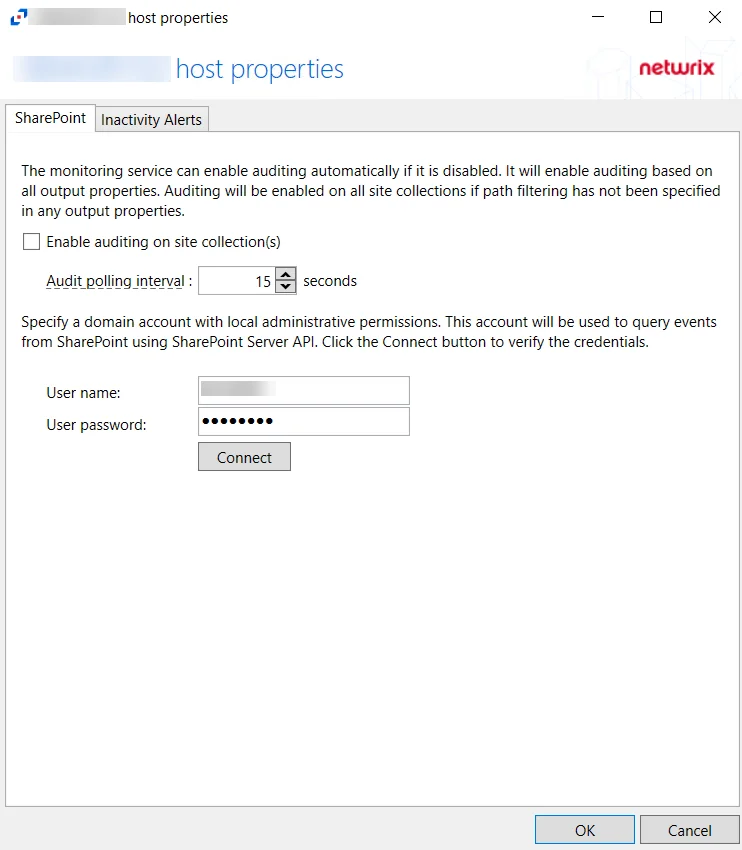
The configurable options are:
-
Enable auditing on selected site collections - Check the box to enable auditing on selected site collections. Enabling this option will ensure that auditing is enabled for all monitored site collections with periodic checks.
-
Choose to audit all sites or scope the monitoring to specific site(s):
-
Audit all sites – Leave textbox for URLs blank
-
Scope to specific sites – List URLs for sites to be monitored in the textbox. List should be semicolon separated. For example:
http://sharpoint.local/sites/marketing; http://sharepoint.local/sites/personal/user1
-
-
Audit polling interval – Select the interval for how often the activity agent will request new events from SharePoint. Number of seconds between polling request, set to 15 seconds by default
-
User name - Enter the user name for the domain account with local admin permissions
-
User password - Enter the password for the user name
-
Connect – Click Connect to validate the connection with SharePoint
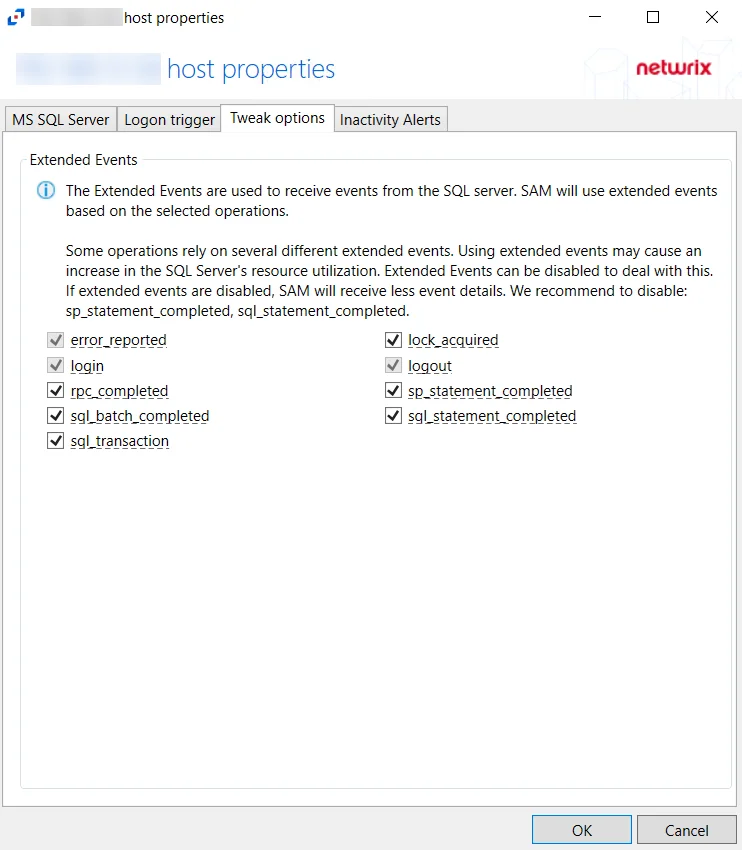
Tweak Options Tab
The Tweak Options tab on a SQL Server host's properties window is used to configure extended events operations for SQL activity monitoring.
Unix IDs Tab
The Unix IDs tab provides configuration options to translate Unix IDs (UID) to SIDs. This tab applies to NetApp devices, Dell devices, and Nasuni Edge Appliances.
When activity is performed on an NFS resource, UIDs are returned for that activity event. Depending on the operating system, the UID can be mapped to Active Directory accounts using the uidNumber attribute in Active Directory. The activity agent resolves the Active Directory SID based on the UID from the activity event.
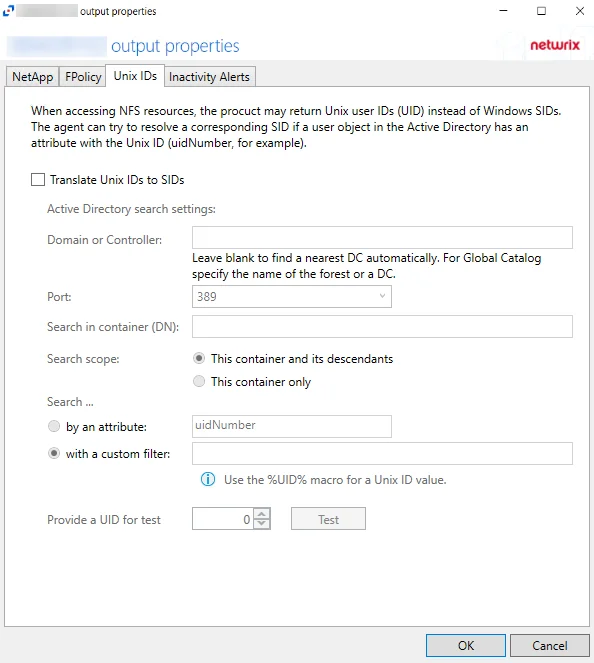
The options are:
- Translate Unix IDs to SIDs – Enables all controls on the page
- Search in container (DN) – Default naming context of the agent's domain
- Search scope – Select from the following radio buttons:
- This container and its descendants
- This container only
- Search - Search using the following specifications:
- by an attribute – Specify an LDAP filter. This attribute cannot be empty.
- with a custom filter – Use the %UID% macro for a Unix ID value
- Provide UID for test/Test – Test button performs a search in the specified container with the scope and the filter, replacing %UID% with 0 for the test
Windows Tab
The Windows tab on a host's Properties window is specific to Windows hosts.
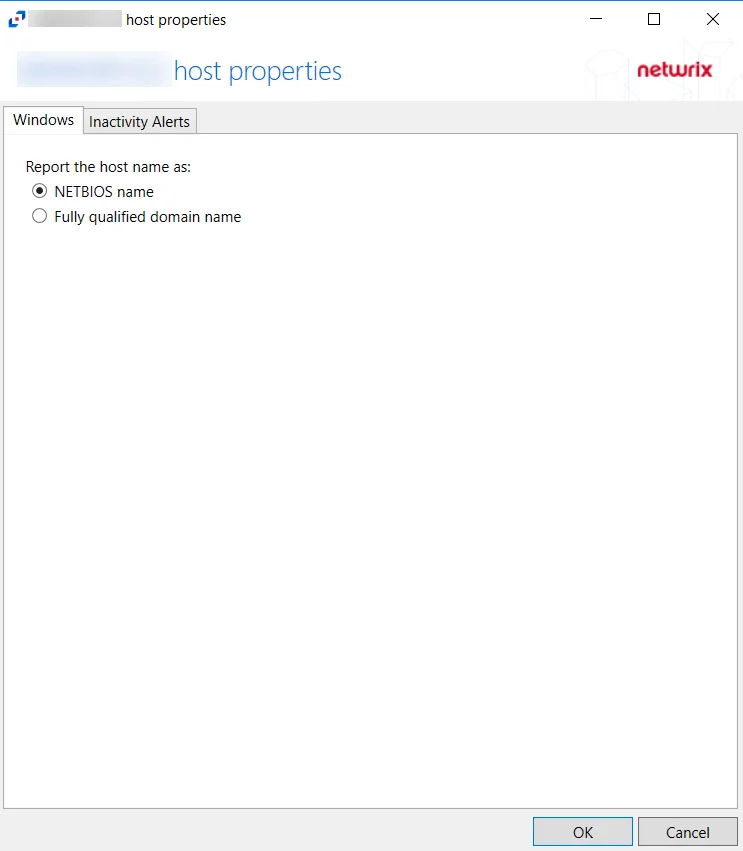
Select whether to report the host name as either a NETBIOS name or a Fully qualified domain name. The Host Name can be previewed to see how it appears depending on the option selected.