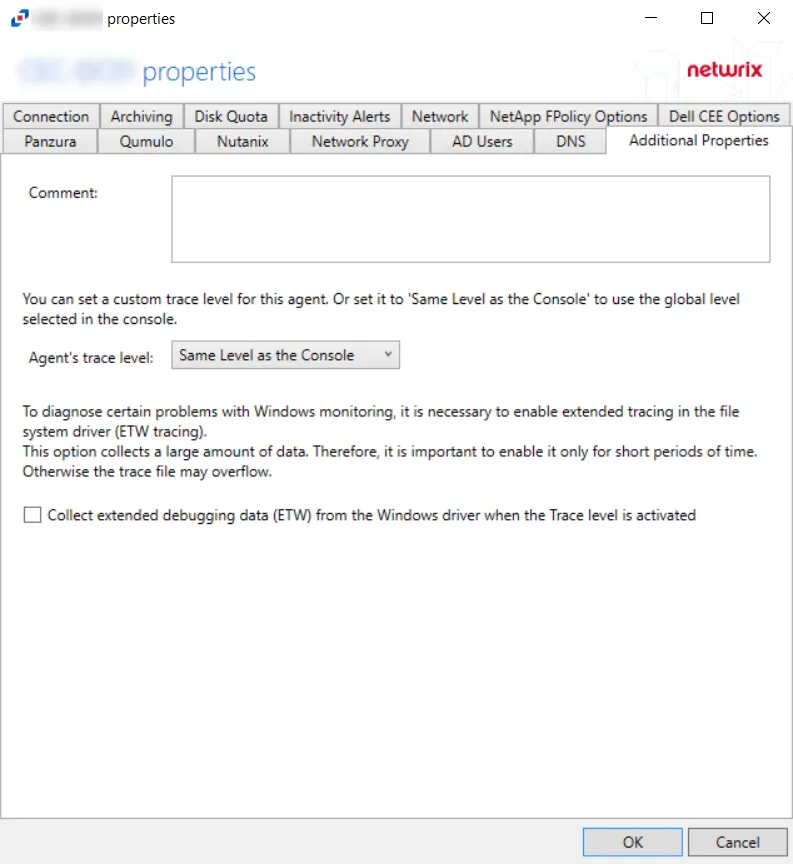
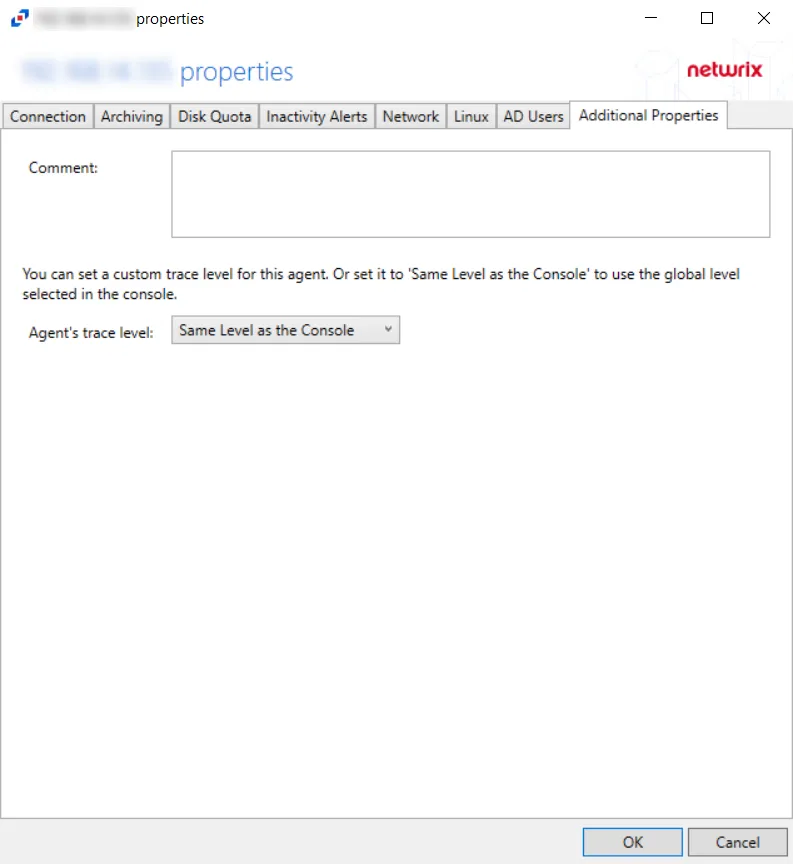
Additional Properties Tab
The Additional Properties Tab provides additional configuration options for the agent. The tab varies based on the type of agent selected.
For Activity Agent
The Additional Properties tab for the Activity Agent has the following configuration options:
-
Comment – Create an annotation for the agent in the Comment text box. Annotations entered here will appear in the Comment column in the table on the Agents tab.
-
Agent's Trace Level – Select a trace level for the agent log from the drop-down list:
-
Same Level as the Console (uses the global level selected in the console)
-
Trace (the most verbose) many collection points and can slow down
CAUTION: Selecting the Trace option can slow down collection due to the large amount of data points
-
Debug
-
Info (recommended)
-
Warning
-
Error
-
Fatal
-
In certain situations, the trace logs are not enough to identify issues. Collect extended debugging data (ETW) can be useful for problems related to the following:
- Not getting events
- Missing event attributes
- Getting unexpected events
- High RAM/CPU caused by SBTService
- Issues caused by Antivirus or Backup software
When this is needed, enable the Collect extended debugging data (ETW) from the Windows driver when the Trace level is activated option to diagnose these problems.
CAUTION: Selecting this option collects a large amount of data. Therefore, it is important to enable it only for short periods of time. Otherwise, the trace file may overflow with data.
In general for troubleshooting, start with trace logs. If the root cause of the problem might be a low-level functionality the driver, then the ETW logs must be enabled.
Click OK to commit the modifications. Click Cancel to discard the modifications. The Agent Properties window closes.
For Linux Agent
The Additional Properties tab for the Linux Agent has the following configuration options:
-
Comment – Create an annotation for the agent in the Comment text box. Annotations entered here will appear in the Comment column in the table on the Agents tab.
-
Agent's Trace Level – Select a trace level for the agent log from the drop-down list:
-
Same Level as the Console (uses the global level selected in the console)
-
Trace (the most verbose) many collection points and can slow down
CAUTION: Selecting the Trace option can slow down collection due to the large amount of data points
-
Debug
-
Info (recommended)
-
Warning
-
Error
-
Fatal
-
Click OK to commit the modifications. Click Cancel to discard the modifications. The Agent Properties window closes.
API Server Tab
The API Server Tab provides options to configure API server settings to send information about agents, agent configuration, and agent data to applications remotely. If an application wants to read the activity data using the API, the API Server must be enabled on each agent collecting activity.
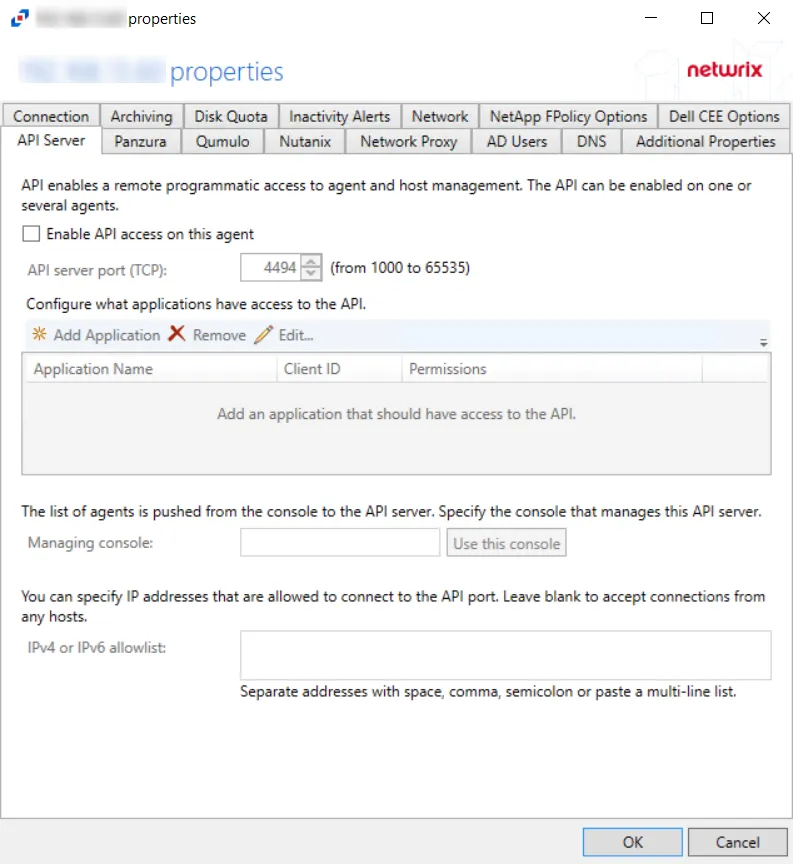
Check the Enable API access on this agent box to utilize the options on this tab:
- API server port (TCP): [number] (from 1000 to 65535) – Enter the API server port. The default is 4494.
- Configure what applications have access to the API – Specifies which API servers can be included
or excluded from receiving event data.
- Add Application – Click Add Application to open the Add or edit API client window to add an Application name to the list
- Remove – Select an Application Name and click Remove to remove an Application name from the list
- Edit – Select an Application Name and click Edit... to open the Add or edit API client window for that Application Name
Grant or revoke access to the API Server by registering applications.
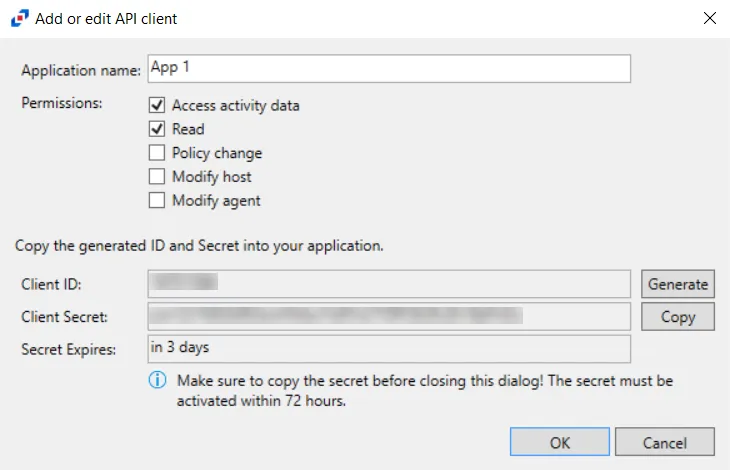
Click Add Application to open the Add or edit API client window.
- Application name – Name of application to provide read-only access to
- Permissions – list of permissions for Activity Monitor through API Server
- Access activity data – Provides a read-only access to the activity log files of the agent hosting the API Server. The access is provided to the files stored on the agent's server or on the archival network share. The permission also provides minimal and read-only access to configuration of monitored hosts/domain, enough to match the monitored hosts to their log files.
- Read – Provides a read-only access to the list of the agents and their configuration settings; configuration of monitored domains; configuration of monitored hosts. The permission does not provide access to the saved passwords or other secrets.
- Policy change - Provides permissions required to update the AD Monitoring domain configuration settings
- Modify host - Provides permissions required to update the monitored hosts settings
- Modify agent - Provides permissions required to update the agent hosts settings
- Client ID/Generate – Generate button creates a new Client ID and Client Secret (password) credentials for applications to access API server
- Client Secret/Copy – Copy button copies the Client ID and Client Secret (password) into its respective textbox after the application is added or the Generate button is pressed
- Secret Expires – Displays the number of days until the Client Secret expires before activated. The default is 3 days.
The options below the API Application Access window are:
- Managing console/Use this console – Use this console button enters the host name of the Activity Monitor Console within the textbox
- IPv4 or IPv6 whitelist – IP Addresses of the remote hosts, which are allowed to connect to the API port, can be whitelisted by entering them in the box. IP Addresses should be entered as separate addresses with space, comma (,), semicolon (;), or a multi-line list. Leave the box blank to accept connections from any hosts.
Click OK to commit the modifications. Click Cancel to discard the modifications. The Agent Properties window closes.
Connection Tab
The Connection tab allows users to modify the agent host server name and the credentials used for installation and communication. The tab varies based on the type of agent selected.
For Activity Agent
The server name can be modified in the text box. Modifying the name value does not move the activity agent to a new server. The credentials can be updated or modified as well.
Remember, Test the credentials before clicking OK to ensure a successful connection.
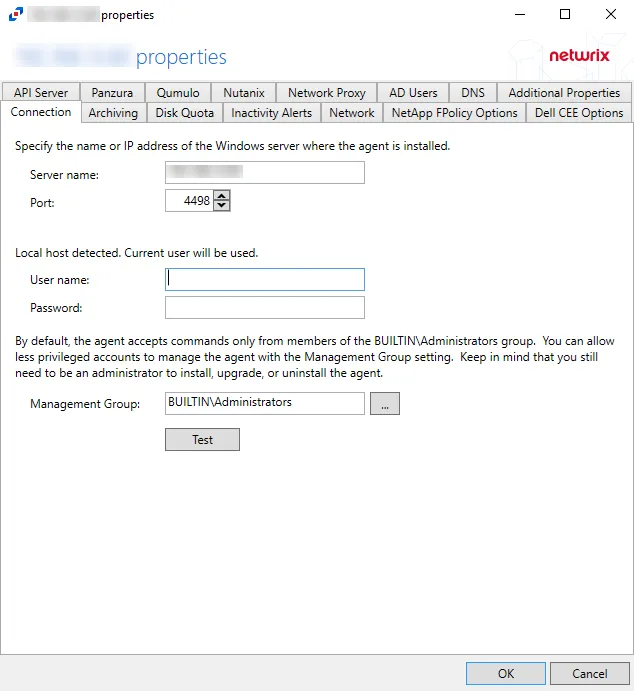
Agent server fields:
- Server name – Name or IP address of the server where the agent is deploy
- Port – Port the agent uses for communication with the application
Credential fields:
- User name – Account provisioned for use by the agent
- Password – Password for the supplied User name
Permissions
This account must be:
- Membership in the local Administrators group
If the user name is not specified, the currently logged in user's account will be used.
Less Privileged Permissions Option
By default, the agent accepts commands only from members of the local Administrators group. You can allow less privileged accounts to manage the agent with the Management Group option. Keep in mind that you still need to be an administrator to install, upgrade, or uninstall the agent. The Management Group applies to the users of the console and API servers. The Management Group does not restrict access to the agents, but grants access to its members in addition to existing members of the local Administrators group.
The Specify account or group window is opened from a field where a Windows account is needed.
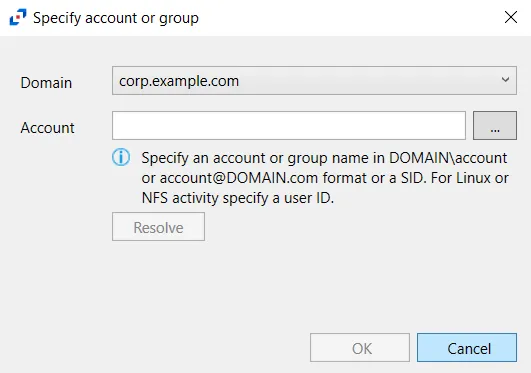
Follow the steps to use this window.
Step 1 – Select the Domain from the drop-down menu.
Step 2 – Enter the Account in the textbox.
- Accounts can be entered in NTAccount format, UPN format, or SID format.
- Use the ellipsis (…) button to open the Select Users, Computers, Service Accounts, or Groups window to browse for an account.
Step 3 – Then click Resolve. A message displays indicating whether or not the account could be resolved.
Step 4 – If successful, click OK.
The Specify account or group window closes, and the account is added to the field where the window was opened.
Click OK to commit the modifications. Click Cancel to discard the modifications. The Agent Properties window closes.
For Linux Agent
The server name can be modified in the text box. Modifying the name value does not move the Linux agent to a new server. The credentials can be updated or modified as well.
Remember, Test the credentials before clicking OK to ensure a successful connection.
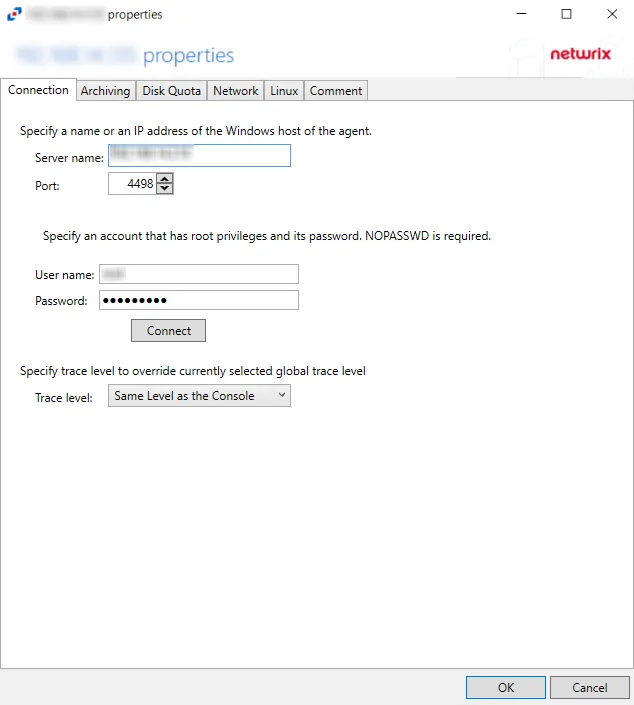
Agent server fields:
- Server name – Name or IP address of the server where the agent is deploy
- Port – Port the agent uses for communication with the application
Credential fields:
- User name – Account provisioned for use by the agent
- Password – Password for the supplied User name
Permissions
This account must be:
- Root privileges with password (or SSH private key)
The Trace level option configures the level for the agent log it includes the following levels:
-
Same Level as the Console (uses the global level selected in the console)
-
Trace (the most verbose) many collection points and can slow down
CAUTION: Selecting the Trace option can slow down collection due to the large amount of data points
-
Debug
-
Info (recommended)
-
Warning
-
Error
-
Fatal
Inactivity Alerts Tab
The Inactivity Alerts tab, once enabled and configured, sends real-time alerts when the agent stops receiving events for a specific time frame. The tab varies based on the type of agent selected.
Check the Enable Inactivity alerting for this agent box to enable the options on this tab.
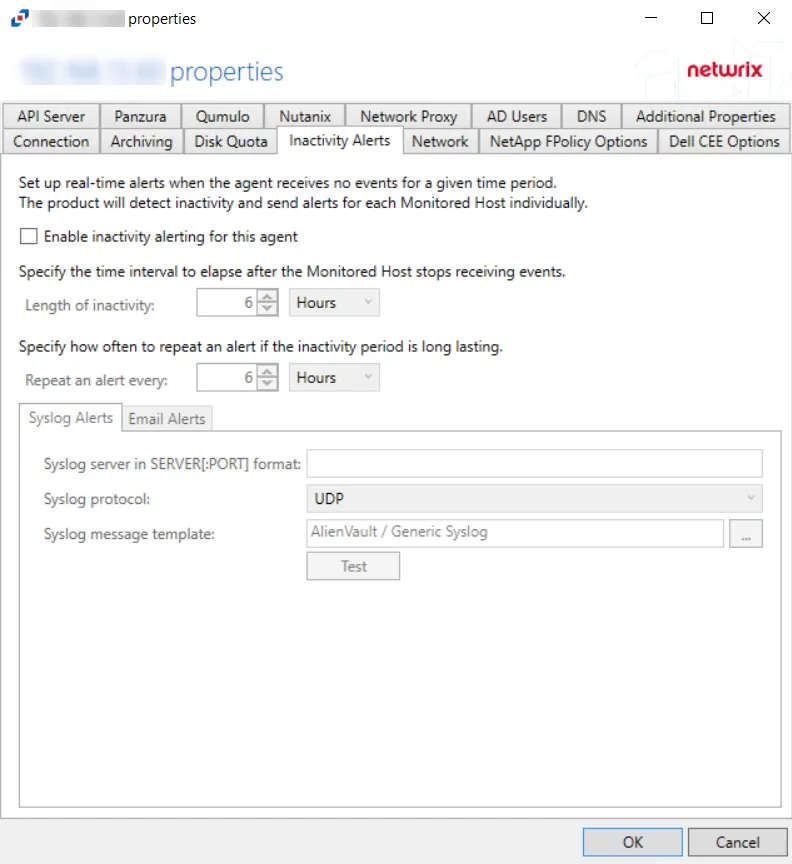
Once enabled, set the alerting parameters:
- Length of inactivity – Enter the number of Minutes, Hours, or Days for inactivity before an alert is triggered. The default is 6 Hours.
- Repeat an alert every – Enter the number of Minutes, Hours, or Days for an alert to be repeated if inactivity continues. The default is 6 Hours.
The two tabs at the bottom are for configuring the method used to send the alert:
- Syslog Alerts – Configure the application to send alerts to a SIEM platform
- Email Alerts – Configure the application to send alerts through an SMTP server
Click OK to commit the modifications. Click Cancel to discard the modifications. The Agent Properties window closes.
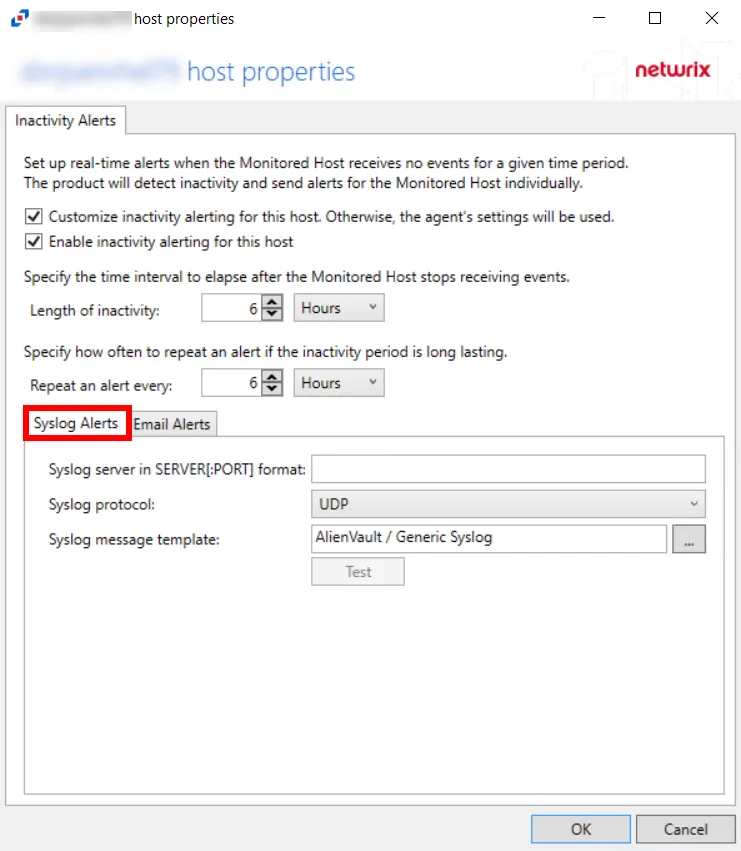
Syslog Alerts Tab
The Syslog alert sends a notification that the activity agent has not received event data for the configured interval. The alert is sent to the Syslog configured on the Syslog Alerts tab.
-
Syslog server in SERVER[:PORT] format – Type the Syslog server name with a SERVER:PORT format in the text box. The server name can be short name, fully qualified name (FQDN), or IP Address, as long as the organization’s environment can resolve the name format used.
-
Syslog protocol – Identify the Syslog protocol to be used for the alert. The drop-down menu includes:
-
UDP
-
TCP
-
TLS
NOTE: The TCP and TLS protocols add the Message framing drop-down menu. Message framing options include:
- LS (ASCII 10) delimiter
- CR (ASCII 13) delimiter
- CRLF (ASCII 13, 10) delimiter
- NUL (ASCII 0) delimiter
- Octet Count (RFC 5425)
-
-
Test Button – The Test button sends a test message to the Syslog server to check the connection. A connection status message displays with either a green check mark or a red X identifying the success of the sent test message. Messages vary by Syslog protocol:
- UDP – Sends a test message and does not verify connection
- TCP/TLS – Sends test message and verifies connection
- TLS – Shows error if TLS handshake fails
-
Syslog Message Template – Select the Syslog message template to be used. Click the ellipsis (…) to open the Syslog Message Template window. The Syslog template provided is AlienVault / Generic Syslog.
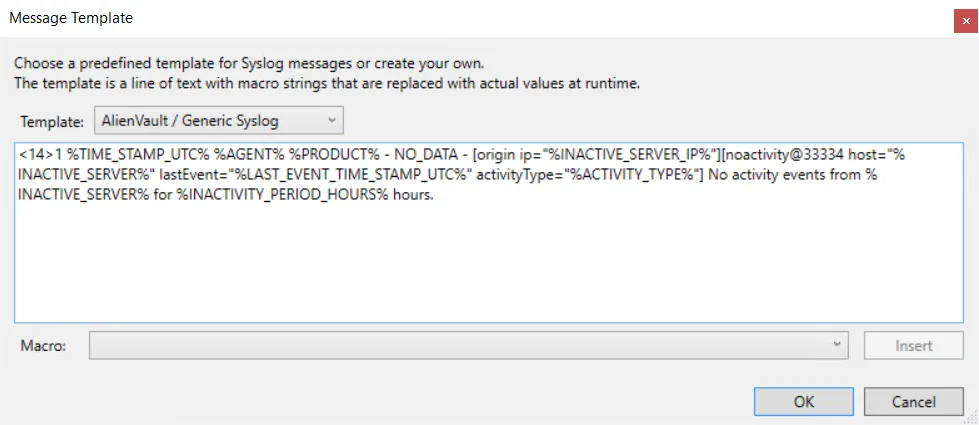
Custom templates can be created. Select the desired template or create a new template by modifying an existing template within the Syslog Message Template window. The new message template is named Custom.
Click OK to apply changes and exit, or Cancel to exit without saving any changes.
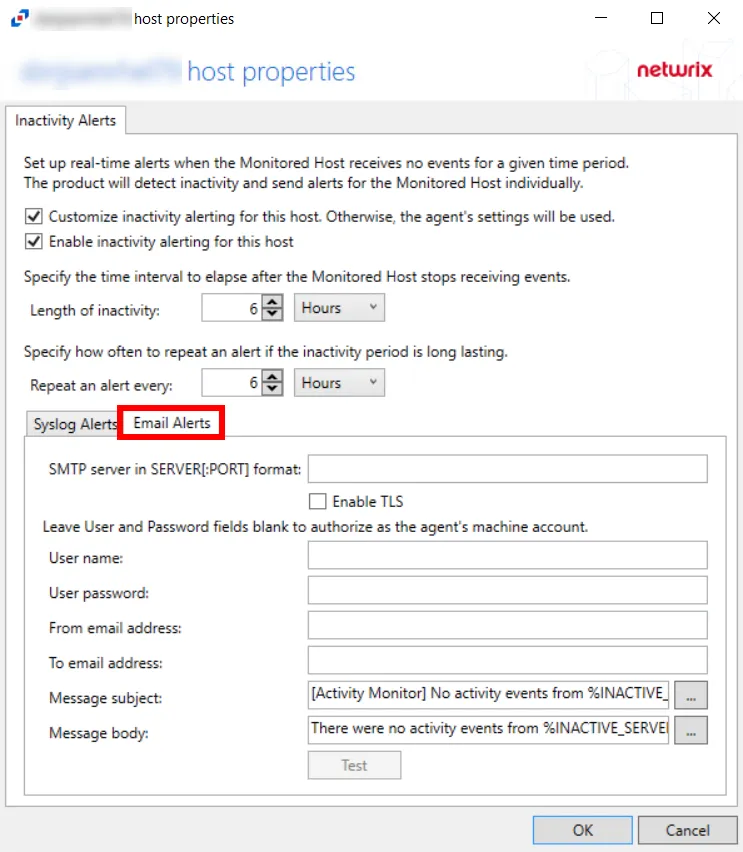
Email Alerts Tab
The email alert sends a notification that the activity agent has not received event data for the configured interval. The alert is sent to the configured recipients on the Email Alerts tab.
-
Syslog server in SERVER[:PORT] format – Type the SMTP server name with a SERVER:PORT format in the text box. The server name can be short name, fully qualified name (FQDN), or IP Address, as long as the organization’s environment can resolve the name format used.
- Check the Enable TLS box if an SMTP server requires TLS protocol.
-
User Name/Password – Specify credentials to send email alert. If using the current agent’s machine account, leave these fields blank.
-
From email address – Enter the Sender’s email address
-
To email address – Enter the Recipient’s email address. Multiple addresses are comma separated.
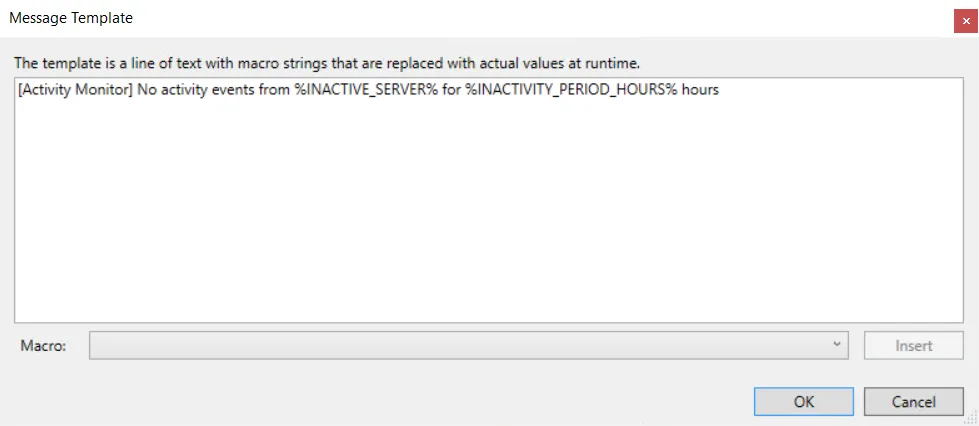
- Message subject – Click the ellipsis (…) to open the Message Template window to customize the subject. Macros can be used to insert
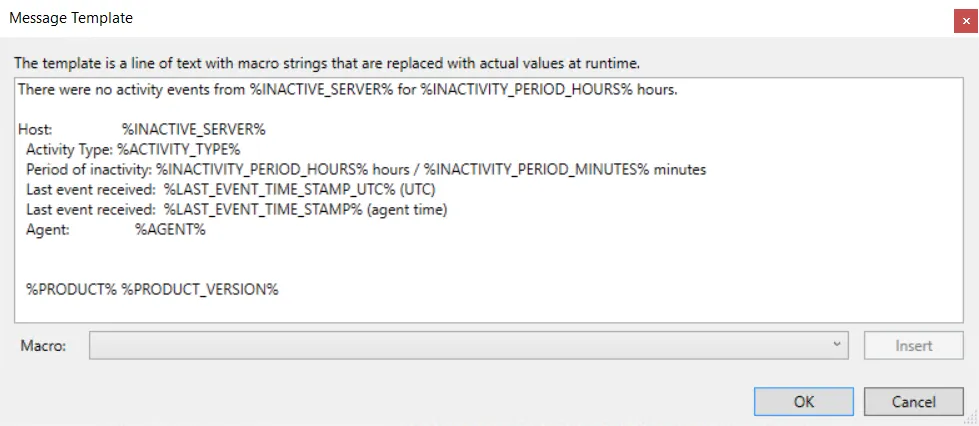
- Message body – Click the ellipsis (…) to open the Message Template window to customize the body
- Test – The Test button sends a test message to the receiver’s email address to check the connection. A connection status message displays with either a green check mark or a red X identifying the success of the sent test message.
Click OK to apply changes and exit, or Cancel to exit without saving any changes.
Macro Variables for Agents
Macros are text strings that are replaced with actual values at run time. The following Macro variables are available to customize the Syslog and Email message template:
| Macro | Definition |
|---|---|
| %SYSLOG_DATE% | Date/Time of the alert (local time, Syslog format) |
| %TIME_STAMP% | Date/Time of the alert (local time) |
| %TIME_STAMP_UTC% | Date/Time of the alert (UTC) |
| %AGENT% | Agent host name |
| %PRODUCT% | Product name |
| %PRODUCT_VERSION% | Product Version |
| %INACTIVE_SERVER% | Host name of the monitored host which stopped sending events |
| %INACTIVE_SERVER_IP% | IP address of the monitored host which stopped sending events |
| %LAST_EVENT_TIME_STAMP% | Date/Time of the last received call (local time) |
| %LAST_EVENT_TIME_STAMP_UTC% | Date/Time of the last received event (UTC) |
| %INACTIVITY_PERIOD_MINUTES% | Period of inactivity in minutes |
| %INACTIVITY_PERIOD_HOURS% | Period of inactivity in hours |
Linux Tab
The service user name configured during agent installation can be updated on the Agent Properties Linux Tab.
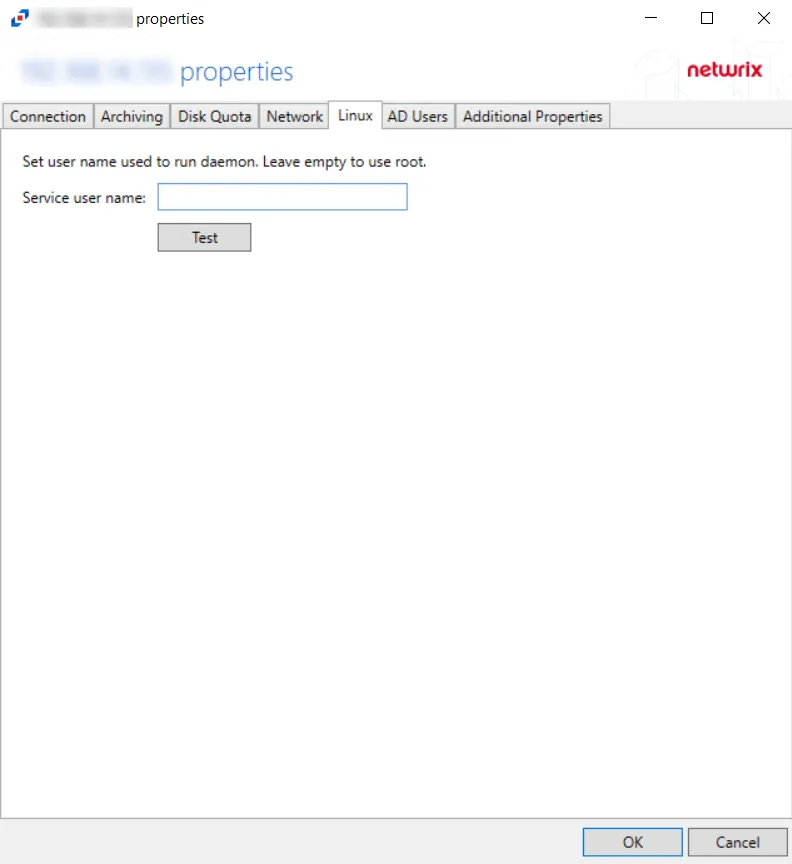
Enter a new service user name to run daemon and click Test to verify the connection.
Click OK to commit the modifications. Click Cancel to discard the modifications. The Agent Properties window closes.
Agent Properties Window
On the Agents tab, the Edit button opens the agent’s Properties window, which contains the following tabs:
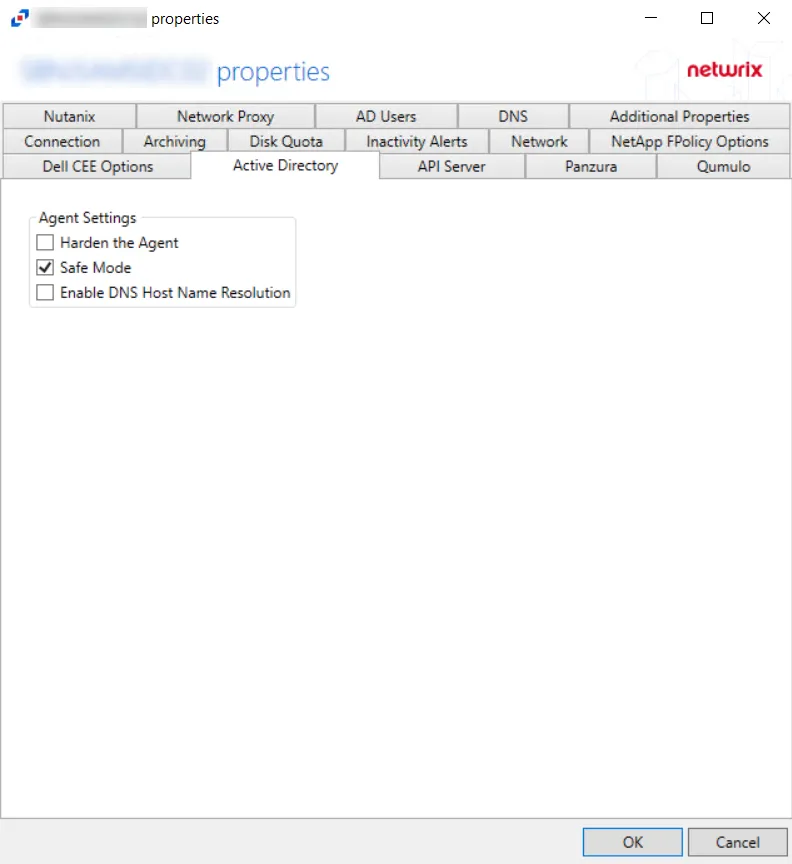
- Active Directory Tab – AD Agent only
- AD Users Tab
- API Server Tab
- Archiving Tab
- Additional Properties Tab
- Connection Tab
- Disk Quota Tab
- Dell CEE Options Tab – Activity Agent only
- DNS Tab
- Inactivity Alerts Tab
- Linux Tab – Linux Agent only
- NetApp FPolicy Options Tab – Activity Agent only
- Network Tab
- Network Proxy Tab
- Nutanix Tab – Activity Agent only
- Panzura Tab – Activity Agent only
- Qumulo Tab – Activity Agent only
Select the desired agent and click Edit to open the agent’s Properties window.