SQL Server
Understanding SQL Server Activity Monitoring
The Activity Monitor provides the ability to feed activity data to other Netwrix products:
- Netwrix Access Analyzer (formerly Enterprise Auditor)
Prior to adding a SQL Server host to the Activity Monitor, the prerequisites for the target environment must be met. See the SQL Server Activity Auditing Configuration topic for additional information.
Remember, the Activity Agent must be deployed to a Windows server that acts as a proxy for monitoring the target environment.
Add MS SQL Server Host
Follow the steps to add a SQL Server host to be monitored.
Step 1 – In Activity Monitor, go to the Monitored Hosts tab and click Add. The Add New Host window opens.
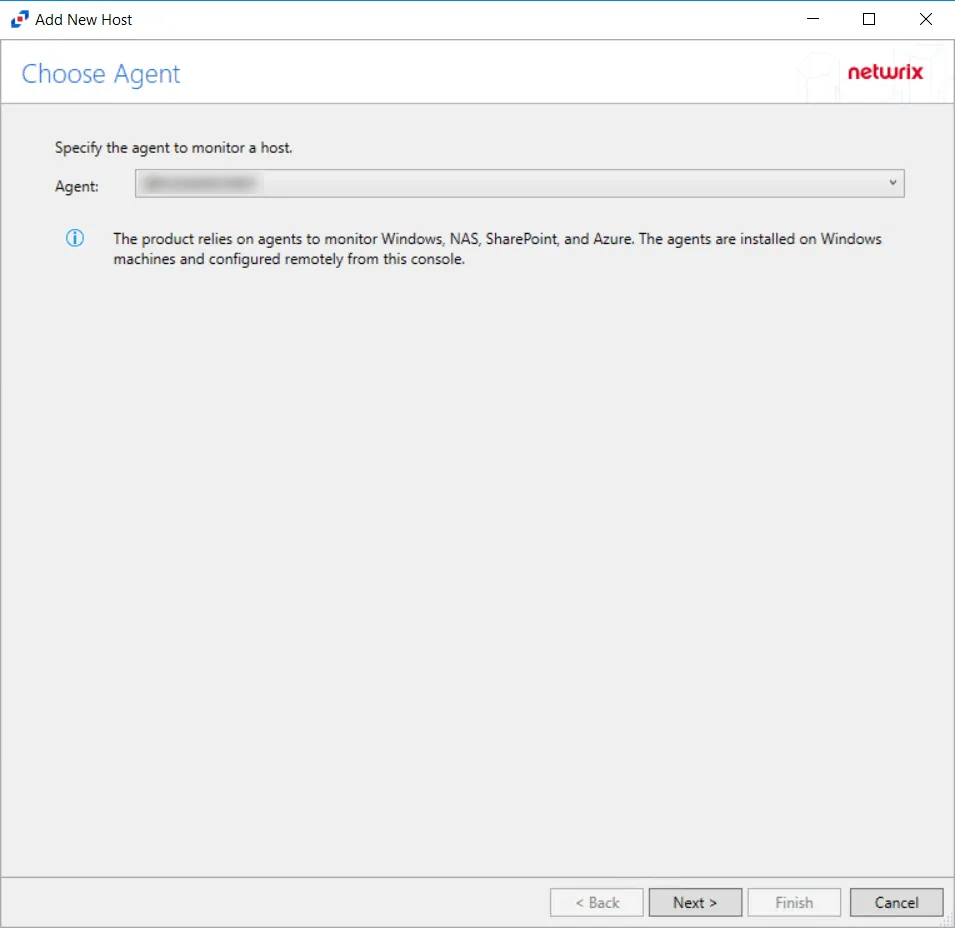
Step 2 – On the Choose Agent page, select the Agent to monitor the storage device, then click Next.
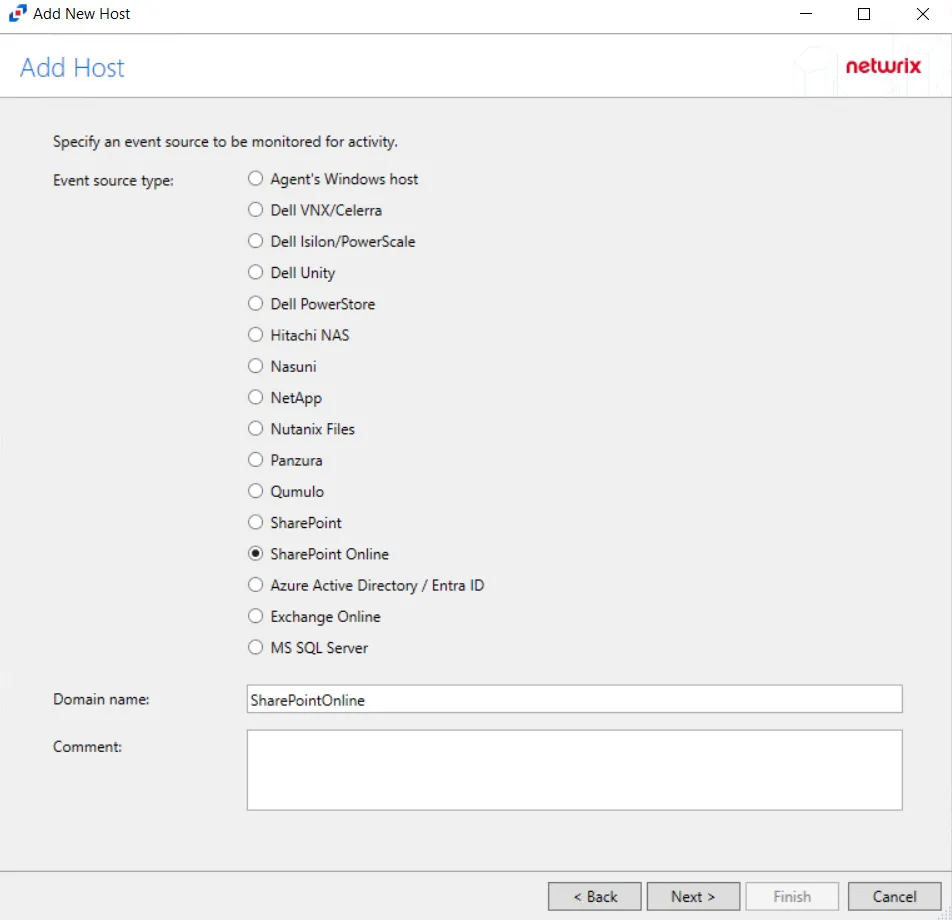
Step 3 – On the Add Host page, select MS SQL Server and enter the Server name or address for the SQL Server host., then click Next.
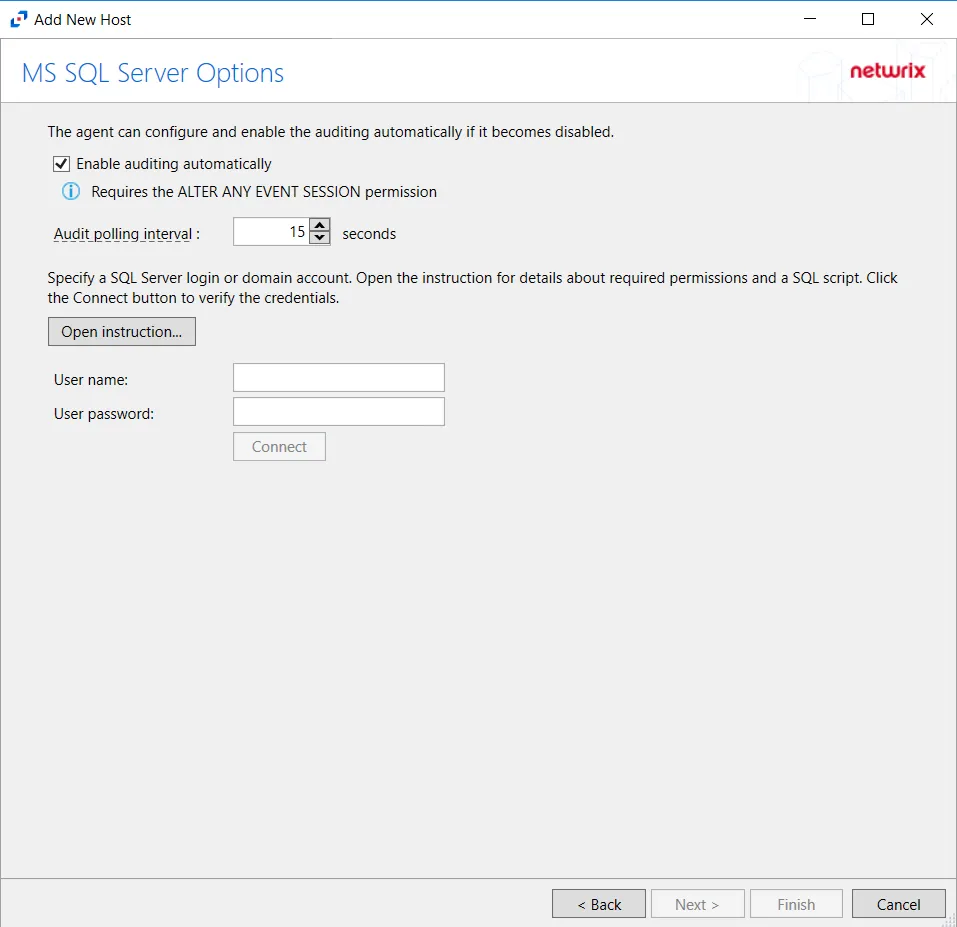
Step 4 – On the MS SQL Server Options page, configure the following options:
- Enable Audit automatically — Check the box to enable automatic auditing if it is ever disabled
- Open instruction — Opens the How to create a SQL Login for Monitoring page. See the SQL Server Database section of the SQL Server Activity Auditing Configuration topic for additional information.
- User name — Enter the user name for the credentials for the SQL Server
- User password — Enter the password for the credentials for the SQL Server
Click Connect to test the settings, then click Next.
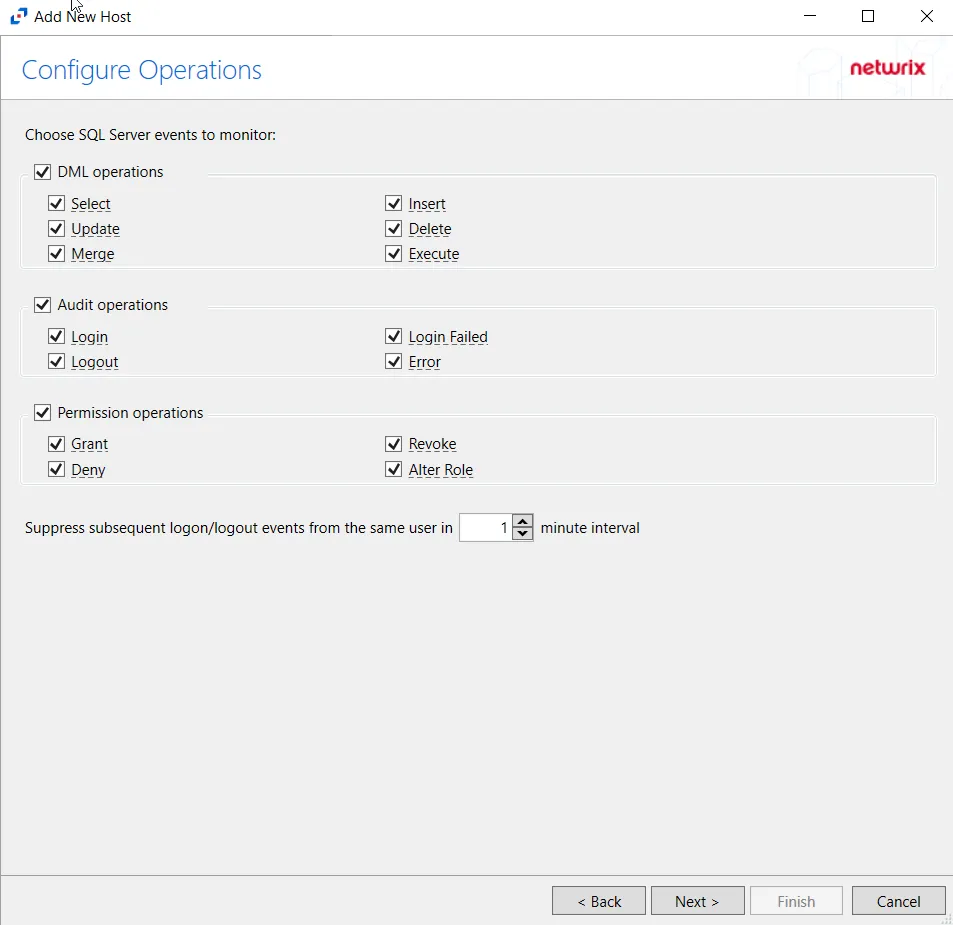
Step 5 – On the Configure Operations page, select which SQL Server events to monitor, then click Next.
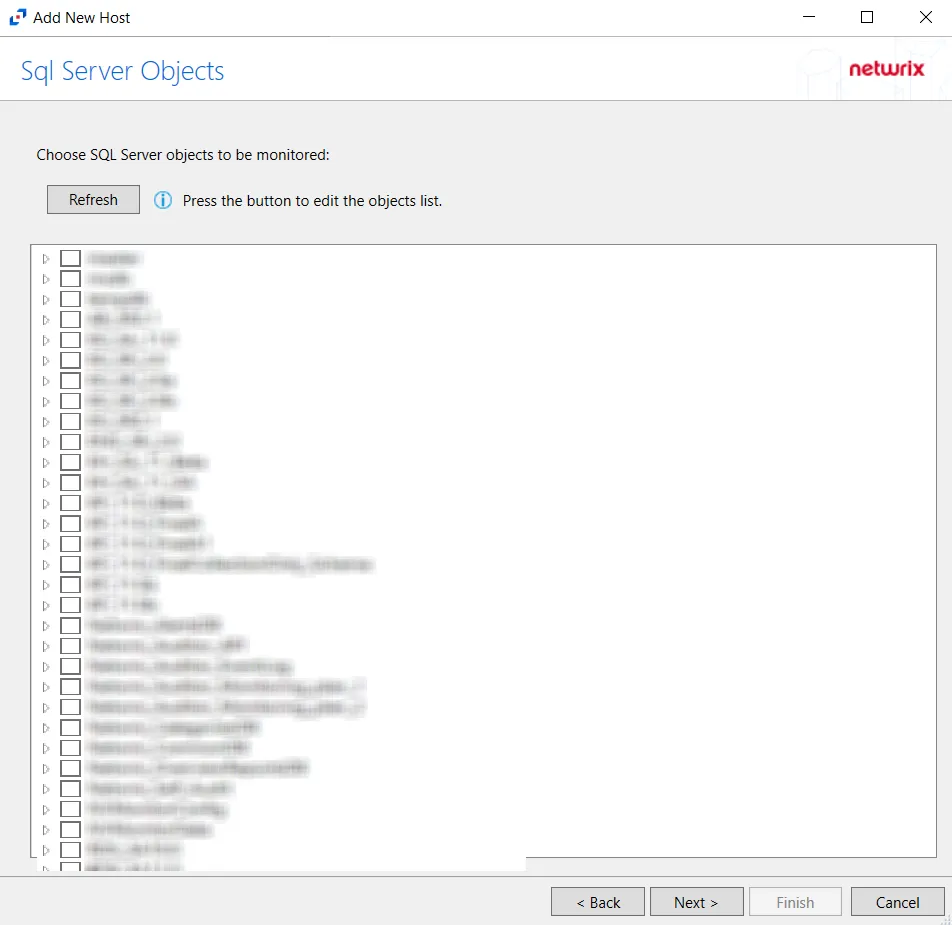
Step 6 – On the SQL Server Objects page, click Refresh. Select the SQL Server objects to be monitored. Click Next.
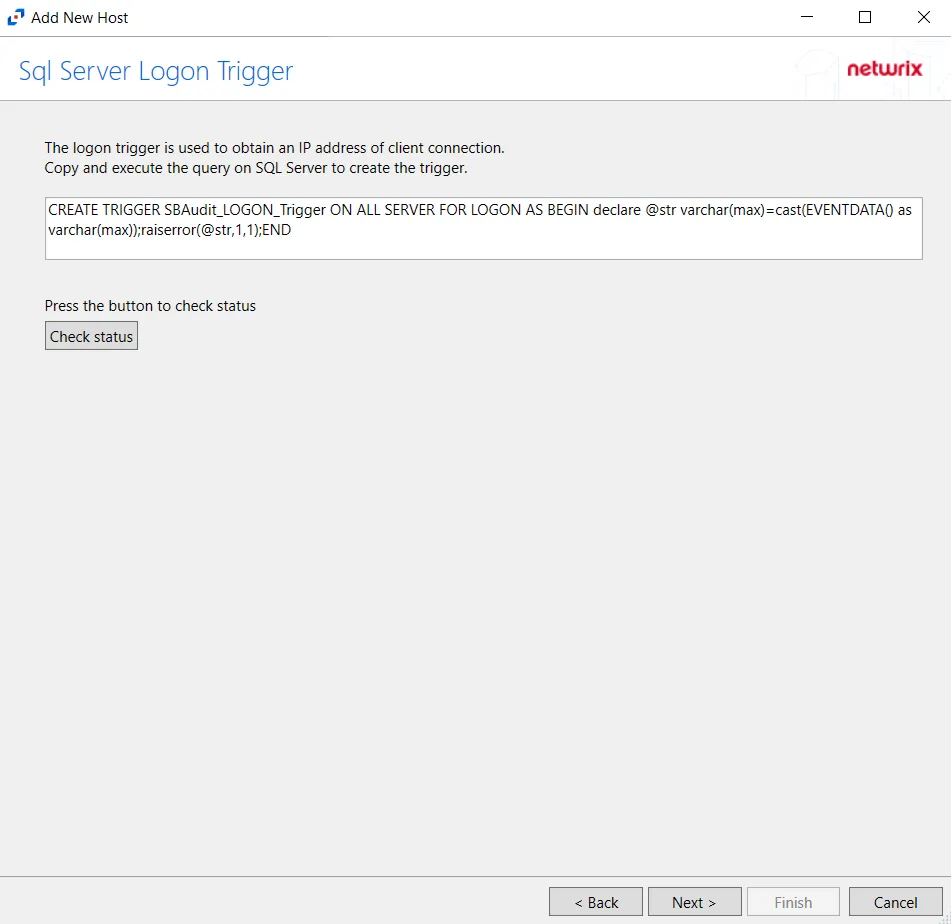
Step 7 – On the SQL Server Logon Trigger page, copy and paste the SQL script into a New Query in the SQL database. Execute the query to create a logon trigger. Netwrix Activity Monitor will monitor SQL logon events and obtain IP addresses for connections. The script is:
CREATE TRIGGER SBAudit_LOGON_Trigger ON ALL SERVER FOR LOGON AS BEGIN declare @str varchar(max)=cast(EVENTDATA() as varchar(max));raiserror(@str,1,1);END

Click Check Status to see if the trigger is configured properly, then click Next.
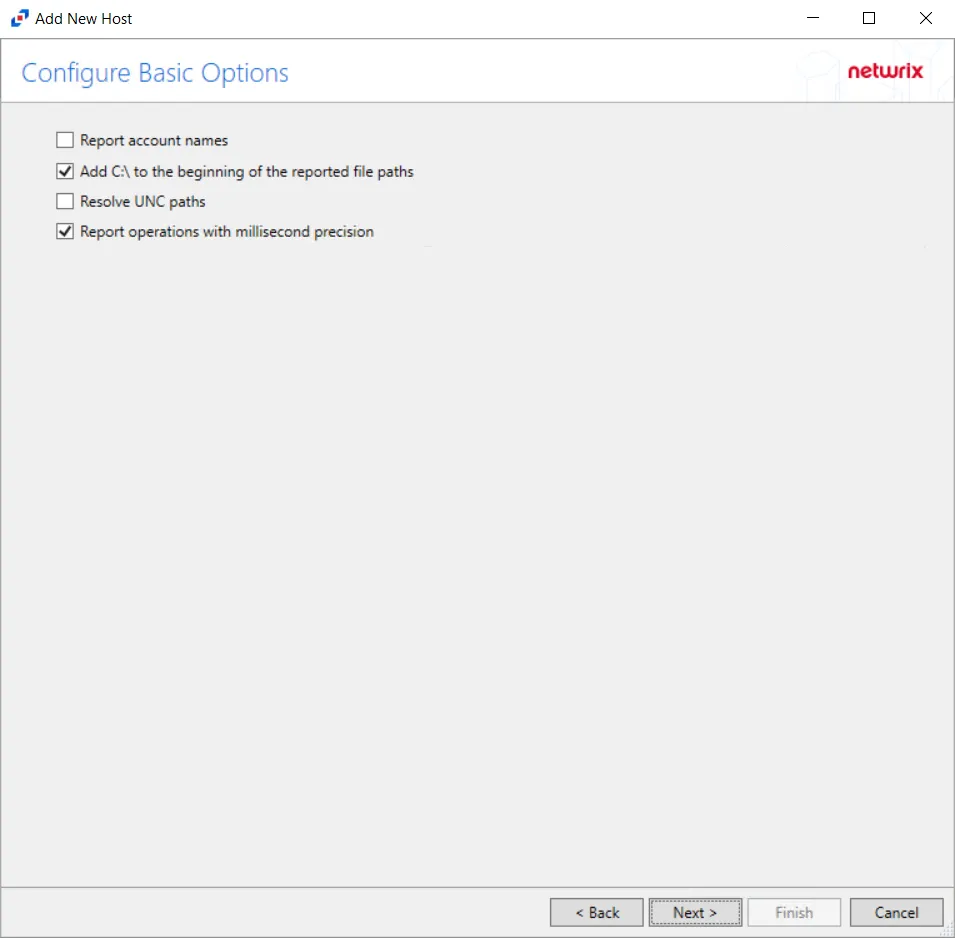
Step 8 – On the Configure Basic Options page,
-
Period to keep Log files - Activity logs are deleted after the number of days entered. Default is set to 10 days.
RECOMMENDED: Keep a minimum of 10 days of activity logs. Raw activity logs should be retained to meet an organization’s audit requirements.
Click Next.
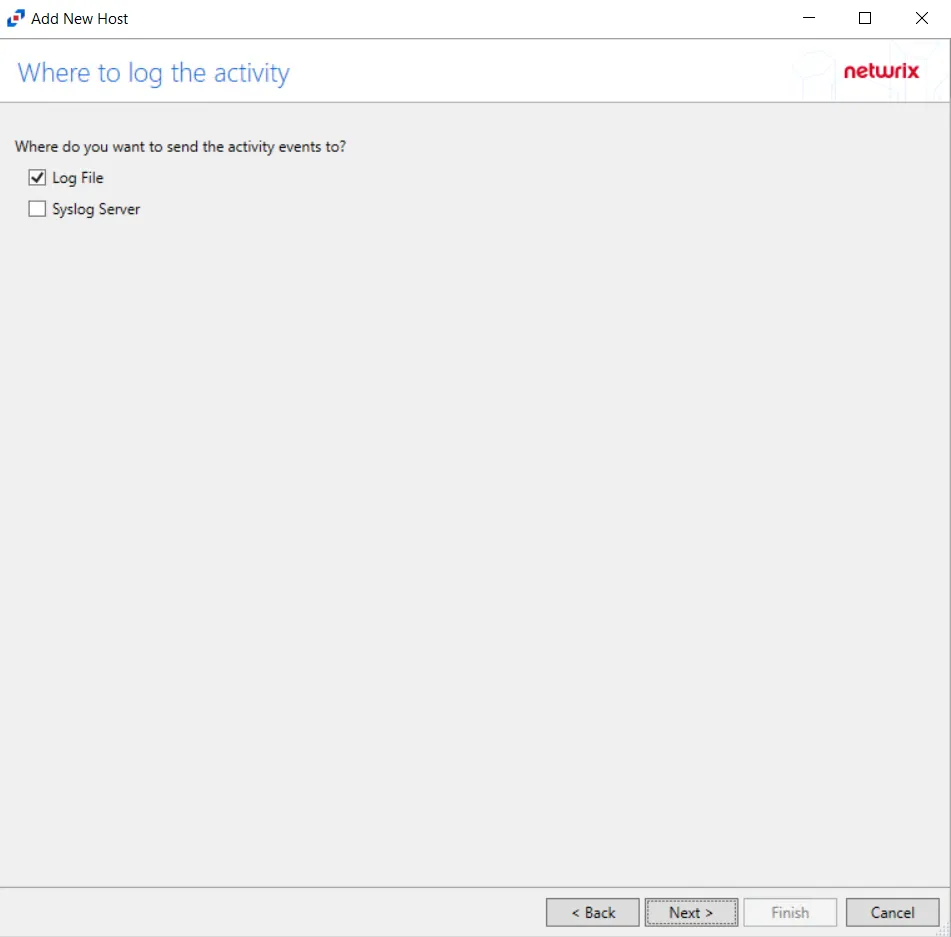
Step 9 – On the Where To Log The Activity page, select whether to send the activity to either a Log File (TSV) or Syslog Server, then click Next.
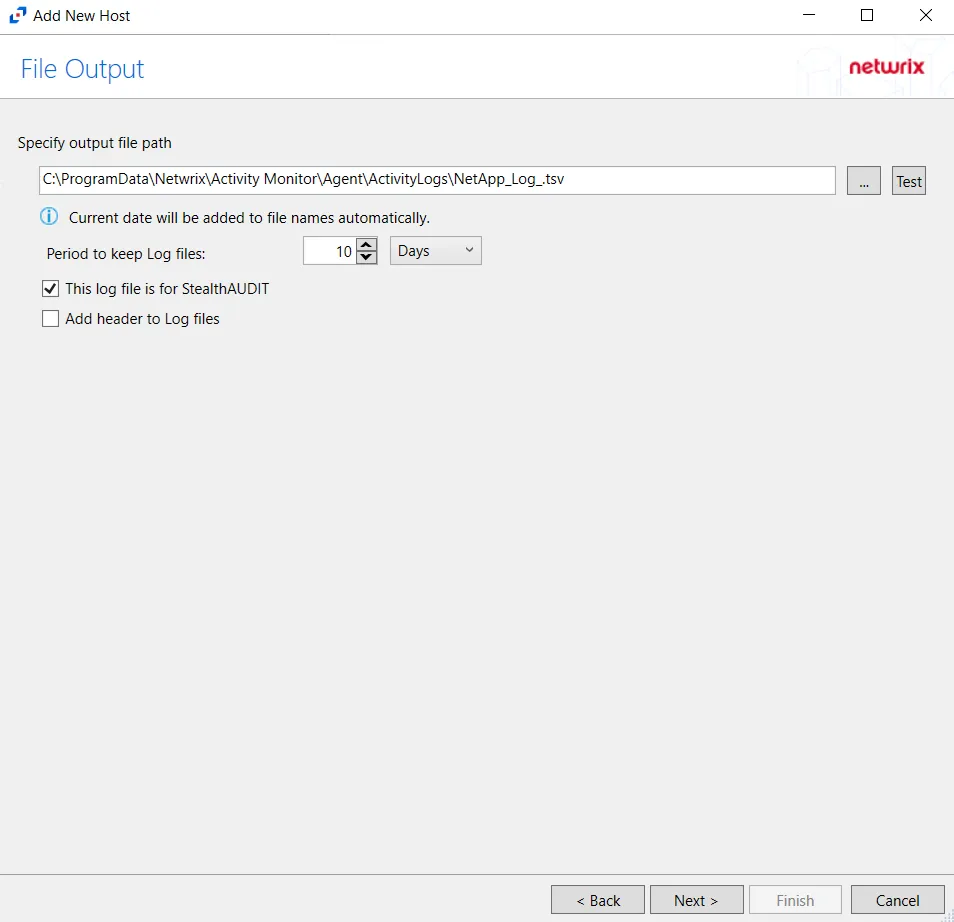
Step 10 – If Log File is selected on the Where To Log The Activity page, the File Output page can be configured.
-
Specify output file path – Specify the file path where log files are saved. Click the ellipses button (...) to open the Windows Explorer to navigate to a folder destination. Click Test to test if the path works.
-
Period to keep Log files – Log files will be deleted after the period entered number of days entered. The default is 10 days. Use the dropdown to specify whether to keep the Log files for a set amount of Minutes, Hours, or Days.
-
This log file is for Access Analyzer – Enable this option to have Access Analyzer collect this monitored host configuration
RECOMMENDED: Identify the configuration to be read by Access Analyzer when integration is available.
- While Activity Monitor can have multiple configurations per host, Access Analyzer can only read one of them.
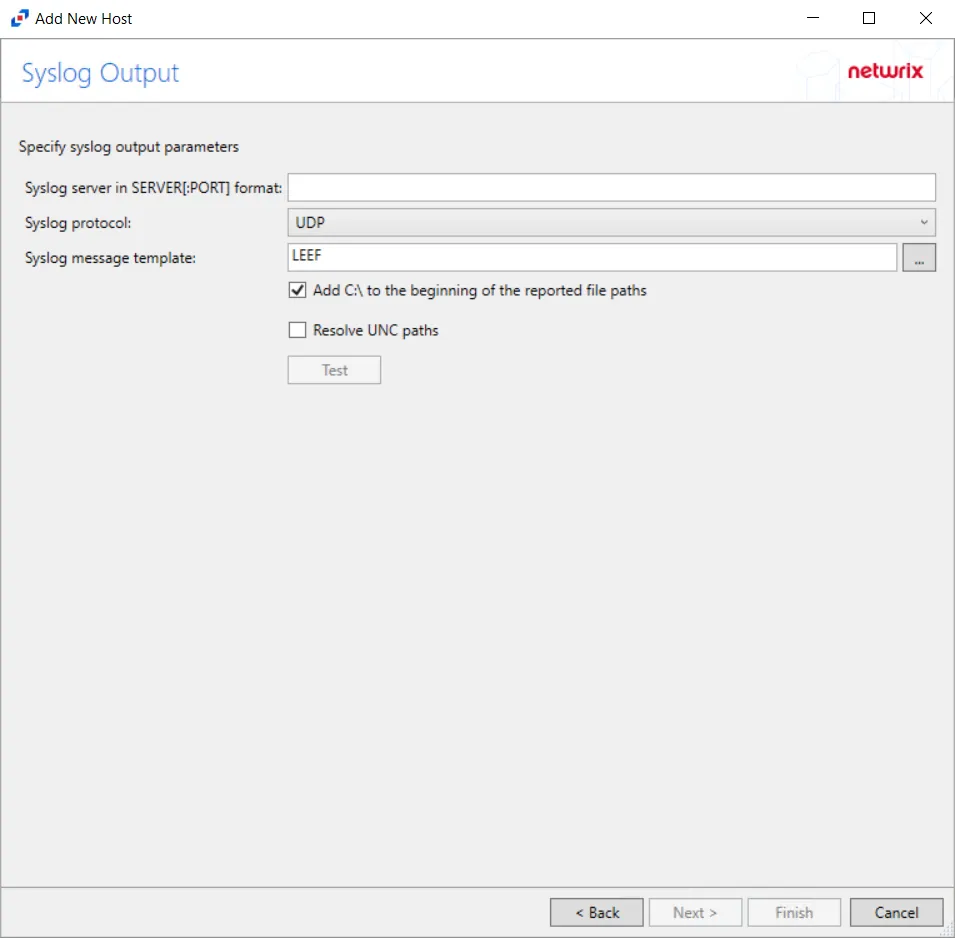
Step 11 – If Syslog Server is selected on the Where To Log The Activity page, the Syslog Output page can be configured.
-
Syslog server in SERVER[:PORT] format – Type the Syslog server name with a SERVER:Port format in the textbox.
- The server name can be short name, fully qualified name (FQDN), or IP Address, as long as the organization’s environment can resolve the name format used. The Event stream is the activity being monitored according to this configuration for the monitored host.
-
Syslog Protocol – Identify the Syslog protocol to be used for the Event stream. The drop-down menu includes:
- UDP
- TCP
- TLS
The TCP and TLS protocols add the Message framing drop-down menu. See the Syslog Tab topic for additional information.
-
The Test button sends a test message to the Syslog server to check the connection. A green check mark or red will determine whether the test message has been sent or failed to send. Messages vary by Syslog protocol:
- UDP – Sends a test message and does not verify connection
- TCP/TLS – Sends test message and verifies connection
- TLS – Shows error if TLS handshake fails
See the Syslog Tab topic for additional information.
Click Finish.
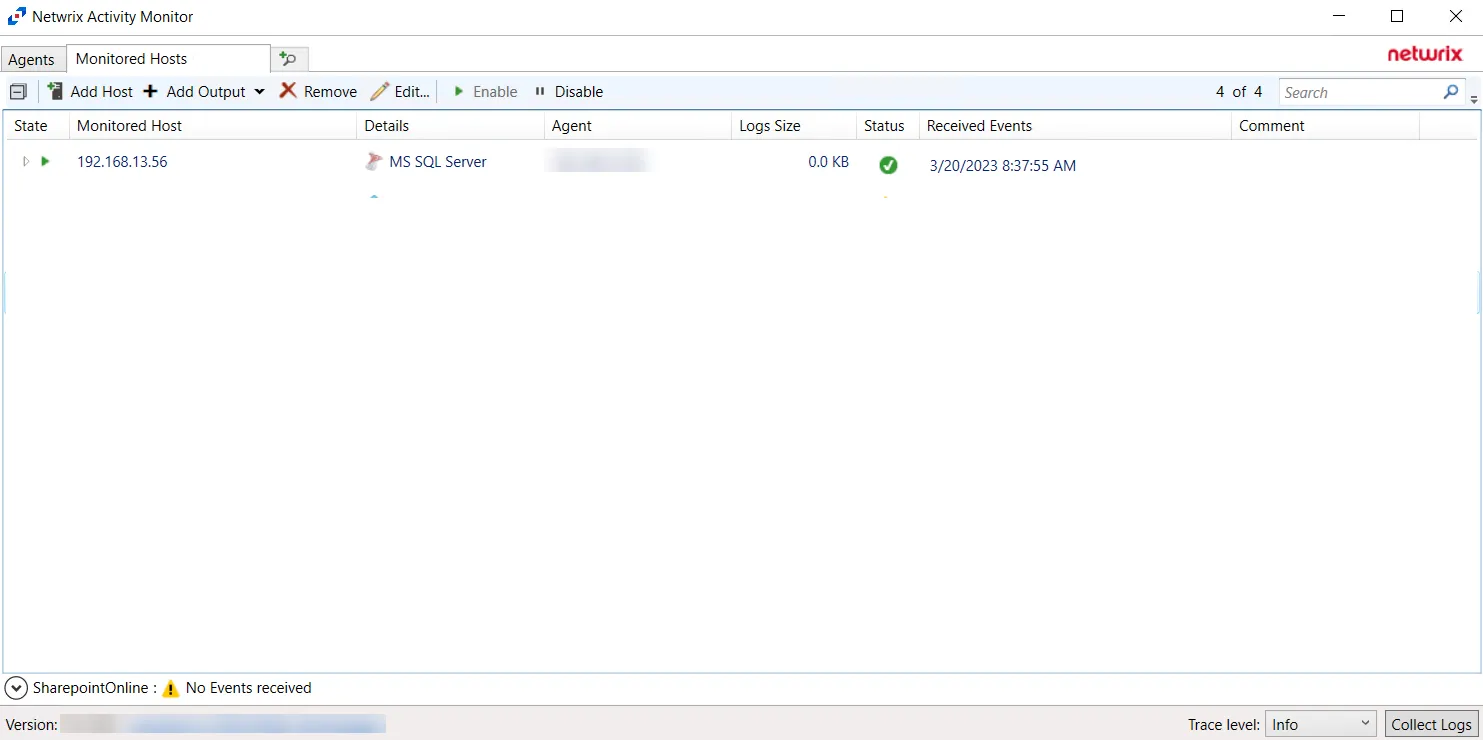
The added SQL Server host is displayed in the monitored hosts table. Once a host has been added for monitoring, configure the desired ouptuts. See the Output for Monitored Hosts topic for additional information.
Host Properties for SQL Server
Configuration settings can be edited through the tabs in the host’s Properties window. The configurable host properties are:
See the Host Properties Window topic for additional information.
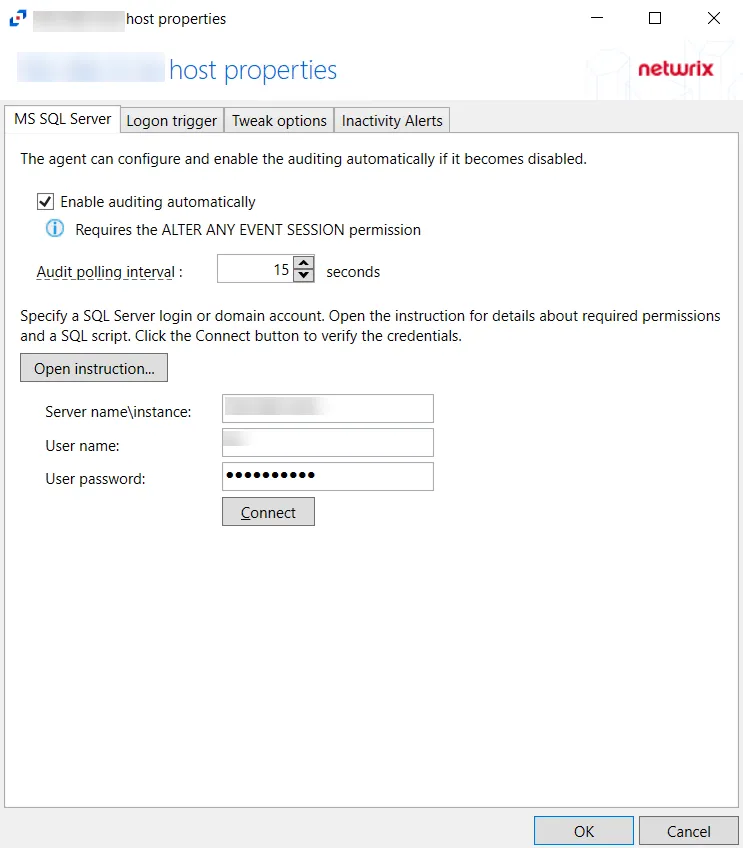
MS SQL Server Tab
The MS SQL Server tab on SQL Server host's properties window is used to configure properties for SQL activity monitoring on the host.
The configurable options are:
-
Enable Trace automatically — Check the box to enable the activity monitor to enable Trace automatically if it is disabled
-
Audit polling interval — Configure the interval between audits. The default is 15 seconds.
-
Open instruction... — Click Open Instruction... to view steps on how to create a login for SQL monitoring
- Certain permissions are required to create a login for SQL monitoring. See the
-
Server name\instance — Server name\instance of the SQL Server to be monitored
-
User name — User for the SQL Server
-
User password — Password for the SQL Server
-
Connect — Click Connect to test the settings