Windows
Understanding File Activity Monitoring
The Activity Monitor can be configured to monitor the following:
- Ability to collect all or specific file activity for specific values or specific combinations of values
It provides the ability to feed activity data to SIEM products. The following dashboards have been specifically created for Activity Monitor event data:
- For IBM® QRadar®, see the Netwrix File Activity Monitor App for QRadar for additional information.
- For Splunk®, see the File Activity Monitor App for Splunk for additional information.
It also provides the ability to feed activity data to other Netwrix products:
- Netwrix Access Analyzer (formerly Enterprise Auditor)
- Netwrix Threat Manager
Prior to adding a Windows host to the Activity Monitor, the prerequisites for the target environment must be met. See the Windows File Server Activity Auditing Configuration topic for additional information.
Remember, the Activity Agent must be deployed to the server. It cannot be deployed to a proxy server.
Add Agent's Windows Host
Follow the steps to add a Windows host to be monitored, if it was not configured when the agent was deployed.
Step 1 – In Activity Monitor, go to the Monitored Hosts tab and click Add. The Add New Host window opens.
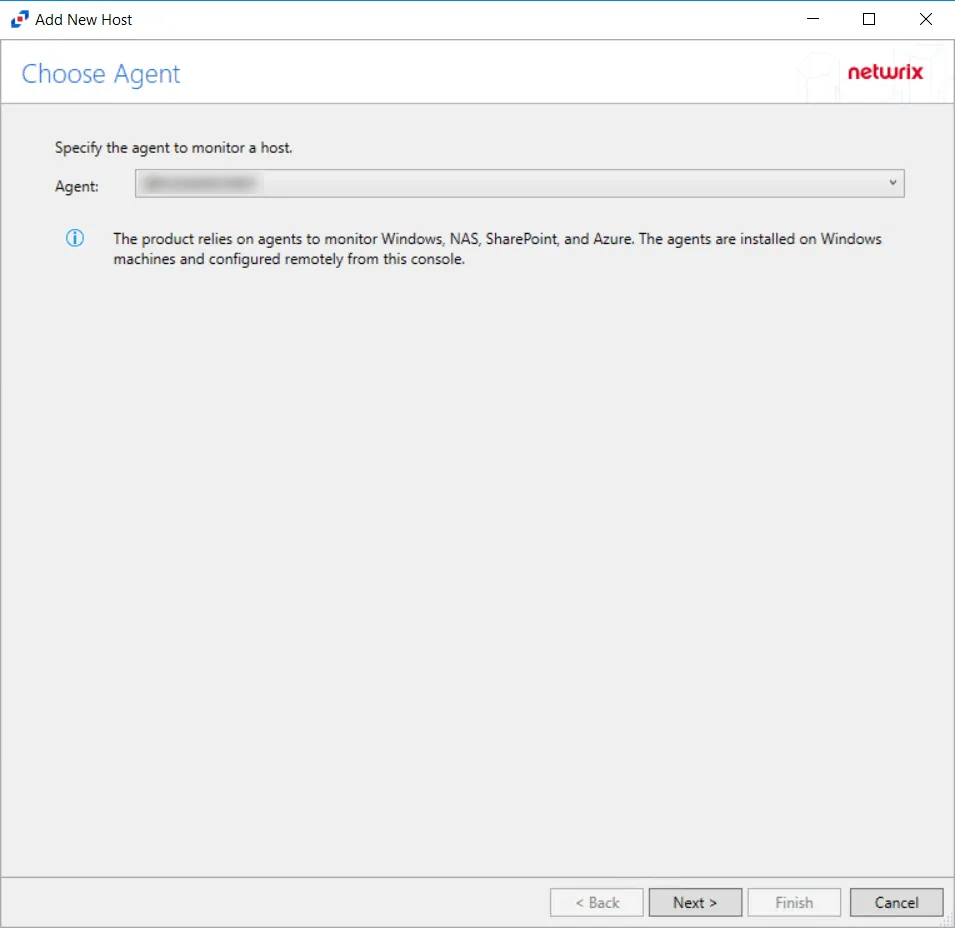
Step 2 – On the Choose Agent page, select the Agent to monitor deployed on the Windows file server. Click Next.
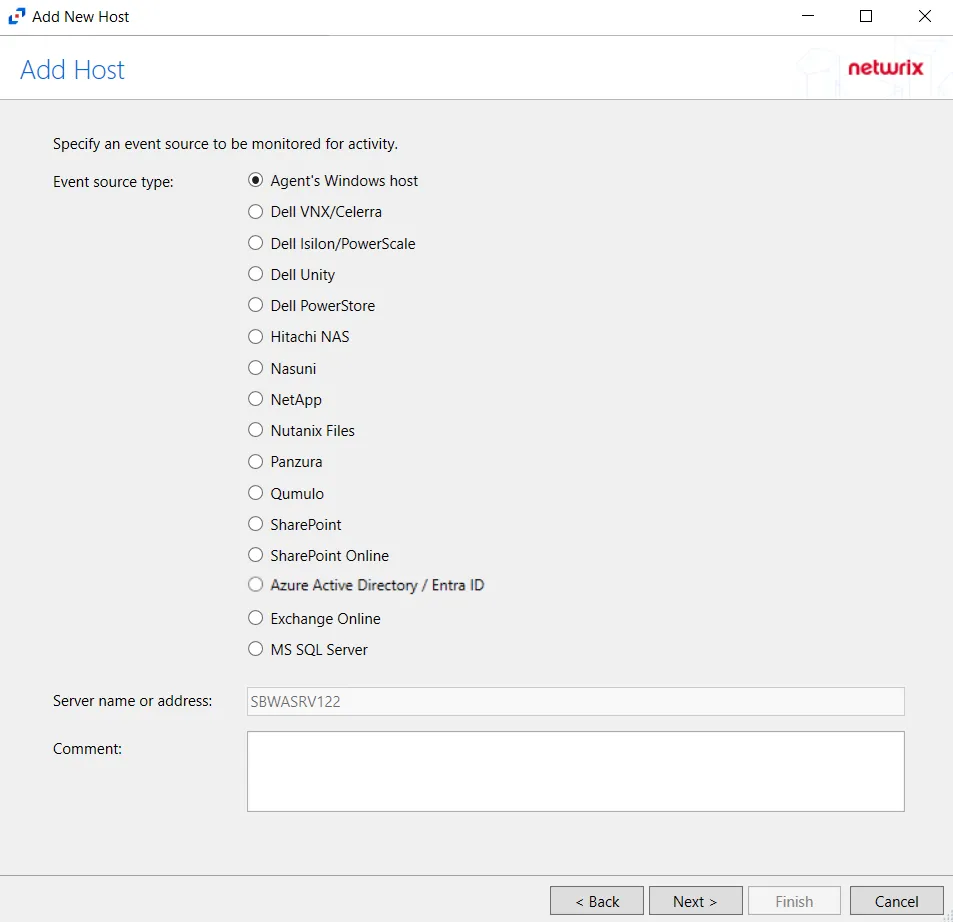
Step 3 – On the Add Host page, select the Agent’s Windows host radio button. Remember, the agent must be deployed on the Windows file server to be monitored. If desired, add a Comment. Click Next.

Step 4 – On the Protocols page, select which protocols to monitor. The protocols that can be monitored are:
- All
- CIFS
- NFS
Click Next.
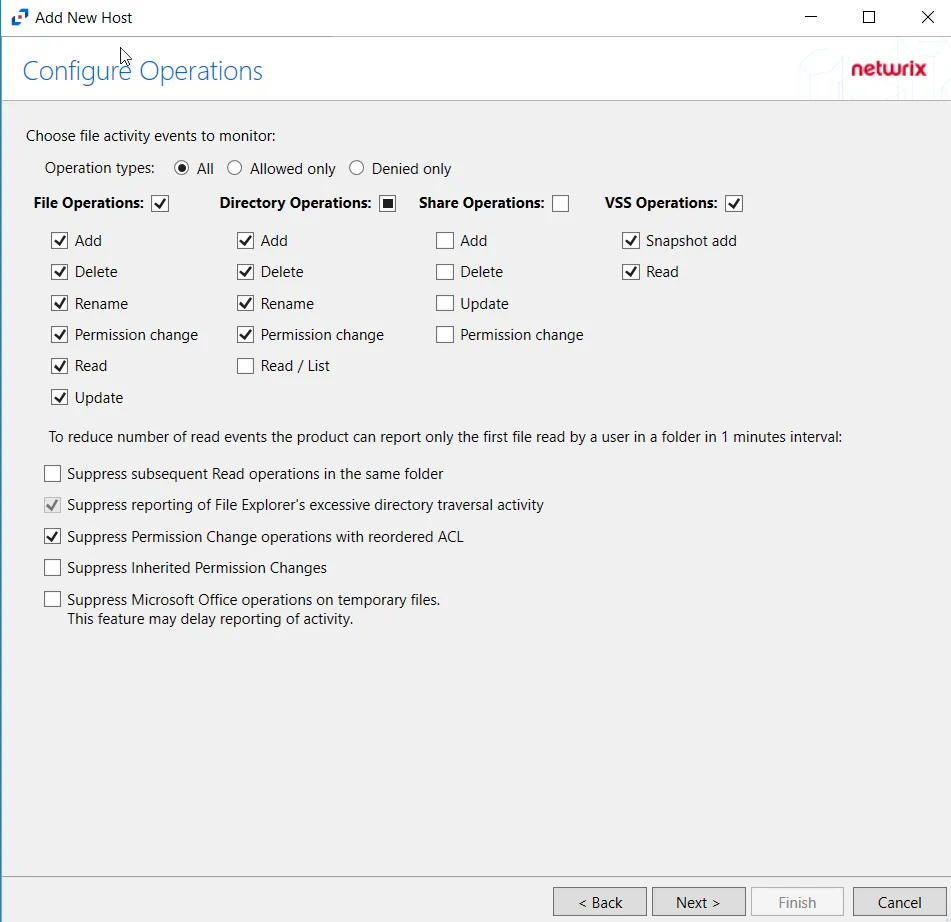
Step 5 – On the Configure Operations page, select the File Operations,Directory Operations, Share Operations and VSS Opertions to be monitored. Users may also filter events by operation type by selecting the radio button:
- All – Reports both allowed and denied operations
- Allowed only – Reports only allowed operations
- Denied only – Reports only denied operations
Additional options include:
CAUTION: Enabling the Suppress subsequent Read operations in the same folder option can result in Read events not being monitored.
- Suppress subsequent Read operations in the same folder – Logs only one Read operation when subsequent Read operations occur in the same folder. This option is provided to improve overall performance and reduce output log volume.
- Suppress reporting of File Explorer's excessive directory traversal activity – Filters out events of excessive directory traversal in File Explorer.
- Suppress Permission Change operations with reordered ACL – Prevents tracking events where permission updates occurred resulting in reordered ACEs (Access Control Entries) but with no other changes in the ACL (Access Control List). For example, if a user is removed in the security settings of a file, and then the same user is added back with the same security permissions, the change is not logged.
- Suppress Inherited Permission Changes – Filters out events for inherited permission changes. This option is provided to improve overall performance and reduce output activity log volume.
- Suppress Microsoft Office operations on temporary files – Filters out events for Microsoft Office temporary files. When Microsoft Office files are saved or edited, many temporary files are created. With this option enabled, events for these temporary files are ignored.
Click Next.
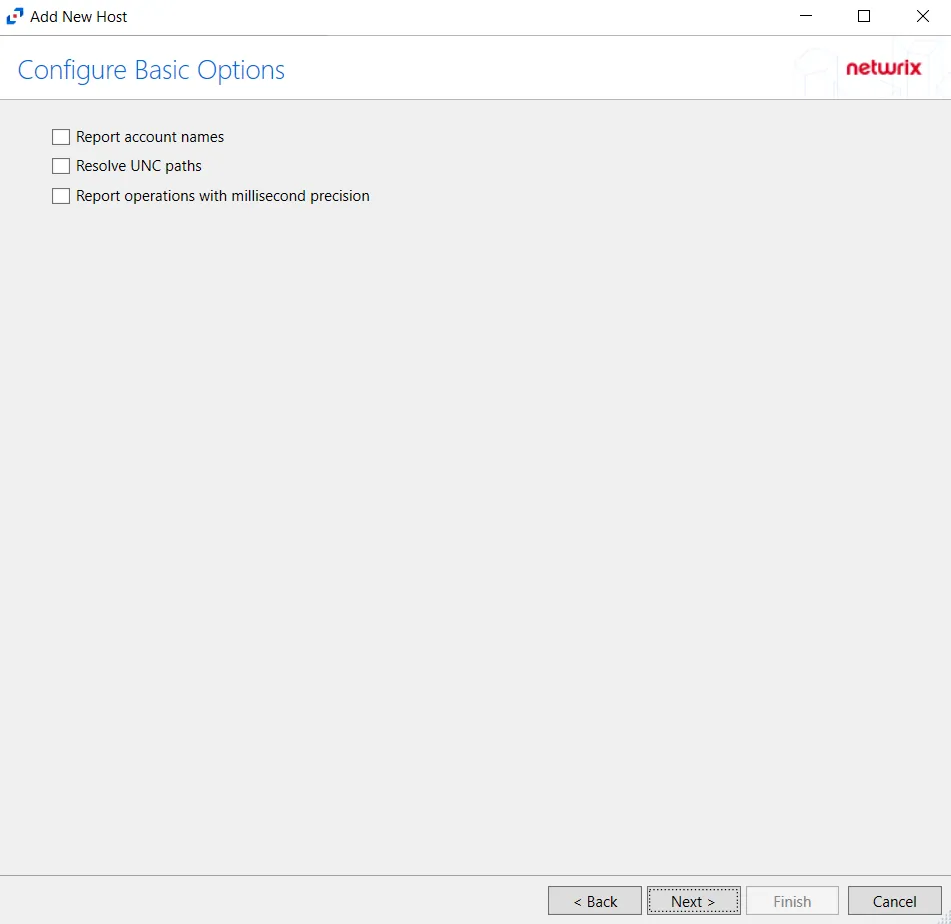
Step 6 – On the Configure Basic Options page, choose which settings to enable. The “Log files” are the activity logs created by the activity agent on the target host. Select the desired options:
- Report Account Names – Adds an Account Name column in the generated TSV files
- Report UNC paths – Adds a UNC Path column and a Rename UNC Path column in the generated TSV files
- This option corresponds to the REPORT_UNC_PATH parameter in the INI file. It is disabled by
default. The UNC Path is in the following format:
- For CIFS activity – \[HOST][SHARE][PATH]
- Example CIFS activity – \ExampleHost\TestShare\DocTeam\Temp.txt
- When the option is enabled, the added columns are populated when a file is accessed remotely through the UNC Path. If a file is accessed locally, these columns are empty. These columns have also been added as Syslog macros.
- This option corresponds to the REPORT_UNC_PATH parameter in the INI file. It is disabled by
default. The UNC Path is in the following format:
- Report operations with millisecond precision – Changes the timestamps of events being recorded in the TSV log file for better ordering of events if multiple events occur within the same second
Click Next.
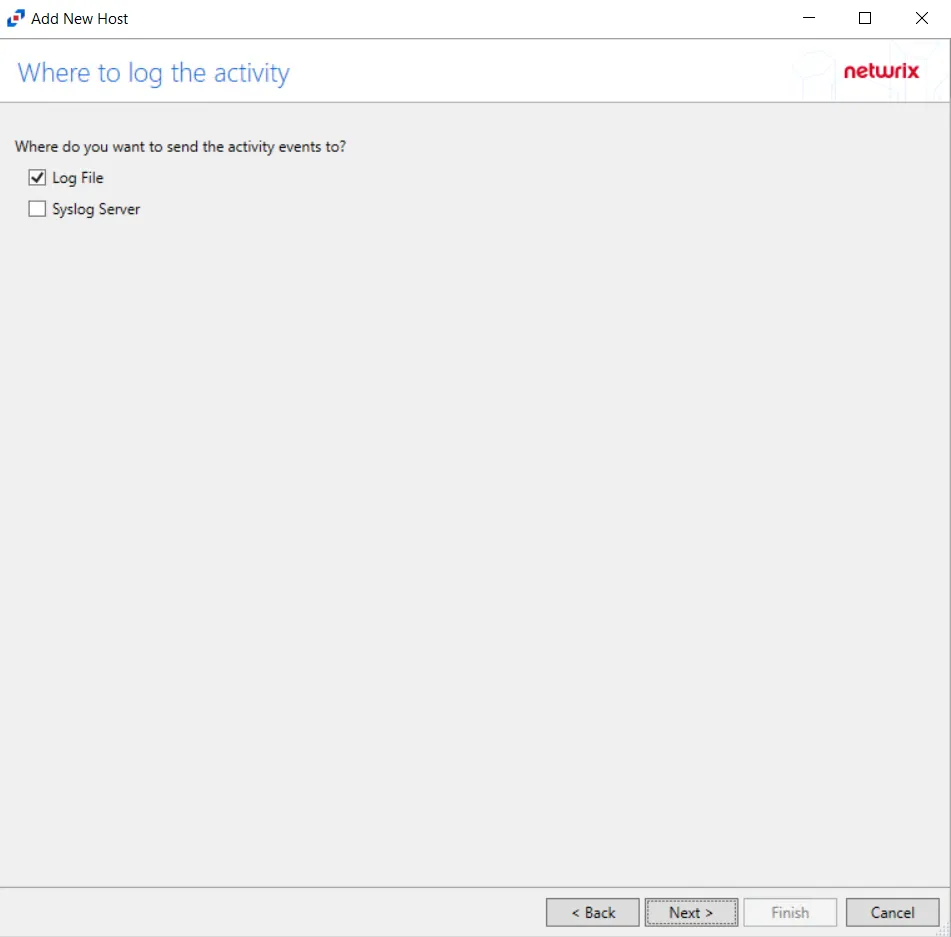
Step 7 – On the Where To Log The Activity page, select whether to send the activity to either a Log File) or Syslog Server. Click Next.
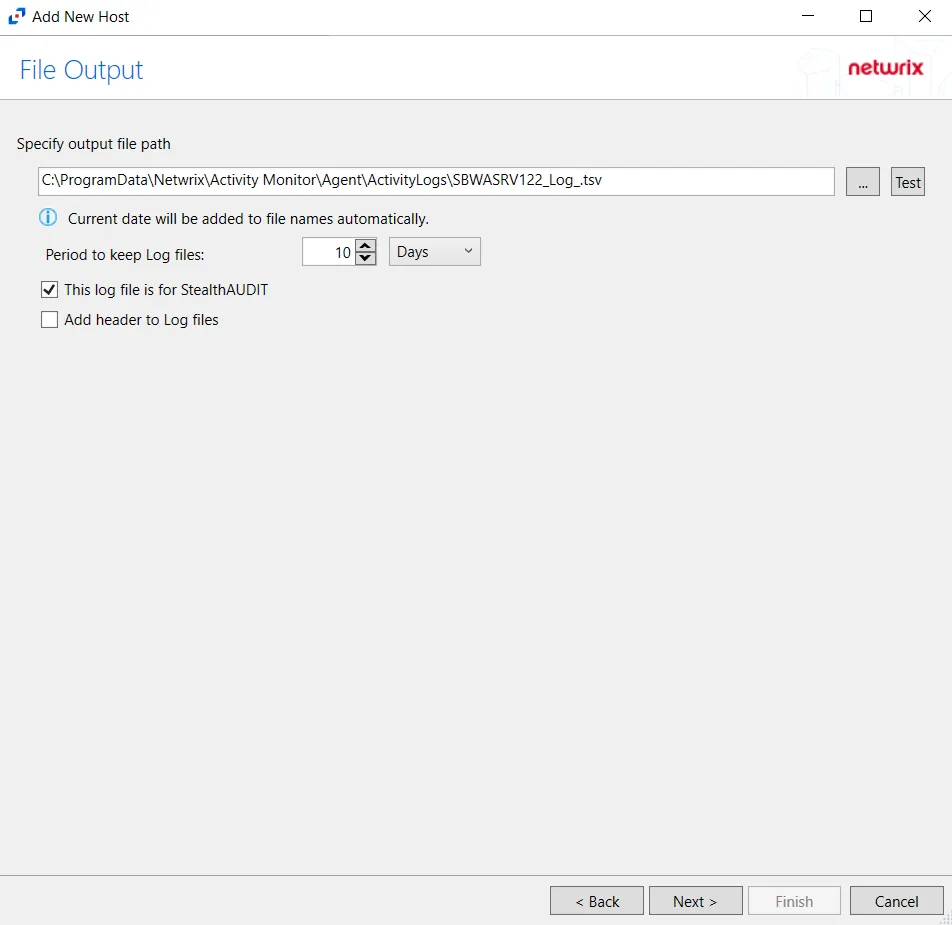
Step 8 – If Log File) is selected on the Where To Log The Activity page, the File Output page can be configured.
-
Specify output file path – Specify the file path where log files are saved. Click the ellipses button (...) to open the Windows Explorer to navigate to a folder destination. Click Test to test if the path works.
-
Period to keep Log files – Log files will be deleted after the period entered number of days entered. The default is 10 days. Use the dropdown to specify whether to keep the Log files for a set amount of Minutes, Hours, or Days.
-
This log file is for Access Analyzer – Enable this option to have Access Analyzer collect this monitored host configuration
RECOMMENDED: Identify the configuration to be read by Access Analyzer when integration is available.
- While Activity Monitor can have multiple configurations per host, Access Analyzer can only read one of them.
Click Next.
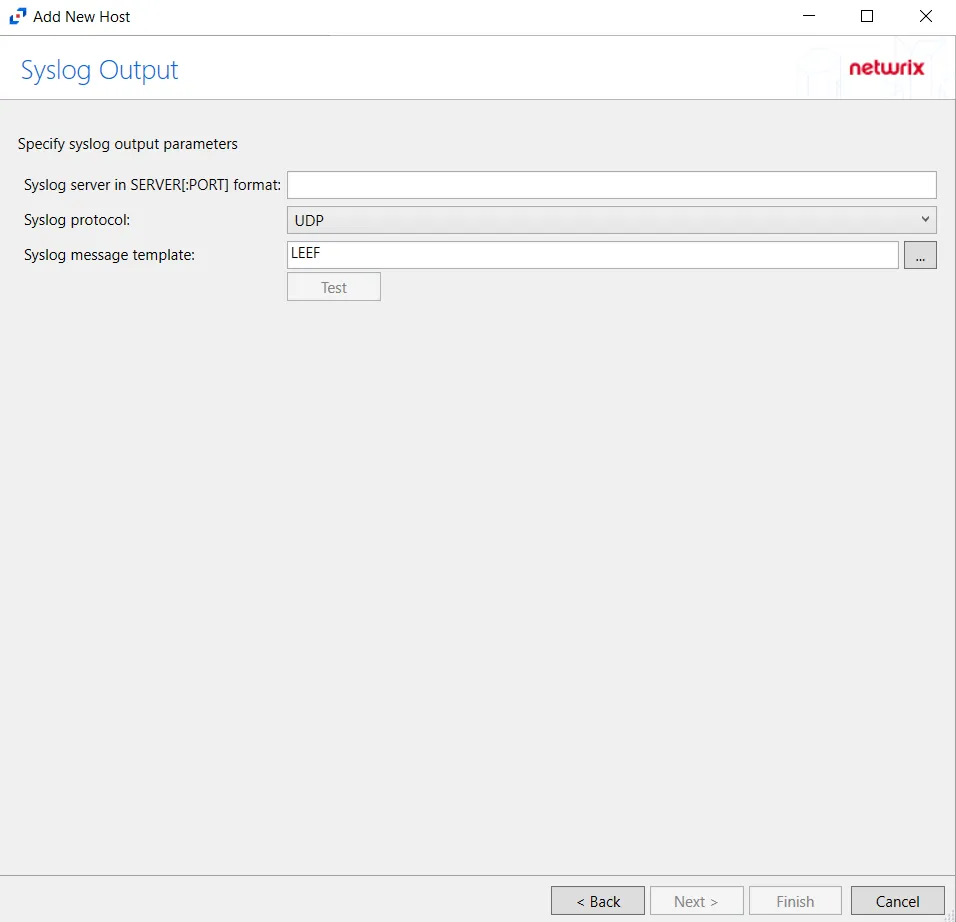
Step 9 – If Syslog Server is selected on the Where To Log The Activity page, the Syslog Output page can be configured.
-
Syslog server in SERVER[:PORT] format – Type the Syslog server name with a SERVER:Port format in the textbox.
- The server name can be short name, fully qualified name (FQDN), or IP Address, as long as the organization’s environment can resolve the name format used. The Event stream is the activity being monitored according to this configuration for the monitored host.
-
Syslog Protocol – Identify the Syslog protocol to be used for the Event stream. The drop-down menu includes:
- UDP
- TCP
- TLS
The TCP and TLS protocols add the Message framing drop-down menu. See the Syslog Tab topic for additional information.
-
The Test button sends a test message to the Syslog server to check the connection. A green check mark or red will determine whether the test message has been sent or failed to send. Messages vary by Syslog protocol:
- UDP – Sends a test message and does not verify connection
- TCP/TLS – Sends test message and verifies connection
- TLS – Shows error if TLS handshake fails
See the Syslog Tab topic for additional information.
Click Finish.
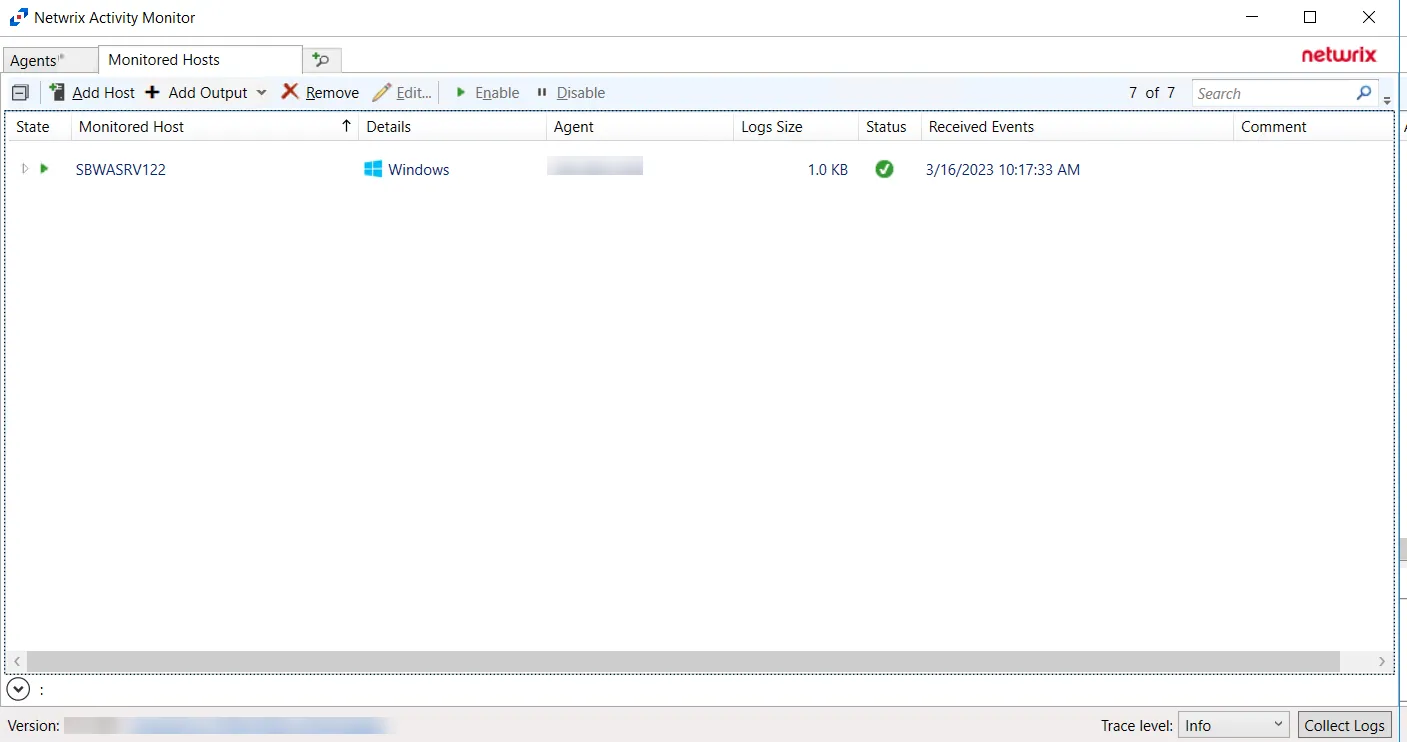
The added Windows file server host is displayed in the monitored hosts table. Once a host has been added for monitoring, configure the desired ouptuts. See the Output for Monitored Hosts topic for additional information.
Host Properties for Windows File Server
Configuration settings can be edited through the tabs in the host’s Properties window. The configurable host properties are:
See the Host Properties Window topic for additional information.
Auditing Tab
The Auditing tab allows users to modify to modify the Isilon Options setting which was populated with the information entered when the Dell Isilon host is added to the Monitored Hosts list.
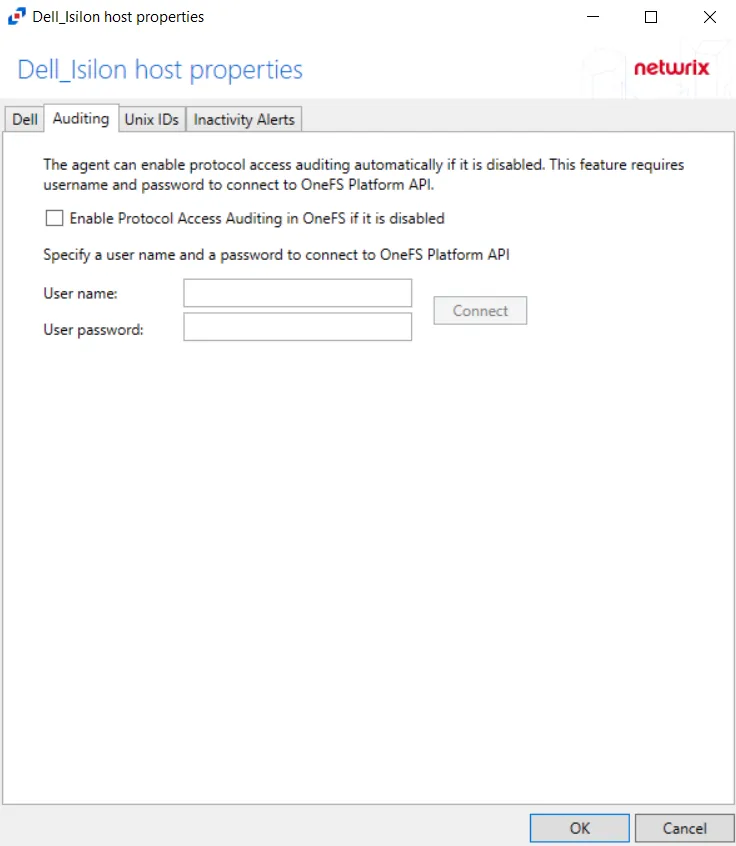
The Enable Protocol Access Auditing in OneFS if it is disabled box allows the activity agent to automatically enable and configure auditing on the Isilon cluster. If a manual configuration has been completed, do not enable these options. This option requires credentials for an Administrator account on the Dell Isilon device and click Connect.
If the connection is successful, discovered access zones appear in the Available box. By default, all available access zones are monitored. To monitor specific access zones, use the arrow buttons to move access zones to the Monitored box. All activity for this configuration for the host is collected and placed in a single activity log file per day. This is the supported option for integration with StealthAUDIT, which requires all access zones to be monitored from a single configuration.
To have one activity log file per access zone, create multiple output configurations for the Dell Isilon device. Add one access zone to each configuration of the monitored host. When adding an Isilon host for each access zone, the Dell device name will be the same for each configuration, but the CIFS/NFS server name must have a unique value.
Connection Tab
Once a host is added to the monitored hosts table, the configuration settings are edited through the tabs in the host’s Properties window. The Connection tab on a host’s Properties window is specific to Microsoft Entra ID (formerly Azure AD), Exchange Online, and SharePoint Online hosts.
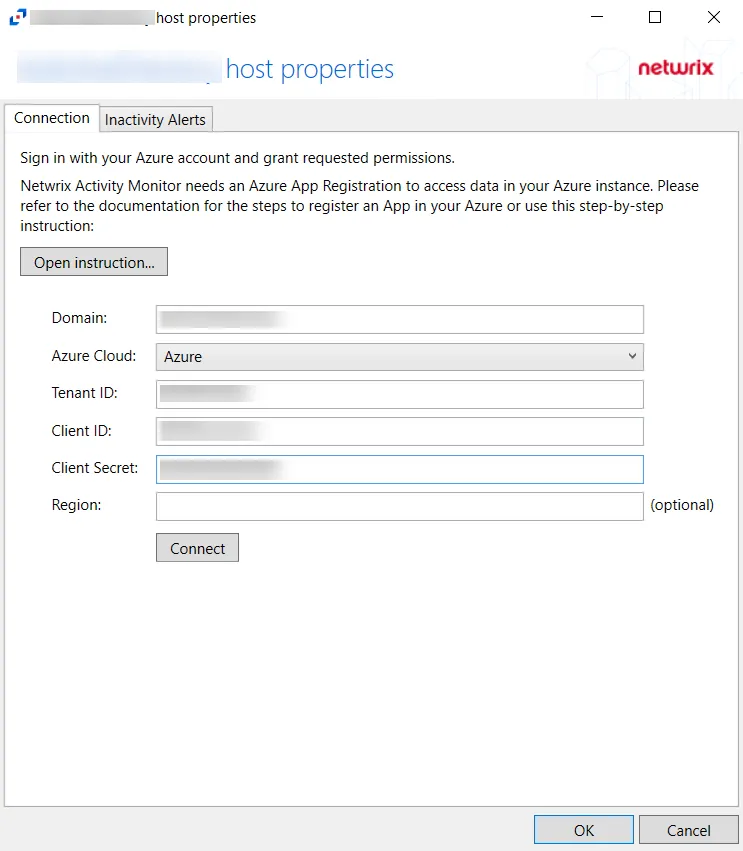
Configure App Registration information for a Microsoft Entra ID host in the Connection Tab of the host's Properties window. Click Open instructions... for steps on registering the Activity Monitor. Click Sign out to sign out of the Azure account.
The options that can be configured on the Connection Tab are:
- Domain
- Azure Cloud
- Tenant ID
- Client ID
- Client Secret
- Region
Click OK to apply changes and exit, or Cancel to exit without saving any changes.
Inactivity Alerts Tab
The Inactivity Alerts tab on a host's Properties window is used to configure alerts that are sent when monitored hosts receive no events for a specified period of time.
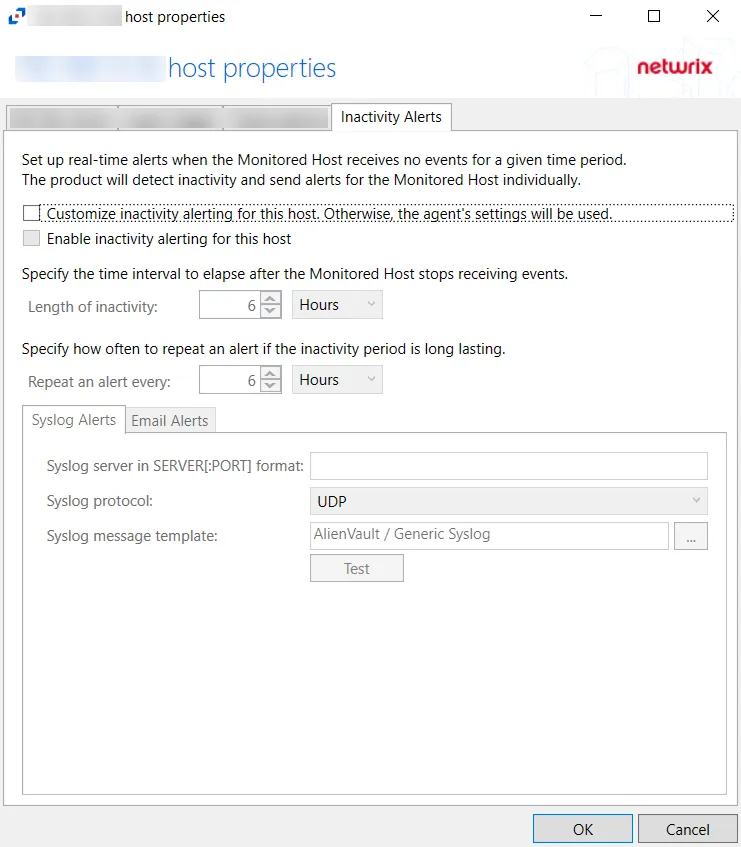
The configurable options are:
- Customize inactivity alerting for this host. Otherwise, the agent's settings will be used – Check this box to enable customization of alert settings for Monitored Hosts
- Enable inactivity alerting for this host – Check this box to enable inactivity alerts for host.
- Length of inactivity – Specify how much time must pass before an inactivity alert is sent out. The default is 6 hours.
- Repeat an alert every – Specify how often an alert is sent out during periods of inactivity. The default is 6 hours.
Syslog Alerts Tab
Configure Syslog alerts using the Syslog Alerts Tab.

The configurable options are:
-
Syslog server in SERVER[:PORT] format – Type the Syslog server name with a SERVER:Port format in the textbox.
-
Syslog protocol – Identify the Syslog protocol to be used for the alerts
- UDP
- TCP
- TLS
-
Syslog message template – Click the ellipsis (…) to open the Syslog Message Template window. The following Syslog templates have been provided:
- AlienVault / Generic Syslog
- CEF – Incorporates the CEF message format
- HP Arcsight
- LEEF – Incorporates the LEEF message format
- LogRhythm
- McAfee
- QRadar – Use this template for IBM QRadar integration. See the Netwrix File Activity Monitor App for QRadar topic for additional information.
- Splunk – Use this template for Splunk integration. See the File Activity Monitor App for Splunk section for additional information.
- StealthDEFEND – Use this template for Netwrix Threat Manager integration. This is the only supported template for Threat Manager.
Email Alerts Tab
Configure Email alerts using the Email Alerts Tab.
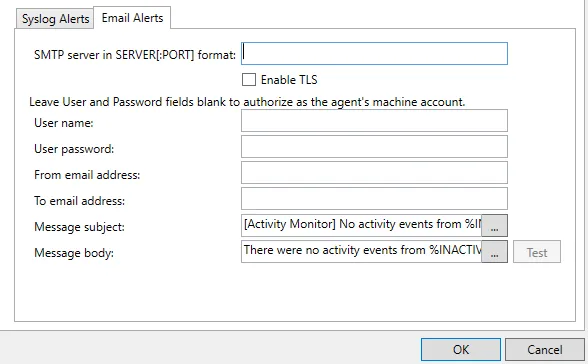
The configurable options are:
-
SMTP server in SERVER[:PORT] format – Enter the SMTP server for the email alerts
- Enable TLS – Check the box to enable TLS encryption
-
User name – (Optional) User name for the email alert
-
User password – (Optional) Password for the username
-
From email address – Email address that the alert is sent from
-
To email address – Email address that the alert is sent to
-
Message subject – Subject line used for the email alert. Click the ellipses (...) to open the Message Template window.
-
Message body – Body of the message used for the email alert. Click the ellipses (...) to open the Message Template window.
Logon Trigger Tab
The Logon trigger tab on a SQL Server host's properties window is used to configure logon triggers for SQL activity monitoring.
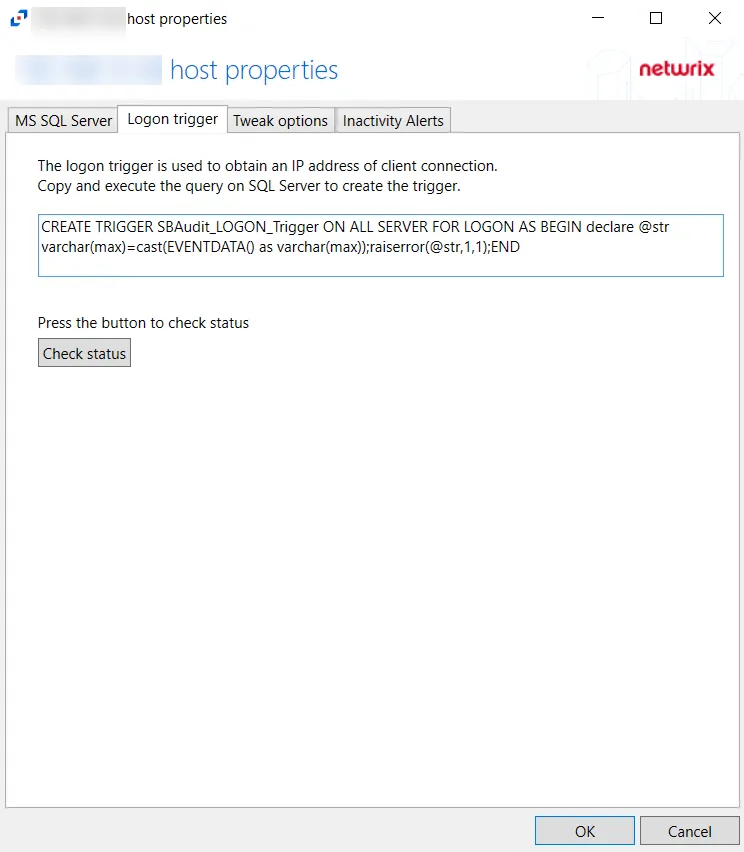
Copy and paste the SQL Script into a SQL query and execute to enable the Activity Monitor to obtain IP addresses of client connections. Click Check Status to check if the trigger is properly configured on the SQL server.
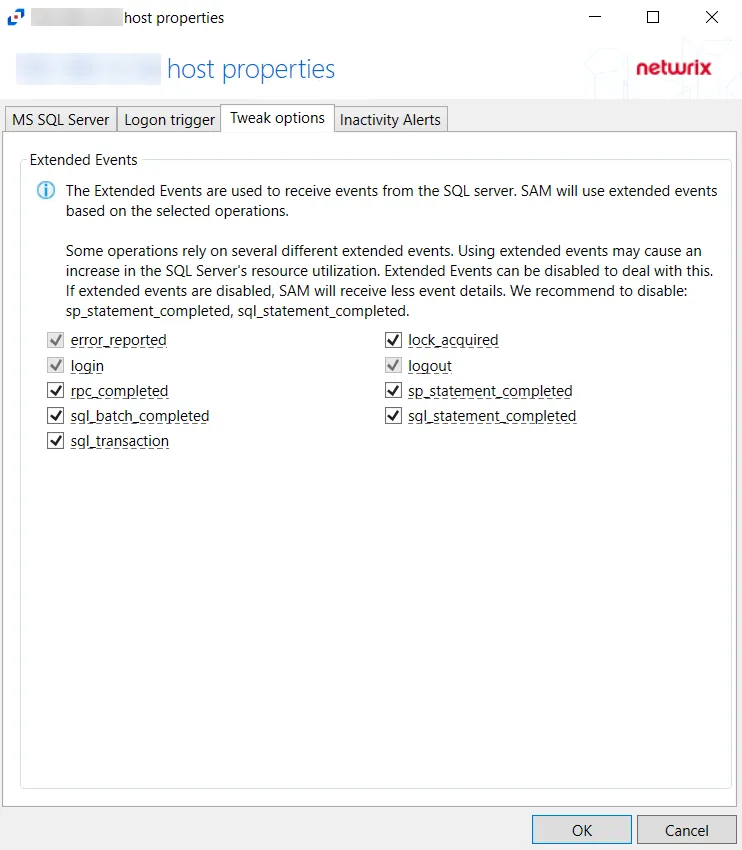
Tweak Options Tab
The Tweak Options tab on a SQL Server host's properties window is used to configure extended events operations for SQL activity monitoring.
Unix IDs Tab
The Unix IDs tab provides configuration options to translate Unix IDs (UID) to SIDs. This tab applies to NetApp devices, Dell devices, and Nasuni Edge Appliances.
When activity is performed on an NFS resource, UIDs are returned for that activity event. Depending on the operating system, the UID can be mapped to Active Directory accounts using the uidNumber attribute in Active Directory. The activity agent resolves the Active Directory SID based on the UID from the activity event.
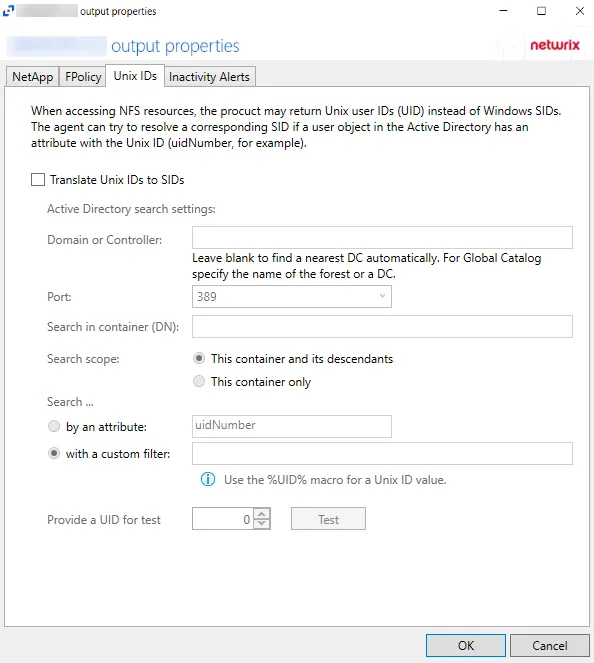
The options are:
- Translate Unix IDs to SIDs – Enables all controls on the page
- Search in container (DN) – Default naming context of the agent's domain
- Search scope – Select from the following radio buttons:
- This container and its descendants
- This container only
- Search - Search using the following specifications:
- by an attribute – Specify an LDAP filter. This attribute cannot be empty.
- with a custom filter – Use the %UID% macro for a Unix ID value
- Provide UID for test/Test – Test button performs a search in the specified container with the scope and the filter, replacing %UID% with 0 for the test
Windows Tab
The Windows tab on a host's Properties window is specific to Windows hosts.
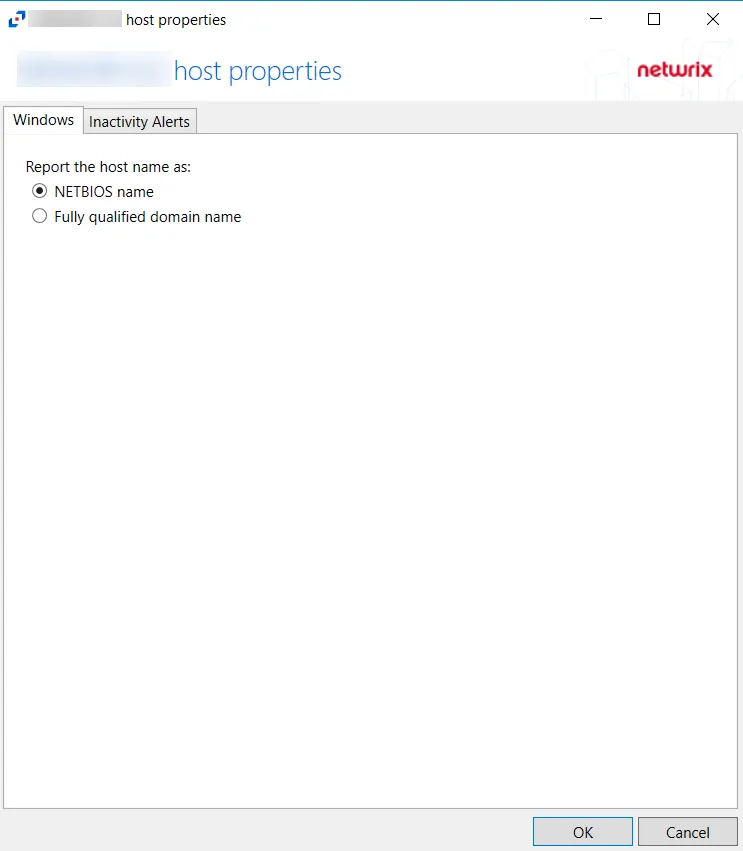
Select whether to report the host name as either a NETBIOS name or a Fully qualified domain name. The Host Name can be previewed to see how it appears depending on the option selected.