Dell CEE Options Tab
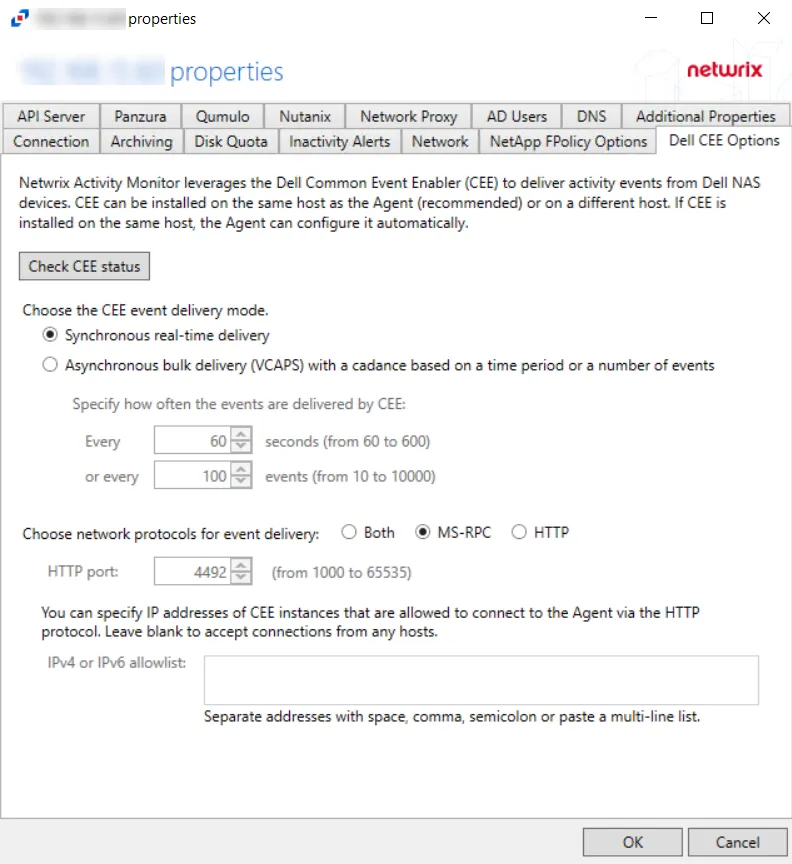
The Dell CEE Options tab provides options to configure Dell Common Event Enabler (CEE) settings for monitoring Dell devices. File activity monitoring leverages the Dell CEE to deliver activity events from Dell devices.
CEE supports two protocols to deliver events to Activity Monitor: RPC and HTTP. An agent can receive activity from several CEEs at the same time. Among them can be a local Windows CEE, remote Windows and Linux CEEs. Windows versions of CEEs can use both RPC and HTTP protocols. Linux versions can only support HTTP protocols.
NOTE: Dell CEE can be installed on the same host as the activity agent, or on a different host. If it is installed on the same host, the activity agent can configure it automatically.
The options are:
-
Check CEE Status – Click the button to confirm the status of Dell CEE installed on the agent server
-
Choose the CEE event delivery mode:
-
Synchronous real-time delivery – Events are delivered immediately as they occur, one by one.
-
Asynchronous bulk delivery (VCAPS) - Events are delivered in batches with a cadence based on a time period or a number of events. As this mode provides better throughput, it is recommended for heavily loaded servers. If selected, specify how often events are delivered by Dell CEE using the following options:
- Every [number] seconds (from 60 to 600) - Default is 60 seconds
- Or every [number] events (from 10 to 10000) - Default is 100 events
- The number of events and number of seconds, are used simultaneously, whichever is reached first
-
-
Choose network protocols for event delivery:
-
Both – Delivers events via MS-RPC and HTTP protocol
-
MS-RPC – Delivers events via the MS-RPC protocol (Windows versions of CEE only)
-
HTTP – Delivers events via the HTTP protocol (Windows and Linux versions of CEE)
- HTTP port – The port number to communicate with the agent. The default port number is 4492, modify if needed. The agent will add the port to the firewall exclusions automatically.
- IPv4 or IPv6 allowlist – Specify IP addresses of CEE instance that are allowed to connect to the agent via the HTTP protocol. Leave blank to accept connections from any host.
-
NOTE: For Remote Windows CEE or Linux CEE, Manual Configuration is needed.
Click OK to commit the modifications. Click Cancel to discard the modifications. The Agent Properties window closes.
Windows CEE Manual Configuration
Windows CEE is configured with the windows registry and depends on the selected event delivery mode, AUDIT or VCAPS.
For the synchronous real-time delivery mode (AUDIT), use the following steps.
Step 1 – Navigate to the following windows registry key
HKEY_LOCAL_MACHINE\SOFTWARE\EMC\CEE\CEPP\Audit\Configuration.
Step 2 – Set the Enabled parameter to 1.
Step 3 – If the EndPoint parameter is empty, set it to the string listed below. If it is not
empty (i.e. some other 3rd party application is also receiving activity events from CEE), append the
following string to the existing EndPoint value, separating them with a semicolon.
- For the RPC protocol,
StealthAUDIT@ip-address-of-the-agent - For the HTTP protocol,
StealthAUDIT@http://ip-address-of-the-agent:port
Step 4 – Restart the CEE Monitor service.
For the asynchronous bulk delivery mode with a cadence based on a time period or a number of events (VCAPS), use the following steps.
Step 1 – Navigate to the following windows registry key
HKEY_LOCAL_MACHINE\SOFTWARE\EMC\CEE\CEPP\VCAPS\Configuration.
Step 2 – Set the Enabled parameter to 1.
Step 3 – If the EndPoint parameter is empty, set it to the string listed below. If it is not
empty (i.e. some other 3rd party application is also receiving activity events from CEE), append the
following string to the existing EndPoint value, separating them with a semicolon.
- For the RPC protocol,
StealthVCAPS@ip-address-of-the-agent - For the HTTP protocol,
StealthVCAPS@http://ip-address-of-the-agent:port
Step 4 – Set FeedInterval to how often, in seconds, information is sent from CEE to the
Activity Monitor. The default is 60 seconds. The range is from 60 seconds to 600 seconds.
Step 5 – Set MaxEventsPerFeed to how many events must occur before information is sent from
CEE to Activity Monitor. The default is 100 events. The range is from 10 events to 10,000 events.
NOTE: The FeedInterval and MaxEventsPerFeed delivery cadences are used simultaneously.
Step 6 – Restart the CEE Monitor service.
NOTE: All protocol strings are case sensitive.
Linux CEE Manual Configuration
CEE binaries, configuration, and log files are located in /opt/CEEPack directory.
Step 1 – Update the configuration file /opt/CEEPack/emc_cee_config.xml.
Step 2 – Restart CEE with /opt/CEEPack/emc_cee_svc restart command.
The CEE configuration file is located at /opt/CEEPack/emc_cee_config.xml. You need to add an
endpoint to the EndPoint node. In addition to the EndPoint node, you need to set Enabled to
1 in either Audit or VCAPS if the Activity Monitor is the only application getting events from
the CEE. If there are multiple applications, enable the delivery modes accordingly.
The EndPoint node's format is a semicolon-separated list of applications
in PartnerId@http://address-of-the-app:port format.
For the Activity Monitor use the following strings:
- For Audit,
StealthAUDIT@http://ip-address-of-the-agent:port - For VCAPS,
StealthVCAPS@http://ip-address-of-the-agent:port
Here's an example for the synchronous delivery (Audit):
<?xml version="1.0" encoding="utf-8"?>

<CEEConfig version="8.8.1.0">

<CEPP>

<Audit>

<Configuration>

<Enabled>1</Enabled>

<EndPoint>StealthAUDIT@http://[IP Address]:[Port]</EndPoint>

</Configuration>

</Audit>

...

<VCAPS>

<Configuration>

<Enabled>0</Enabled>

<EndPoint>StealthVCAPS@http://[IP Address]:[Port]</EndPoint>

<FeedInterval>60</FeedInterval>

<MaxEventsPerFeed>100</MaxEventsPerFeed>

</Configuration>

</VCAPS>

</CEPP>
Here's an example for the asynchronous delivery (VCAPS):
<?xml version="1.0" encoding="utf-8"?>

<CEEConfig version="8.8.1.0">

<CEPP>

<Audit>

<Configuration>

<Enabled>0</Enabled>

<EndPoint>StealthAUDIT@http://[IP Address]:[Port]</EndPoint>

</Configuration>

</Audit>

...

<VCAPS>

<Configuration>

<Enabled>1</Enabled>

<EndPoint>StealthVCAPS@http://[IP Address]:[Port]</EndPoint>

<FeedInterval>60</FeedInterval>

<MaxEventsPerFeed>100</MaxEventsPerFeed>

</Configuration>

</VCAPS>

</CEPP>
Make sure to set Enabled to 1 only in Audit or VCAPS if Activity Monitor is the only product
receiving activity from CEE. Otherwise, enable the modes according to all product requirements.
If you want to send activity to several 3rd party applications, separate them with semicolons.
<Audit>

<Configuration>

<Enabled>1</Enabled>

<EndPoint>Splunk@10.20.30.40:12345;StealthAUDIT@http://[IP Address]:[Port]</EndPoint>

</Configuration>

</Audit>
NOTE: All protocol strings are case sensitive.
Dell Celerra or VNX
Understanding File Activity Monitoring
The Activity Monitor can be configured to monitor the following:
- Ability to collect all or specific file activity for specific values or specific combinations of values
It provides the ability to feed activity data to SIEM products. The following dashboards have been specifically created for Activity Monitor event data:
- For IBM® QRadar®, see the Netwrix File Activity Monitor App for QRadar for additional information.
- For Splunk®, see the File Activity Monitor App for Splunk for additional information.
It also provides the ability to feed activity data to other Netwrix products:
- Netwrix Access Analyzer (formerly Enterprise Auditor)
- Netwrix Threat Prevention
- Netwrix Threat Manager
Prior to adding a Dell Celerra or VNX host to the Activity Monitor, the prerequisites for the target environment must be met. See the Dell Celerra & Dell VNX Activity Auditing Configuration topic for additional information.
Remember, the Activity Agent must be deployed to a Windows server that acts as a proxy for monitoring the target environment.
Add Dell VNX/Celerra Host
Follow the steps to add a Dell Celerra or VNX host to be monitored.
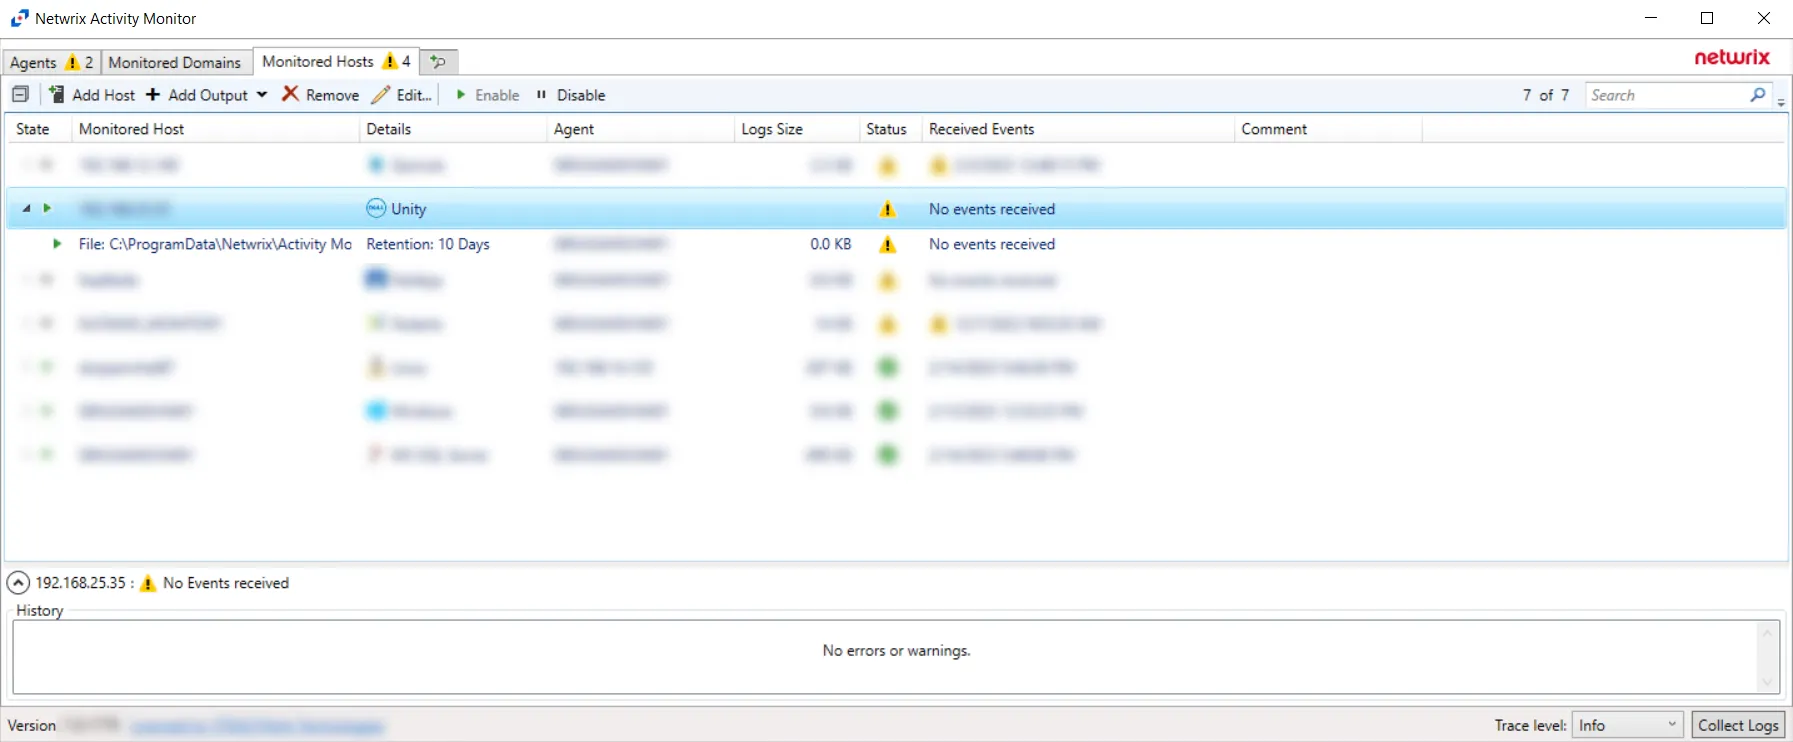
Step 1 – Navigate to the Monitored Hosts tab and click Add. The Add New Host window opens.
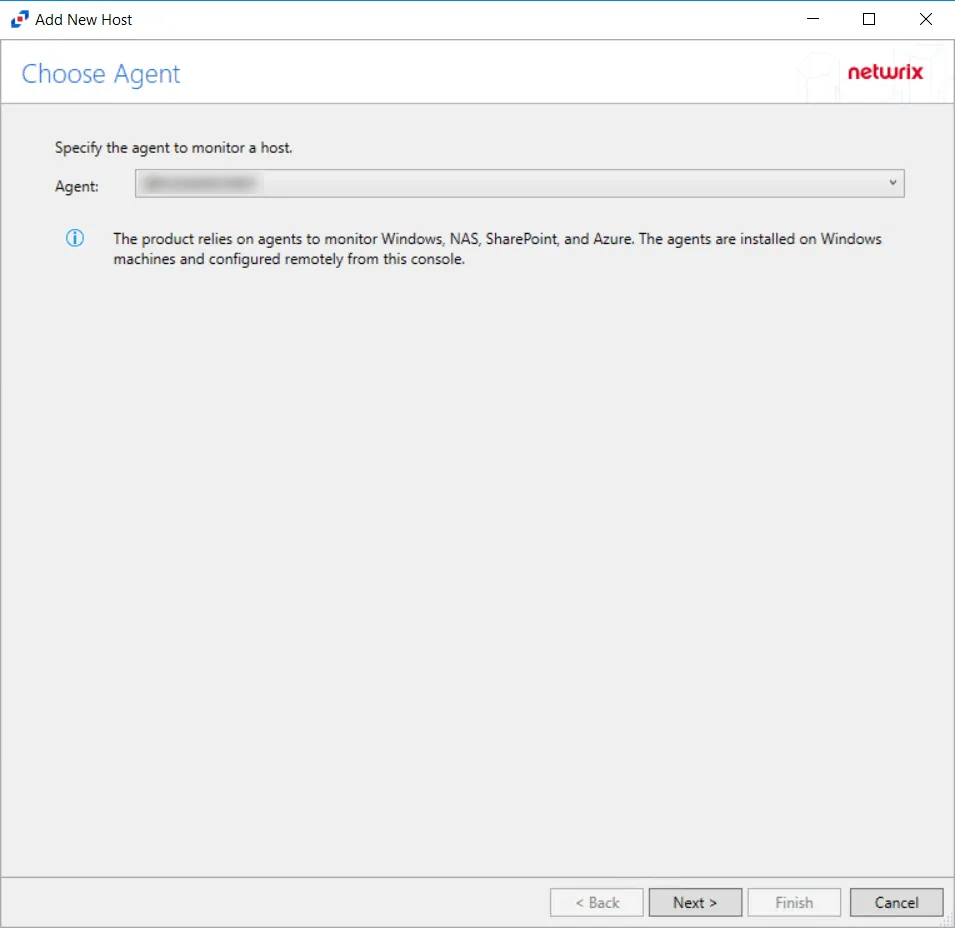
Step 2 – On the Choose Agent page, select the Agent to monitor the storage device. Click Next.
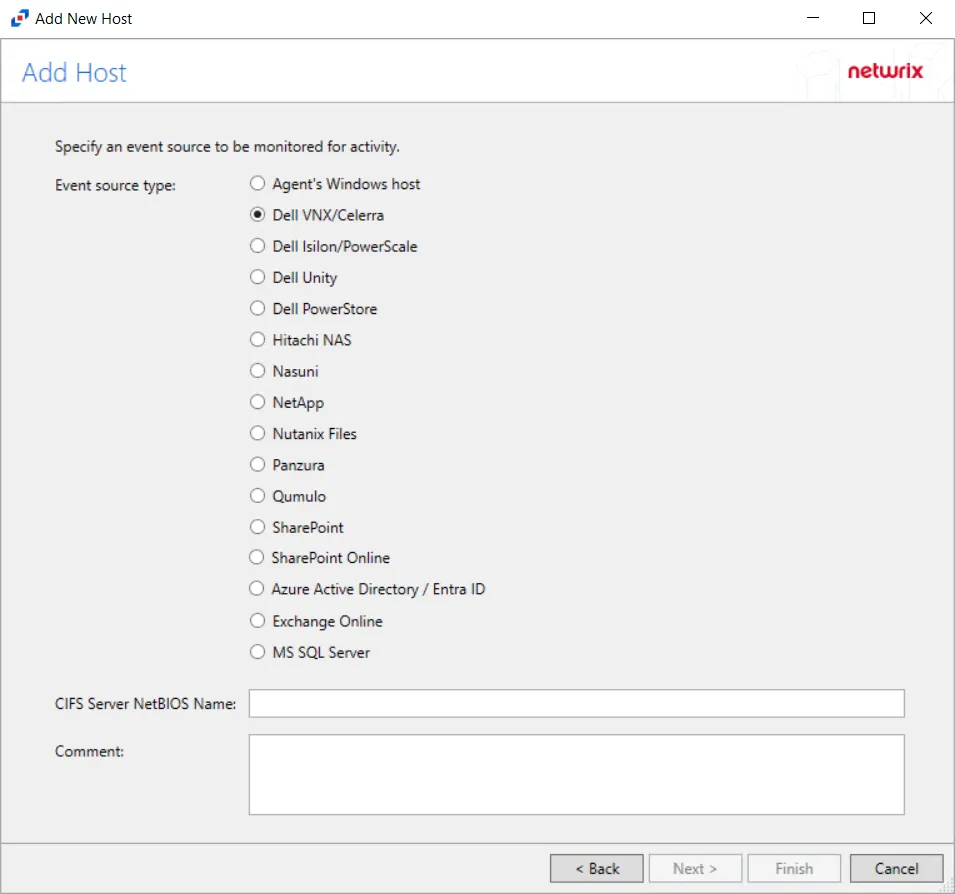
Step 3 – On the Add Host page, select the Dell VNX/Celerra radio button and enter the CIFS Server NetBIOS Name for the device. If desired, add a Comment. Click Next.
NOTE: All Dell event source types must have the CEE Monitor Service installed on the agent in order to collect events. Activity Monitor will detect if the CEE Monitor is not installed and display a warning to install the service. If the CEE Monitor service is installed on a remote machine, manual configuration is required. See the Dell CEE Options Tab topic for additional information.

Step 4 – On the Protocols page, select which protocols to monitor. The list of protocols that can be monitored are All, CIFS, or NIFS. Click Next.
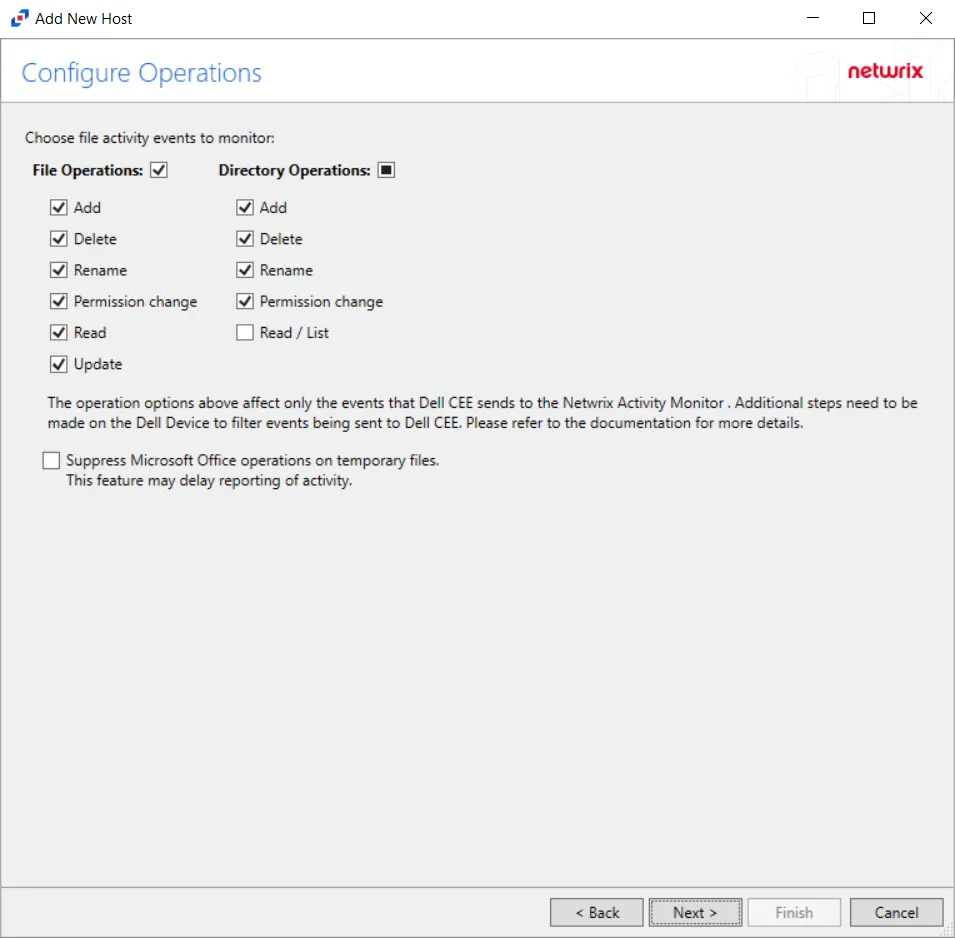
Step 5 – On the Configure Operations page, select the File Operations and Directory Operations to be monitored. Additional options include:
CAUTION: Suppress Microsoft Office operations on temporary files – Filters out events for Microsoft Office temporary files. When Microsoft Office files are saved or edited, many temporary files are created. With this option enabled, events for these temporary files are ignored. This feature may delay reporting of activity.
Click Next.
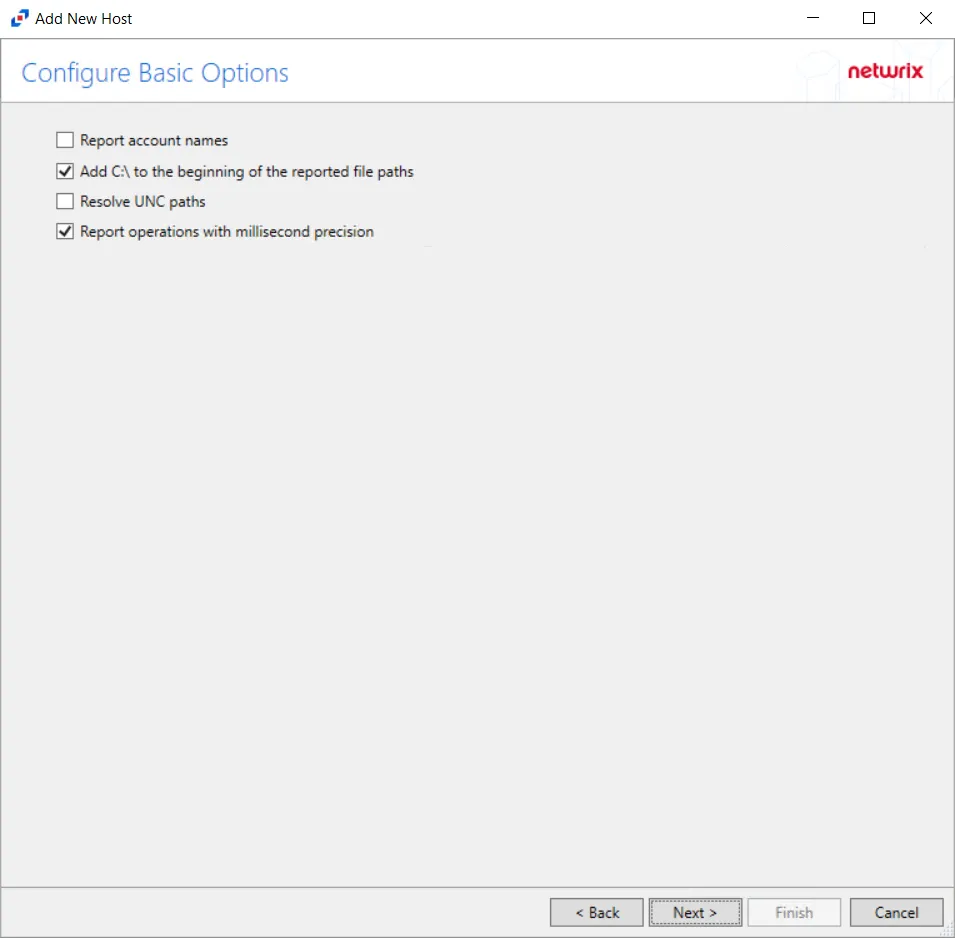
Step 6 – On the Configure Basic Options page, choose which settings to enable. The "Log files" are the activity logs created by the activity agent on the proxy host. Select the desired options:
- Report account names – Adds an Account Name column in the generated TSV files
- Add C:\ to the beginning of the reported file paths – Adds 'C:" to file paths to be displayed
like a Windows file path:
- Display example if checked – C:\Folder\file.txt
- Display example if unchecked – /Folder/file.text
- Resolve UNC paths – Adds a UNC Path column and a Rename UNC Path column in the generated
TSV files
- This option corresponds to the REPORT_UNC_PATH parameter in the INI file. It is disabled by
default. The UNC Path is in the following format:
- For CIFS activity – \[HOST][SHARE][PATH]
- Example CIFS activity – \ExampleHost\TestShare\DocTeam\Temp.txt
- For NFS activity – [HOST]:/[VOLUME]/[PATH]
- Example NFS activity – ExampleHost:/ExampleVolume/DocTeam/Temp.txt
- When the option is enabled, the added columns are populated when a file is accessed remotely through the UNC Path. If a file is accessed locally, these columns are empty. These columns have also been added as Syslog macros.
- When this option is selected, the user needs to provide credentials in the Auditing tab. If
credentials are not provided, the following warning message is displayed:
- Credentials are required for this feature. Provide the credentials in the Auditing tab.
- This option corresponds to the REPORT_UNC_PATH parameter in the INI file. It is disabled by
default. The UNC Path is in the following format:
- Report operations with millisecond precision – Changes the timestamps of events being recorded in the TSV log file for better ordering of events if multiple events occur within the same second
Click Next.
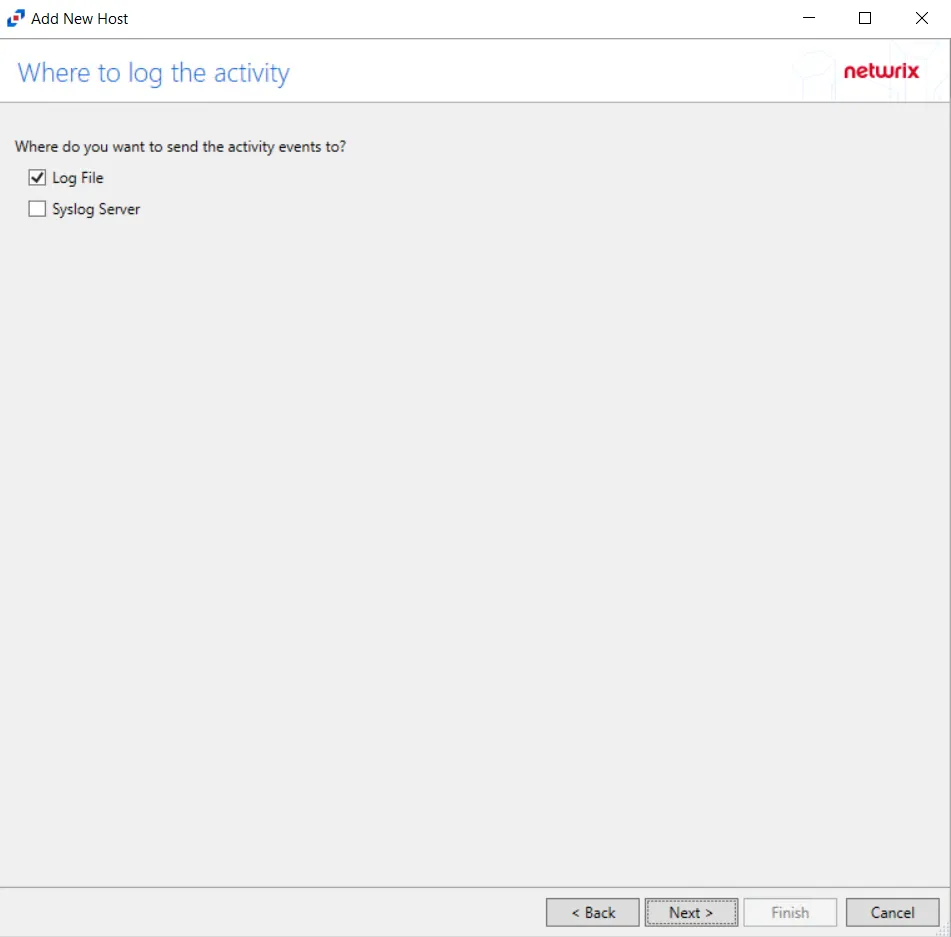
Step 7 – On the Where To Log The Activity page, select whether to send the activity to either a Log File or Syslog Server. Click Next.
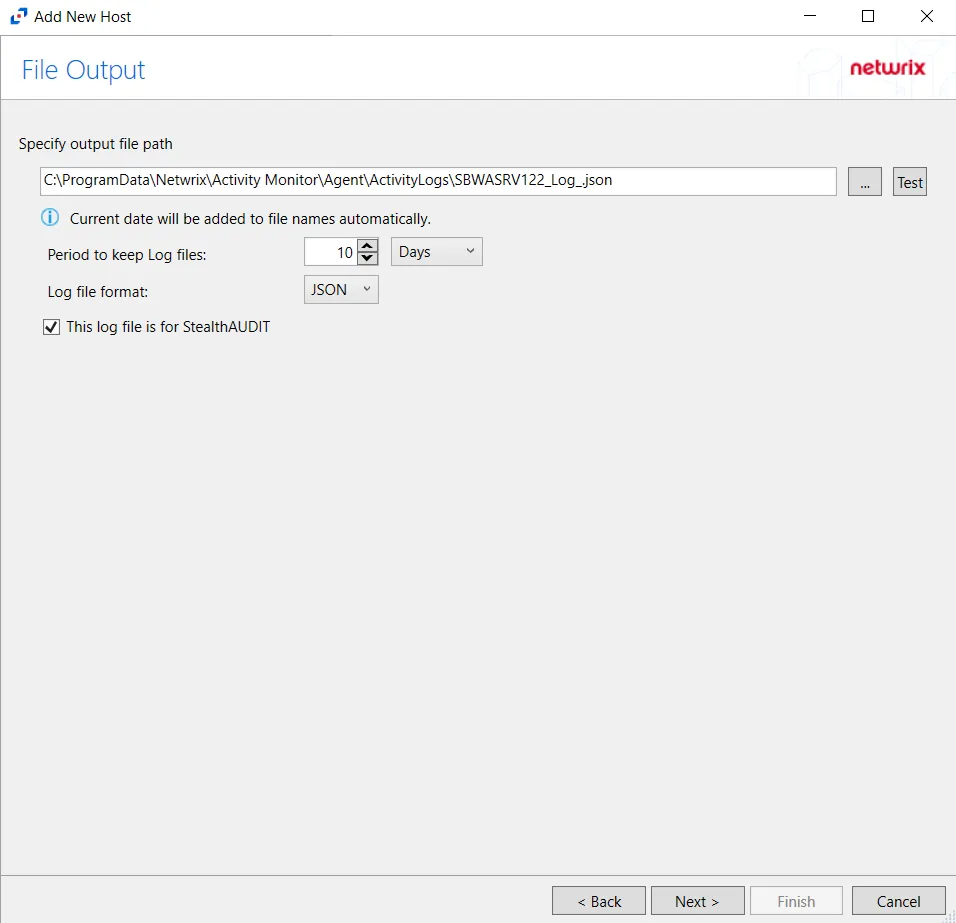
Step 8 – If Log File is selected on the Where To Log The Activity page, the File Output page can be configured.
-
Specify output file path – Specify the file path where log files are saved. Click the ellipses button (...) to open the Windows Explorer to navigate to a folder destination. Click Test to test if the path works.
-
Period to keep Log files – Log files will be deleted after the period entered number of days entered. The default is 10 days. Use the dropdown to specify whether to keep the Log files for a set amount of Minutes, Hours, or Days.
-
This log file is for Access Analyzer – Enable this option to have Access Analyzer collect this monitored host configuration
RECOMMENDED: Identify the configuration to be read by Netwrix Access Analyzer (formerly Enterprise Auditor) when integration is available.
- While the Activity Monitor can have multiple configurations per host, Access Analyzer can only read one of them.
-
Add header to Log files – Adds headers to TSV files. This is used to feed data into Splunk.
Click Next.
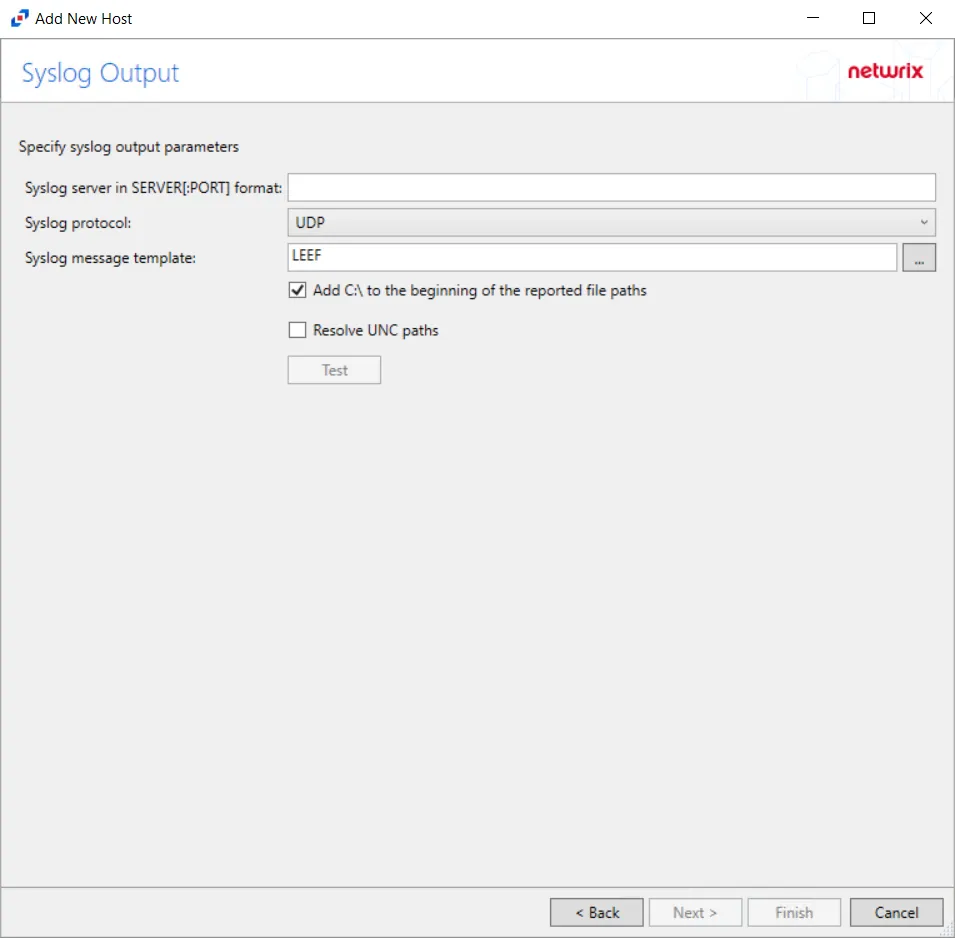
Step 9 – If Syslog Server is selected on the Where To Log The Activity page, the Syslog Output page can be configured.
-
Syslog server in SERVER[:PORT] format – Type the Syslog server name with a SERVER:Port format in the text box.
- The server name can be short name, fully qualified name (FQDN), or IP Address, as long as the organization's environment can resolve the name format used. The Event stream is the activity being monitored according to this configuration for the monitored host.
-
Syslog Protocol – Identify the Syslog protocol to be used for the Event stream. The drop-down menu includes:
- UDP
- TCP
- TLS
The TCP and TLS protocols add the Message framing drop-down menu. See the Syslog Tab topic for additional information.
-
Syslog message template – Click the ellipsis (…) to open the Syslog Message Template window. The following Syslog templates have been provided:
- AlienVault / Generic Syslog
- CEF – Incorporates the CEF message format
- HP Arcsight
- LEEF – Incorporates the LEEF message format
- LogRhythm
- McAfee
- QRadar – Use this template for IBM QRadar integration
- Splunk – Use this template for Splunk integration
- Threat Manager – Use this template for Threat Manager integration. This is the only supported template for Threat Manager. See the Netwrix Threat Manager Documentation for additional information.
- Custom templates can be created. Select the desired template or create a new template by modifying an existing template within the Syslog Message Template window. The new message template will be named Custom.
-
Add C:\ to the beginning of the reported file paths – Adds 'C:" to file paths to be displayed like a Windows file path:
- Display example if checked – C:\Folder\file.txt
- Display example if unchecked – /Folder/file.text
-
Resolve UNC paths – Adds a UNC Path column and a Rename UNC Path column in the generated TSV files
- This option corresponds to the REPORT_UNC_PATH parameter in the INI file. It is disabled by
default. The UNC Path is in the following format:
- For CIFS activity – \[HOST][SHARE][PATH]
- Example CIFS activity – \ExampleHost\TestShare\DocTeam\Temp.txt
- For NFS activity – [HOST]:/[VOLUME]/[PATH]
- Example NFS activity – ExampleHost:/ExampleVolume/DocTeam/Temp.txt
- When the option is enabled, the added columns are populated when a file is accessed remotely through the UNC Path. If a file is accessed locally, these columns are empty. These columns have also been added as Syslog macros.
- When this option is selected, the user needs to provide credentials in the Auditing tab. If
credentials are not provided, the following warning message is displayed:
- Credentials are required for this feature. Provide the credentials in the Auditing tab.
- This option corresponds to the REPORT_UNC_PATH parameter in the INI file. It is disabled by
default. The UNC Path is in the following format:
-
The Test button – Sends a test message to the Syslog server to check the connection. A green check mark or red will determine whether the test message has been sent or failed to send. Messages vary by Syslog protocol:
- UDP – Sends a test message and does not verify connection
- TCP/TLS – Sends test message and verifies connection
- TLS – Shows error if TLS handshake fails
See the Syslog Tab topic for additional information.
Click Finish.
The added Dell Celerra or VNX host is displayed in the Monitored Hosts table. Once a host has been added for monitoring, configure the desired ouptuts. See the Output for Monitored Hosts topic for additional information.
Host Properties for Dell Celerra or VNX
Configuration settings can be edited through the tabs in the host's Properties window. The configurable host properties are:
See the Host Properties Window topic for additional information.
Dell Isilon/PowerScale
Understanding File Activity Monitoring
The Activity Monitor can be configured to monitor the following:
- Ability to collect all or specific file activity for specific values or specific combinations of values
It provides the ability to feed activity data to SIEM products. The following dashboards have been specifically created for Activity Monitor event data:
- For IBM® QRadar®, see the Netwrix File Activity Monitor App for QRadar for additional information.
- For Splunk®, see the File Activity Monitor App for Splunk for additional information.
It also provides the ability to feed activity data to other Netwrix products:
- Netwrix Access Analyzer (formerly Enterprise Auditor)
- Netwrix Threat Prevention
- Netwrix Threat Manager
Prior to adding a Dell Isilon/PowerScale host to the Activity Monitor, the prerequisites for the target environment must be met. See the Dell Isilon/PowerScale Activity Auditing Configuration topic for additional information.
Remember, the Activity Agent must be deployed to a Windows server that acts as a proxy for monitoring the target environment.
Add Dell Isilon/PowerScale Host
Follow the steps to add a Dell Isilon/PowerScale host to be monitored.
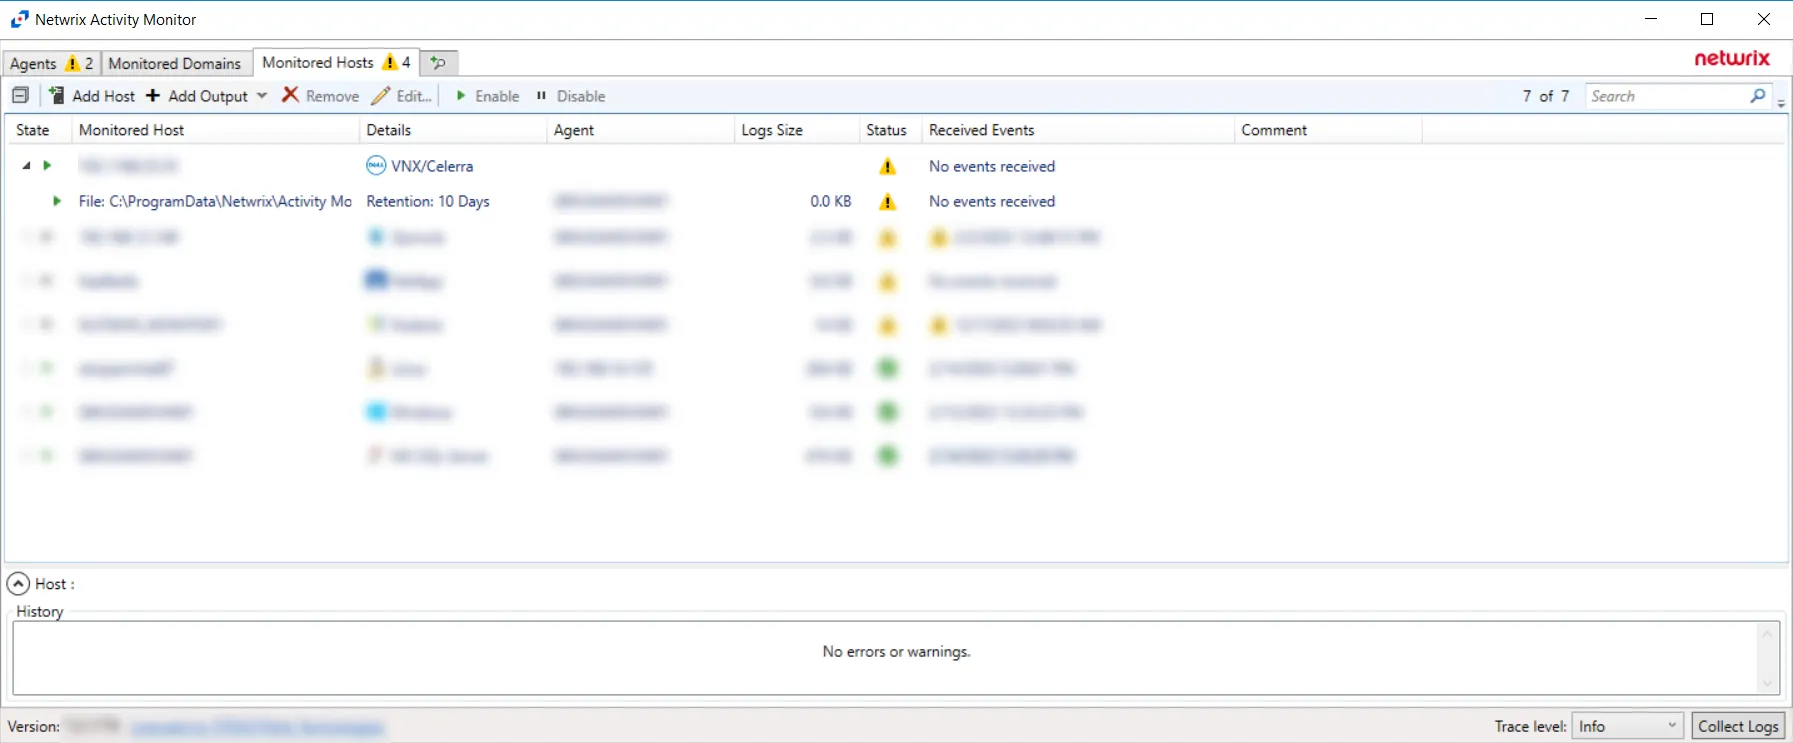
Step 1 – Navigate to the Monitored Hosts tab and click Add. The Add New Host window opens.
Step 2 – On the Choose Agent page, select the Agent to monitor the storage device. Click Next.
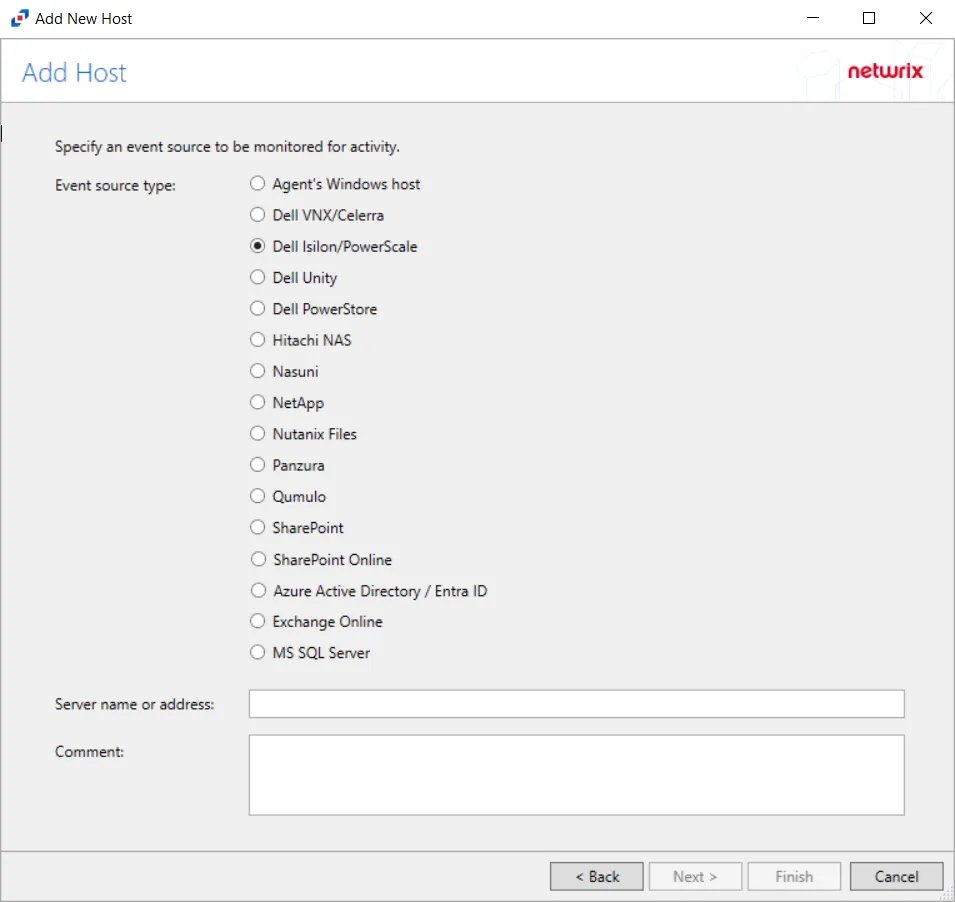
Step 3 – On the Add Host page, select the Dell Isilon radio button and enter both the Server name or address and the CIFS/NFS server name for the device. The CIFS/NFS server name can be left blank to collect activity from the Isilon cluster. If desired, add a Comment. Click Next.
NOTE: All Dell event source types must have the CEE Monitor Service installed on the agent in order to collect events. Activity Monitor will detect if the CEE Monitor is not installed and display a warning to install the service. If the CEE Monitor service is installed on a remote machine, manual configuration is required. See the Dell CEE Options Tab topic for additional information.
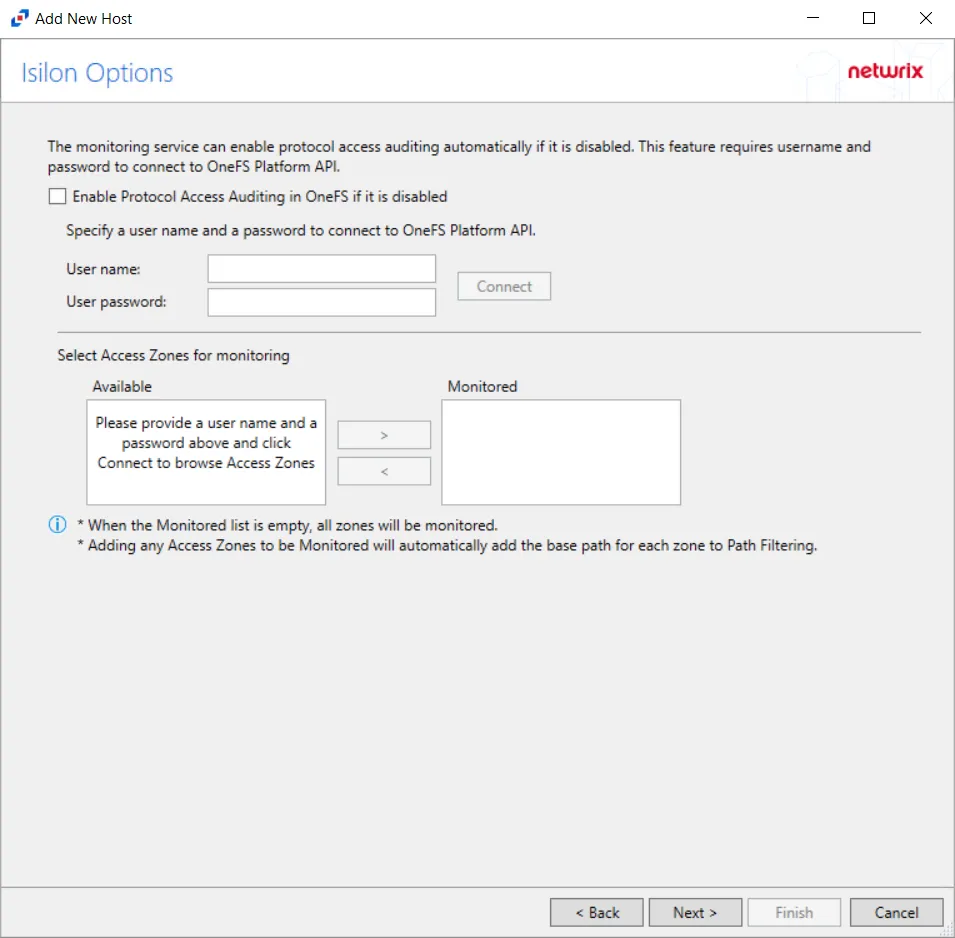
Step 4 – On the Isilon Options page, choose whether or not to automatically enable and configure auditing on the Isilon cluster. If a manual configuration has been completed, do not enable these options.
Follow these steps to use this automated option:
-
Check the Enable Protocol Access Auditing in OneFS if it is disabled box.
-
Enter the User name and User password to connect to the OneFS Platform API.
NOTE: The User name entered must be an Administrator account on the Dell Isilon device.
-
Click Connect to test the connection. If the connection is successful, discovered access zones is displayed in the Available box.
-
Access Zones:
-
By default, the Monitored box is left empty and all available access zones are monitored. All activity for the host is collected and placed in a single activity log file per day.
-
If access zones are selected, only those access zones are monitored and the activity is placed in a single activity log file per day.
- Use the arrow buttons to move the desired access zones to the Monitored box.
-
(Optional) Activity log files can be generated for each access zone. In order to generate one activity log file for each access zone, add only one access zone to this configuration of the monitored host. Then, add the host again for each access zone to be monitored. When adding an Isilon host for each access zone, the Dell device name will be the same for each configuration, but the CIFS/NFS server name must have a unique value.
NOTE: Although the Isilon Options page allows multiple access zones to be placed in the Monitored box for a single Isilon host, when generating separate activity log files for each access zones, Access Analyzer does not support this configuration. Access Analyzer integration requires all access zones to be monitored from a single configuration.
-
Click Next.
Step 5 – On the Protocols page, select which protocol to monitor. The list of protocols that can be monitored are All, CIFS, or NIFS. Click Next.
Step 6 – On the Configure Operations page, select the File Operations and Directory Operations options to be monitored. Additional options include:
CAUTION: Suppress Microsoft Office operations on temporary files – Filters out events for Microsoft Office temporary files. When Microsoft Office files are saved or edited, many temporary files are created. With this option enabled, events for these temporary files are ignored. This feature may delay reporting of activity.
Click Next.
Step 7 – On the Configure Basic Options page, choose which settings to enable. The “Log files” are the activity logs created by the activity agent on the proxy host. Select the desired options:
- Report account names – Adds an Account Name column in the generated TSV files
- Add C:\ to the beginning of the reported file paths – Adds ‘C:\” to file paths to be displayed
like a Windows file path:
- Display example if checked – C:\Folder\file.txt
- Display example if unchecked – /Folder/file.text
- Resolve UNC paths – Adds a UNC Path column and a Rename UNC Path column in the generated
TSV files
- This option corresponds to the REPORT_UNC_PATH parameter in the INI file. It is disabled by
default. The UNC Path is in the following format:
- For CIFS activity – \[HOST][SHARE][PATH]
- Example CIFS activity – \ExampleHost\TestShare\DocTeam\Temp.txt
- For NFS activity – [HOST]:/[VOLUME]/[PATH]
- Example NFS activity – ExampleHost:/ExampleVolume/DocTeam/Temp.txt
- When the option is enabled, the added columns are populated when a file is accessed remotely through the UNC Path. If a file is accessed locally, these columns are empty. These columns have also been added as Syslog macros.
- When this option is selected, the user needs to provide credentials in the Auditing tab. If
credentials are not provided, the following warning message is displayed:
- Credentials are required for this feature. Provide the credentials in the Auditing tab.
- This option corresponds to the REPORT_UNC_PATH parameter in the INI file. It is disabled by
default. The UNC Path is in the following format:
- Report operations with millisecond precision – Changes the timestamps of events being recorded in the TSV log file for better ordering of events if multiple events occur within the same second
Click Next.
Step 8 – On the Where To Log The Activity page, select whether to send the activity to either a Log File or Syslog Server. Click Next.
Step 9 – If Log File) is selected on the Where To Log The Activity page, the File Output page can be configured.
-
Specify output file path – Specify the file path where log files are saved. Click the ellipses button (...) to open the Windows Explorer to navigate to a folder destination. Click Test to test if the path works.
-
Period to keep Log files – Log files will be deleted after the period entered number of days entered. The default is 10 days. Use the dropdown to specify whether to keep the Log files for a set amount of Minutes, Hours, or Days.
-
This log file is for Access Analyzer – Enable this option to have Access Analyzer collect this monitored host configuration
RECOMMENDED: Identify the configuration to be read by Netwrix Access Analyzer (formerly Enterprise Auditor) when integration is available.
- While the Activity Monitor can have multiple configurations per host, Access Analyzer can only read one of them.
-
Add header to Log files – Adds headers to TSV files. This is used to feed data into Splunk.
Click Next.
Step 10 – If Syslog Server is selected on the Where To Log The Activity page, the Syslog Output page can be configured.
-
Syslog server in SERVER[:PORT] format – Type the Syslog server name with a SERVER:Port format in the text box.
- The server name can be short name, fully qualified name (FQDN), or IP Address, as long as the organization’s environment can resolve the name format used. The Event stream is the activity being monitored according to this configuration for the monitored host.
-
Syslog Protocol – Identify the Syslog protocol to be used for the Event stream. The drop-down menu includes:
- UDP
- TCP
- TLS
The TCP and TLS protocols add the Message framing drop-down menu. See the Syslog Tab topic for additional information.
-
Syslog message template – Click the ellipsis (…) to open the Syslog Message Template window. The following Syslog templates have been provided:
- AlienVault / Generic Syslog
- CEF – Incorporates the CEF message format
- HP Arcsight
- LEEF – Incorporates the LEEF message format
- LogRhythm
- McAfee
- QRadar – Use this template for IBM QRadar integration
- Splunk – Use this template for Splunk integration
- Threat Manager – Use this template for Threat Manager integration. This is the only supported template for Threat Manager. See the Netwrix Threat Manager Documentation for additional information.
- Custom templates can be created. Select the desired template or create a new template by modifying an existing template within the Syslog Message Template window. The new message template will be named Custom.
-
Add C:\ to the beginning of the reported file paths – Adds ‘C:\” to file paths to be displayed like a Windows file path:
- Display example if checked – C:\Folder\file.txt
- Display example if unchecked – /Folder/file.text
-
Resolve UNC paths – Adds a UNC Path column and a Rename UNC Path column in the generated TSV files
- This option corresponds to the REPORT_UNC_PATH parameter in the INI file. It is disabled by
default. The UNC Path is in the following format:
- For CIFS activity – \[HOST][SHARE][PATH]
- Example CIFS activity – \ExampleHost\TestShare\DocTeam\Temp.txt
- For NFS activity – [HOST]:/[VOLUME]/[PATH]
- Example NFS activity – ExampleHost:/ExampleVolume/DocTeam/Temp.txt
- When the option is enabled, the added columns are populated when a file is accessed remotely through the UNC Path. If a file is accessed locally, these columns are empty. These columns have also been added as Syslog macros.
- When this option is selected, the user needs to provide credentials in the Auditing tab. If
credentials are not provided, the following warning message is displayed:
- Credentials are required for this feature. Provide the credentials in the Auditing tab.
- This option corresponds to the REPORT_UNC_PATH parameter in the INI file. It is disabled by
default. The UNC Path is in the following format:
-
The Test button – Sends a test message to the Syslog server to check the connection. A green check mark or red will determine whether the test message has been sent or failed to send. Messages vary by Syslog protocol:
- UDP – Sends a test message and does not verify connection
- TCP/TLS – Sends test message and verifies connection
- TLS – Shows error if TLS handshake fails
See the Syslog Tab topic for additional information.
Click Finish.
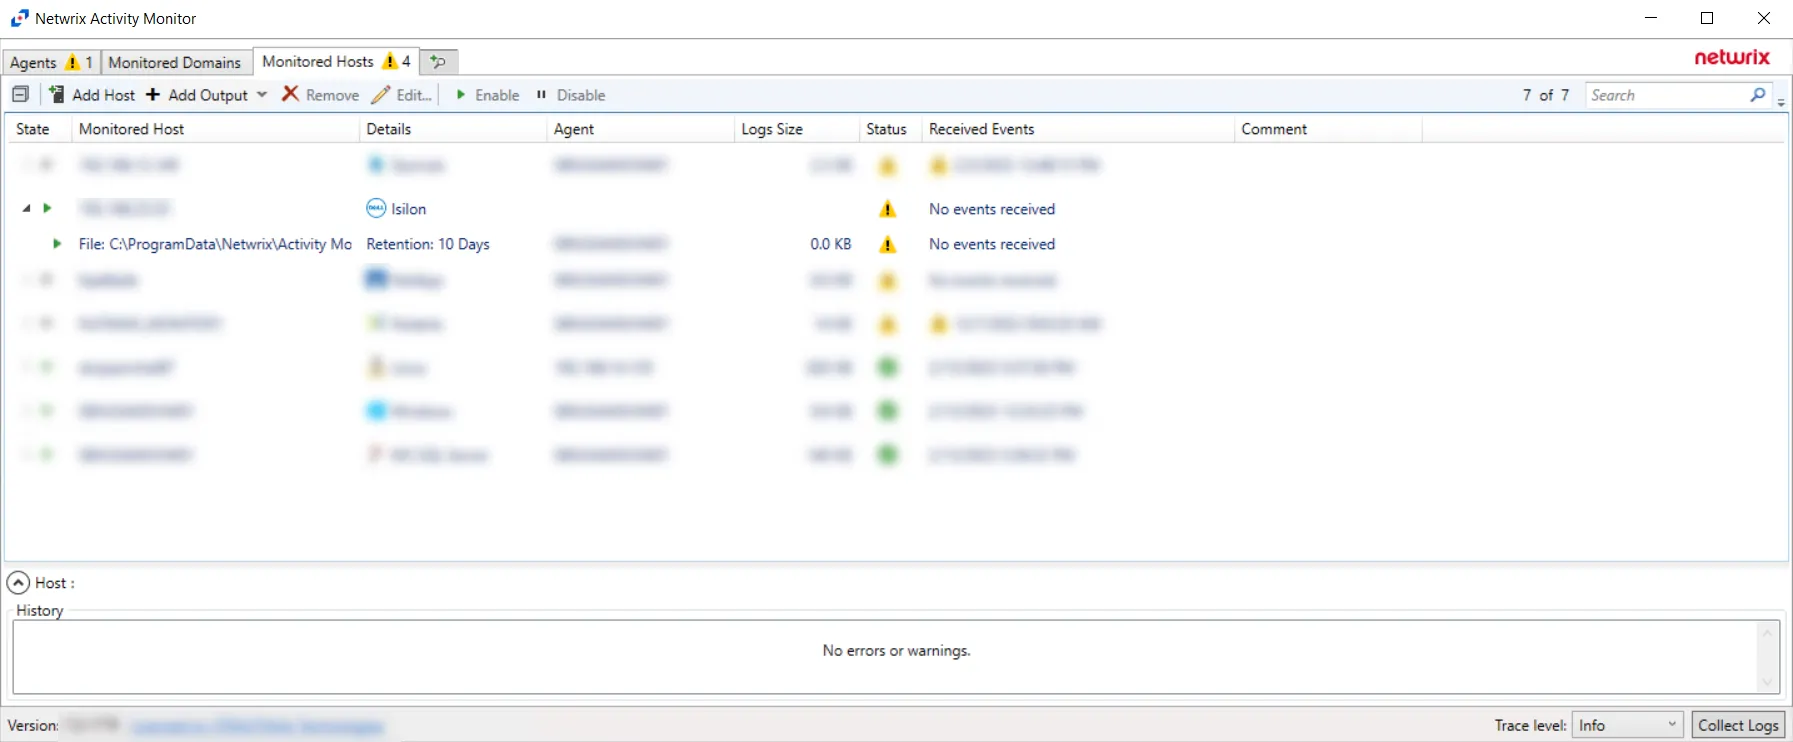
The added Dell Isilon/PowerScale host is displayed in the monitored hosts table. Once a host has been added for monitoring, configure the desired ouptuts. See the Output for Monitored Hosts topic for additional information.
Host Properties for Dell Isilon/PowerScale
Configuration settings can be edited through the tabs in the host’s Properties window. The configurable host properties are:
See the Host Properties Window topic for additional information.
Dell PowerStore
Understanding File Activity Monitoring
The Activity Monitor can be configured to monitor the following:
- Ability to collect all or specific file activity for specific values or specific combinations of values
It provides the ability to feed activity data to SIEM products. The following dashboards have been specifically created for Activity Monitor event data:
- For IBM® QRadar®, see the Netwrix File Activity Monitor App for QRadar for additional information.
- For Splunk®, see the File Activity Monitor App for Splunk for additional information.
It also provides the ability to feed activity data to other Netwrix products:
- Netwrix Threat Prevention
- Netwrix Threat Manager
Prior to adding a Dell PowerStore host to the Activity Monitor, the prerequisites for the target environment must be met. See the Dell PowerStore Activity Auditing Configuration topic for additional information.
Remember, the Activity Agent must be deployed to a Windows server that acts as a proxy for monitoring the target environment.
Add Dell PowerStore Host
Follow the steps to add a Dell PowerStore host to be monitored.
Step 1 – In Activity Monitor, go to the Monitored Hosts tab and click Add. The Add New Host window opens.
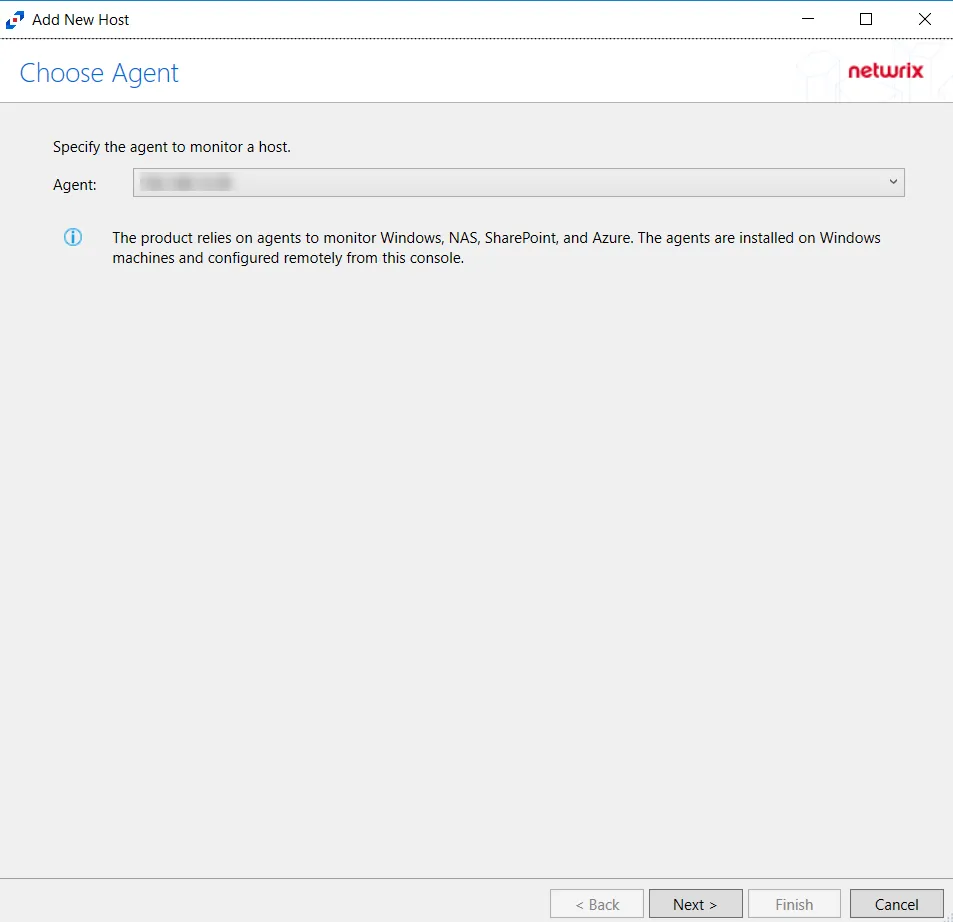
Step 2 – On the Choose Agent page, select the Agent to monitor the file server. ClickNext.
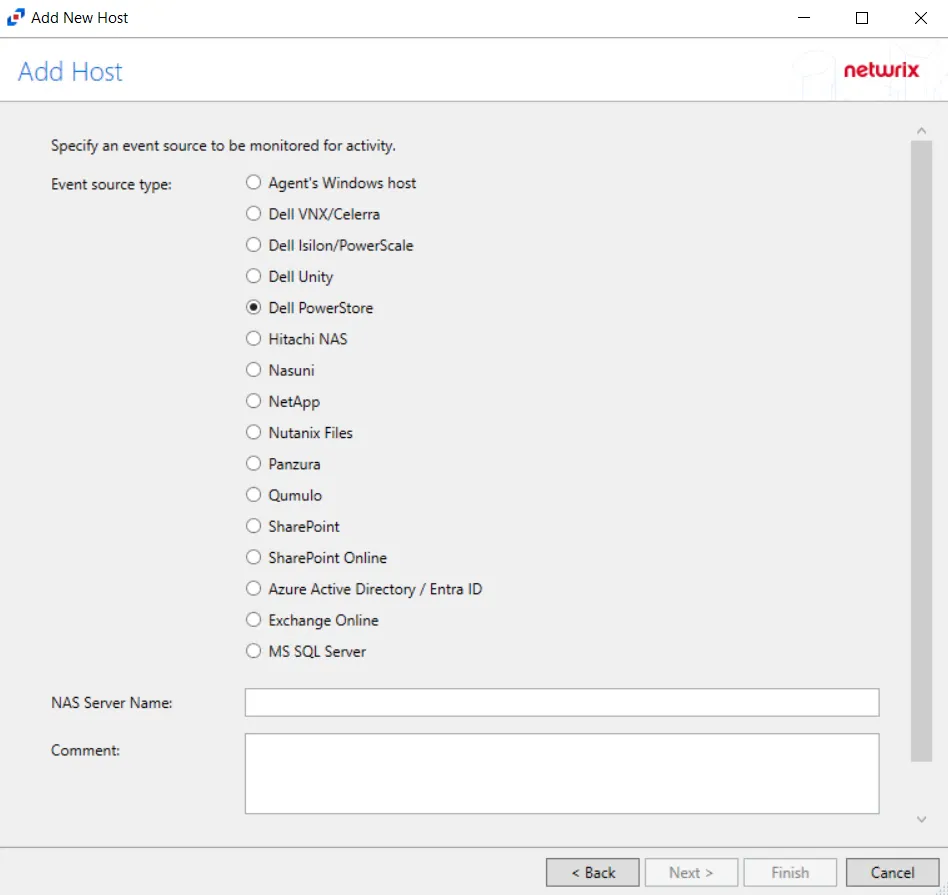
Step 3 – On the Add Host page, select the Dell PowerStore radio button and enter the file server name. Click Next.
NOTE: All Dell event source types must have the CEE Monitor Service installed on the agent in order to collect events. Activity Monitor will detect if the CEE Monitor is not installed and display a warning to install the service. If the CEE Monitor service is installed on a remote machine, manual configuration is required. See the Dell CEE Options Tab topic for additional information.

Step 4 – On the Protocols page, specify the protocols to monitor. The list of protocols that can be monitored are, All, CIFS, or NFS. Once a protocol is selected, click Next.
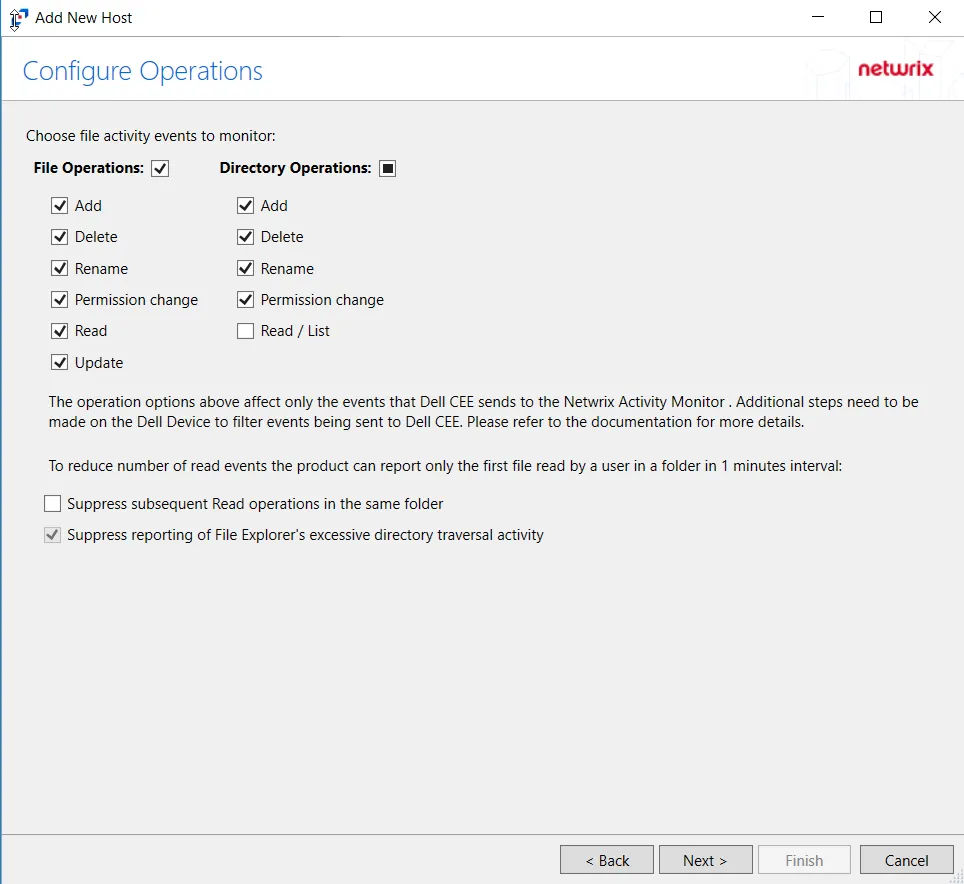
Step 5 – On the Configure Operations page, select the File Operations and Directory Operations to be monitored.
- Suppress reporting of File Explorer's excessive directory traversal activity – Filters out events of excessive directory traversal in File Explorer.
Click Next.
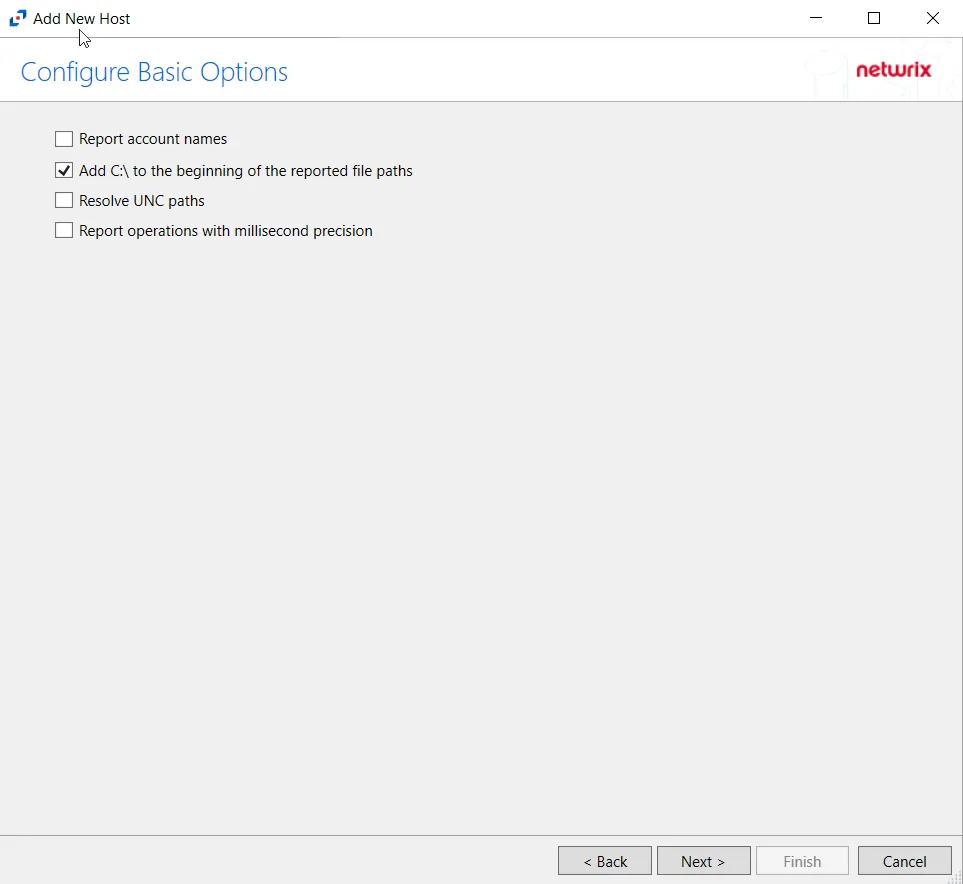
Step 6 – On the Configure Basic Operations page, choose which settings to enable. Select one of the following options:
- Report account names – Adds an Account Name column in the generated TSV files.
- Add C:\ to the beginning of the reported file paths – Adds ‘C:\” to file paths to be displayed
like a Windows file path:
- Display example if checked – C:\Folder\file.txt
- Display example if unchecked – /Folder/file.text
- Report UNC paths – Adds a UNC Path column and a Rename UNC Path column in the generated TSV files
- This option corresponds to the REPORT_UNC_PATH parameter in the INI file. It is disabled by
default. The UNC Path is in the following format:
- For CIFS activity –
\\[HOST]\[SHARE]\[PATH] - Example CIFS activity –
\\ExampleHost\TestShare\DocTeam\Temp.txt - For NFS activity –
[HOST]:/[VOLUME]/[PATH] - Example NFS activity –
ExampleHost:/ExampleVolume/DocTeam/Temp.txt
- For CIFS activity –
- When the option is enabled, the added columns are populated when a file is accessed remotely through the UNC Path. These columns have also been added as Syslog macros.
- This option corresponds to the REPORT_UNC_PATH parameter in the INI file. It is disabled by
default. The UNC Path is in the following format:
- Report operations with millisecond precision – Changes the timestamps of events being recorded in the TSV log file for better ordering of events if multiple events occur within the same second.
Click Next.
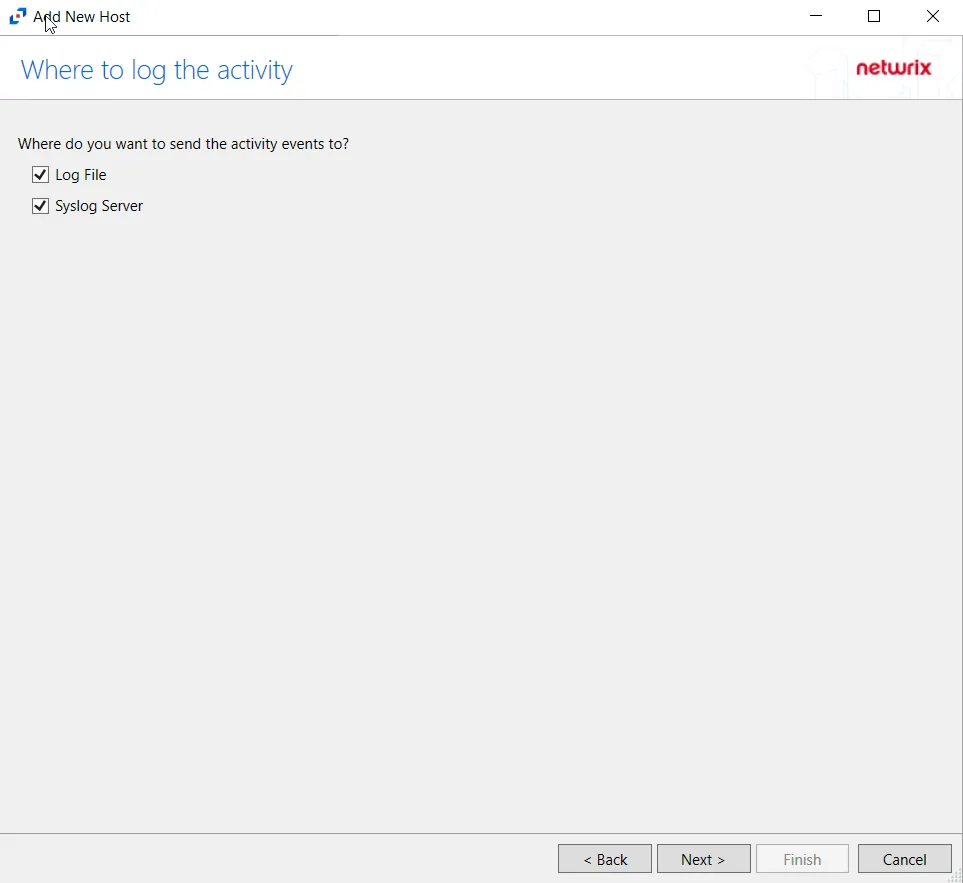
Step 7 – On the Where to log the activity page, select whether to send the activity to either a Log File or Syslog Server. Click Next.
NOTE: An option must be selected before moving to the next step.
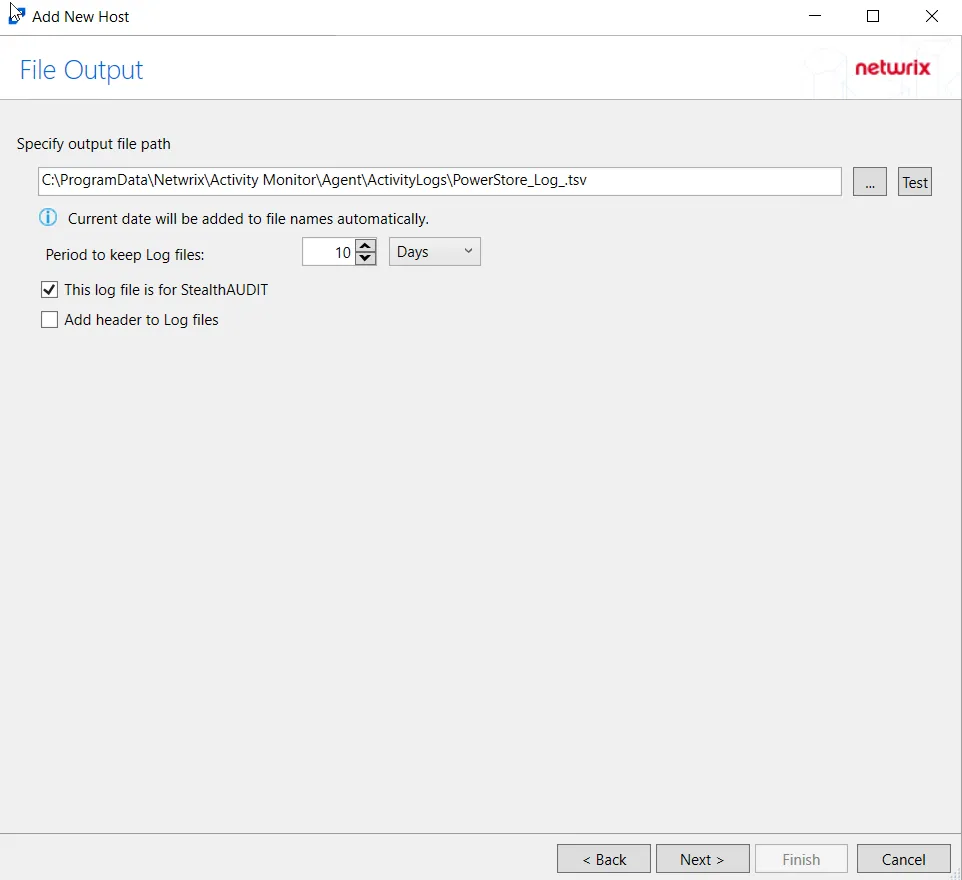
Step 8 – If Log File is selected on the Where To Log The Activity page, the File Output page can be configured.
-
Specify output file path – Specify the file path where TSV log files are saved on the agent's server. Click the ellipses button (...) to open the Windows Explorer to navigate to a folder destination. Click Test to test if the path works.
-
Period to keep Log files – Log files will be deleted after the period entered as the number of days elapses. The default is 10 days. Use the dropdown to specify whether to keep the Log files for a set amount of Minutes, Hours, or Days. This retention setting applies both to the local files on the agent's server and to the archived files.
-
This log file is for Access Analyzer – Enable this option to have Access Analyzer collect this monitored host configuration
RECOMMENDED: Identify the configuration to be read by Access Analyzer when integration is available.
NOTE: While Activity Monitor can have multiple configurations for log file outputs per host, Access Analyzer can only read one of them.
-
Add header to Log files – Adds headers to TSV files. This is used to feed data into Splunk.
NOTE: Access Analyzer does not support log files with the header.
Click Next.
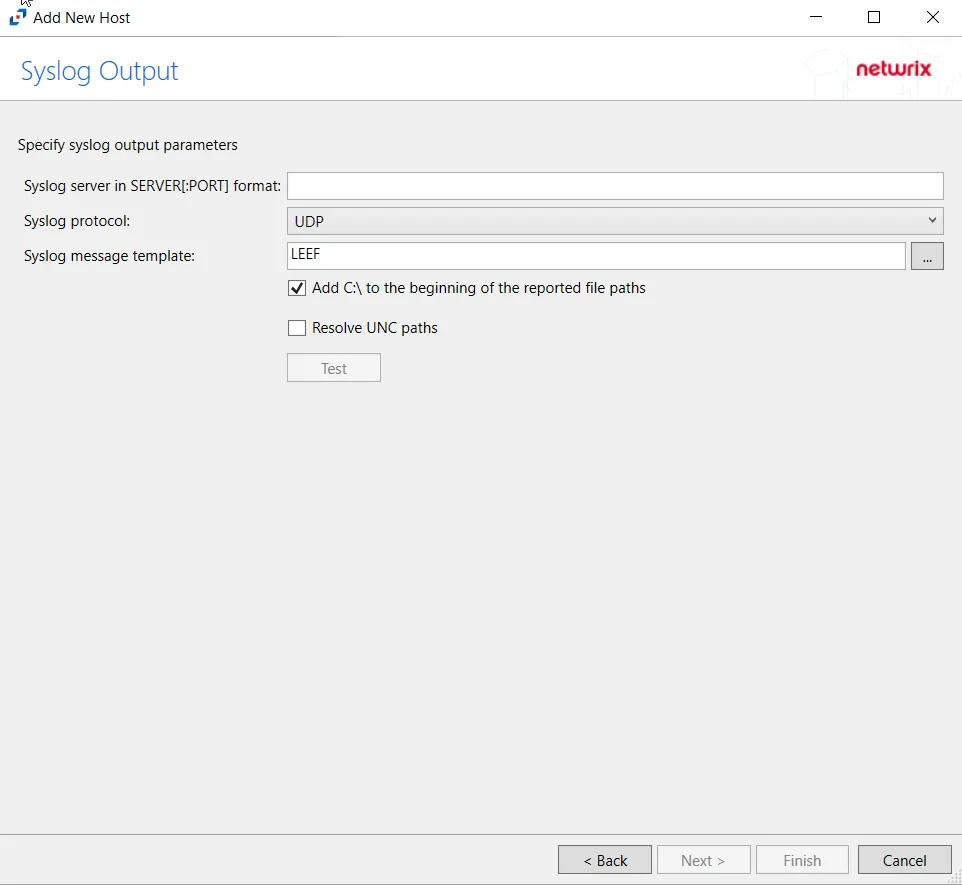
Step 9 – If Syslog Server is selected on the Where To Log The Activity page, the Syslog Output page can be configured.
-
Syslog server in SERVER[:PORT] format – Type the Syslog server name with a SERVER:Port format in the textbox.
- The server name can be short name, fully qualified name (FQDN), or IP Address, as long as the organization’s environment can resolve the name format used.
-
Syslog Protocol – Identify the Syslog protocol to be used for the Event stream. The drop-down menu includes:
- UDP
- TCP
- TLS
The TCP and TLS protocols add the Message framing drop-down menu. See the Syslog Tab topic for additional information.
-
The Test button sends a test message to the Syslog server to check the connection. A green check mark or red will determine whether the test message has been sent or failed to send. Messages vary by Syslog protocol:
- UDP – Sends a test message and does not verify connection
- TCP/TLS – Sends test message and verifies connection
- TLS – Shows error if TLS handshake fails
See the Syslog Tab topic for additional information.
Click Finish.
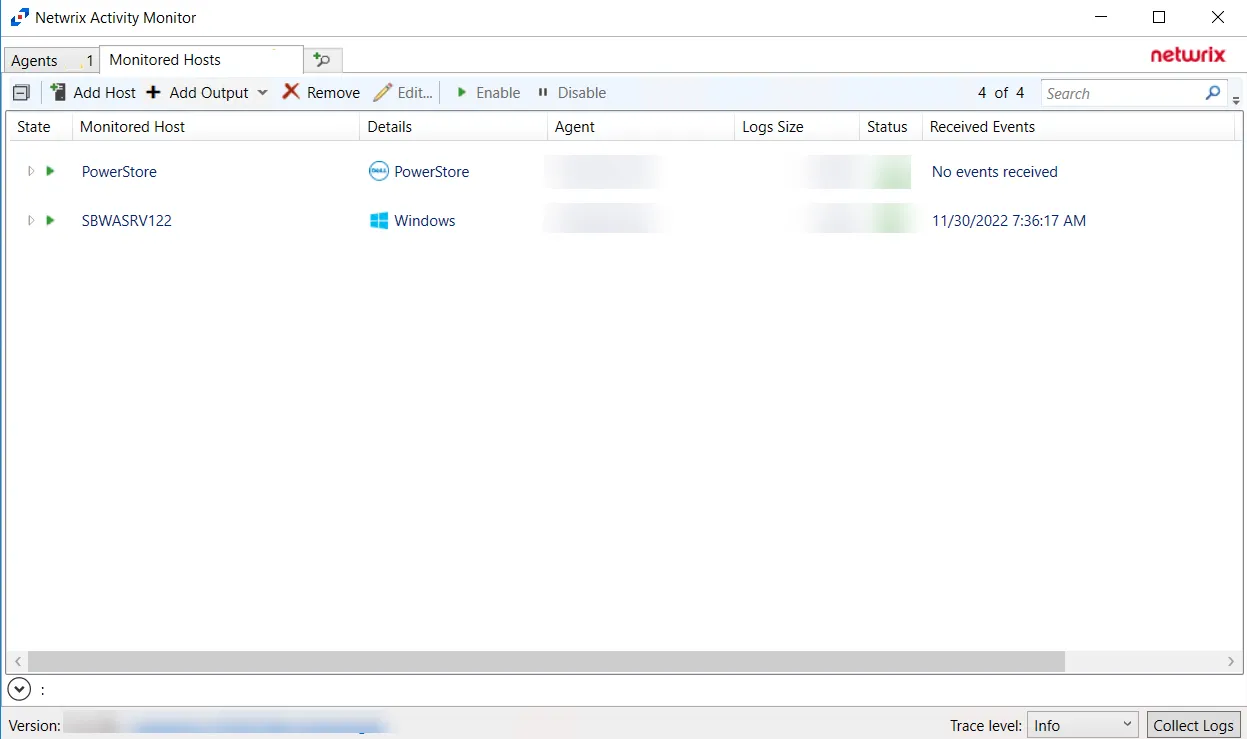
The added Dell PowerStore host is displayed in the monitored hosts table. Once a host has been added for monitoring, configure the desired ouptuts. See the Output for Monitored Hosts topic for additional information.
Host Properties for Dell PowerStore
Configuration settings can be edited through the tabs in the host’s Properties window. The configurable host properties are:
See the Host Properties Window topic for additional information.
Dell Unity
Understanding File Activity Monitoring
The Activity Monitor can be configured to monitor the following:
- Ability to collect all or specific file activity for specific values or specific combinations of values
It provides the ability to feed activity data to SIEM products. The following dashboards have been specifically created for Activity Monitor event data:
- For IBM® QRadar®, see the Netwrix File Activity Monitor App for QRadar for additional information.
- For Splunk®, see the File Activity Monitor App for Splunk for additional information.
It also provides the ability to feed activity data to other Netwrix products:
- Netwrix Access Analyzer (formerly Enterprise Auditor)
- Netwrix Threat Prevention
- Netwrix Threat Manager
Prior to adding a Dell Unity host to the Activity Monitor, the prerequisites for the target environment must be met. See the Dell Unity Activity Auditing Configuration topic for additional information.
Remember, the Activity Agent must be deployed to a Windows server that acts as a proxy for monitoring the target environment.
Add Dell VNX/Celerra Host
Follow the steps to add a Dell Unity host to be monitored.
Step 1 – In Activity Monitor, go to the Monitored Hosts tab and click Add. The Add New Host window opens.
Step 2 – On the Choose Agent page, select the Agent to monitor the storage device.

Step 3 – On the Add Host page, select the Dell Unity radio button and enter the NAS Server Name for the device. If desired, add a Comment. Click Next.
NOTE: All Dell event source types must have the CEE Monitor Service installed on the agent in order to collect events. Activity Monitor will detect if the CEE Monitor is not installed and display a warning to install the service. If the CEE Monitor service is installed on a remote machine, manual configuration is required. See the Dell CEE Options Tab topic for additional information.
Step 4 – On the Protocols page, select which protocols to monitor. The protocols that can be monitored are All, CIFS, or NIFS. Click Next.
Step 5 – On the Configure Operations page, select the File Operations and Directory Operations to be monitored. Additional options include:
CAUTION: Suppress Microsoft Office operations on temporary files – Filters out events for Microsoft Office temporary files. When Microsoft Office files are saved or edited, many temporary files are created. With this option enabled, events for these temporary files are ignored. This feature may delay reporting of activity.
Click Next.
Step 6 – On the Configure Basic Options page, choose which settings to enable. The “Log files” are the activity logs created by the activity agent on the proxy host. Select the desired options:
- Report account names – Adds an Account Name column in the generated TSV files
- Add C:\ to the beginning of the reported file paths – Adds ‘C:\” to file paths to be displayed
like a Windows file path:
- Display example if checked – C:\Folder\file.txt
- Display example if unchecked – /Folder/file.text
- Resolve UNC paths – Adds a UNC Path column and a Rename UNC Path column in the generated
TSV files
- This option corresponds to the REPORT_UNC_PATH parameter in the INI file. It is disabled by
default. The UNC Path is in the following format:
- For CIFS activity – \[HOST][SHARE][PATH]
- Example CIFS activity – \ExampleHost\TestShare\DocTeam\Temp.txt
- For NFS activity – [HOST]:/[VOLUME]/[PATH]
- Example NFS activity – ExampleHost:/ExampleVolume/DocTeam/Temp.txt
- When the option is enabled, the added columns are populated when a file is accessed remotely through the UNC Path. If a file is accessed locally, these columns are empty. These columns have also been added as Syslog macros.
- When this option is selected, the user needs to provide credentials in the Auditing tab. If
credentials are not provided, the following warning message is displayed:
- Credentials are required for this feature. Provide the credentials in the Auditing tab.
- This option corresponds to the REPORT_UNC_PATH parameter in the INI file. It is disabled by
default. The UNC Path is in the following format:
- Report operations with millisecond precision – Changes the timestamps of events being recorded in the TSV log file for better ordering of events if multiple events occur within the same second
Click Next.
Step 7 – On the Where To Log The Activity page, select whether to send the activity to either a Log File or Syslog Server. Click Next.
Step 8 – If Log File is selected on the Where To Log The Activity page, the File Output page can be configured.
-
Specify output file path – Specify the file path where log files are saved. Click the ellipses button (...) to open the Windows Explorer to navigate to a folder destination. Click Test to test if the path works.
-
Period to keep Log files – Log files will be deleted after the period entered number of days entered. The default is 10 days. Use the dropdown to specify whether to keep the Log files for a set amount of Minutes, Hours, or Days.
-
This log file is for Access Analyzer – Enable this option to have Access Analyzer collect this monitored host configuration
RECOMMENDED: Identify the configuration to be read by Netwrix Access Analyzer (formerly Enterprise Auditor) when integration is available.
- While the Activity Monitor can have multiple configurations per host, Access Analyzer can only read one of them.
-
Add header to Log files – Adds headers to TSV files. This is used to feed data into Splunk.
Click Next.
Step 9 – If Syslog Server is selected on the Where To Log The Activity page, the Syslog Output page can be configured.
-
Syslog server in SERVER[:PORT] format – Type the Syslog server name with a SERVER:Port format in the text box.
- The server name can be short name, fully qualified name (FQDN), or IP Address, as long as the organization’s environment can resolve the name format used. The Event stream is the activity being monitored according to this configuration for the monitored host.
-
Syslog Protocol – Identify the Syslog protocol to be used for the Event stream. The drop-down menu includes:
- UDP
- TCP
- TLS
The TCP and TLS protocols add the Message framing drop-down menu. See the Syslog Tab topic for additional information.
-
Syslog message template – Click the ellipsis (…) to open the Syslog Message Template window. The following Syslog templates have been provided:
- AlienVault / Generic Syslog
- CEF – Incorporates the CEF message format
- HP Arcsight
- LEEF – Incorporates the LEEF message format
- LogRhythm
- McAfee
- QRadar – Use this template for IBM QRadar integration
- Splunk – Use this template for Splunk integration
- Threat Manager – Use this template for Threat Manager integration. This is the only supported template for Threat Manager. See the Netwrix Threat Manager Documentation for additional information.
- Custom templates can be created. Select the desired template or create a new template by modifying an existing template within the Syslog Message Template window. The new message template will be named Custom.
-
Add C:\ to the beginning of the reported file paths – Adds ‘C:\” to file paths to be displayed like a Windows file path:
- Display example if checked – C:\Folder\file.txt
- Display example if unchecked – /Folder/file.text
-
Resolve UNC paths – Adds a UNC Path column and a Rename UNC Path column in the generated TSV files
- This option corresponds to the REPORT_UNC_PATH parameter in the INI file. It is disabled by
default. The UNC Path is in the following format:
- For CIFS activity – \[HOST][SHARE][PATH]
- Example CIFS activity – \ExampleHost\TestShare\DocTeam\Temp.txt
- For NFS activity – [HOST]:/[VOLUME]/[PATH]
- Example NFS activity – ExampleHost:/ExampleVolume/DocTeam/Temp.txt
- When the option is enabled, the added columns are populated when a file is accessed remotely through the UNC Path. If a file is accessed locally, these columns are empty. These columns have also been added as Syslog macros.
- When this option is selected, the user needs to provide credentials in the Auditing tab. If
credentials are not provided, the following warning message is displayed:
- Credentials are required for this feature. Provide the credentials in the Auditing tab.
- This option corresponds to the REPORT_UNC_PATH parameter in the INI file. It is disabled by
default. The UNC Path is in the following format:
-
The Test button – Sends a test message to the Syslog server to check the connection. A green check mark or red will determine whether the test message has been sent or failed to send. Messages vary by Syslog protocol:
- UDP – Sends a test message and does not verify connection
- TCP/TLS – Sends test message and verifies connection
- TLS – Shows error if TLS handshake fails
See the Syslog Tab topic for additional information.
Click Finish.
The added Dell Unity host is displayed in the monitored hosts table. Once a host has been added for monitoring, configure the desired ouptuts. See the Output for Monitored Hosts topic for additional information.
Host Properties for Dell Unity
Configuration settings can be edited through the tabs in the host’s Properties window. The configurable host properties are:
See the Host Properties Window topic for additional information.
Dell Tab
The Dell tab on a host’s Properties window displays the Dell Celerra/VNX, Dell Isilon/PowerScale, Dell PowerStore, or Dell Unity host to be monitored for activity and any host aliases. This tab is populated with the information entered when the Dell host is added to the monitored hosts table. If desired, specify a different device to be monitored for activity.
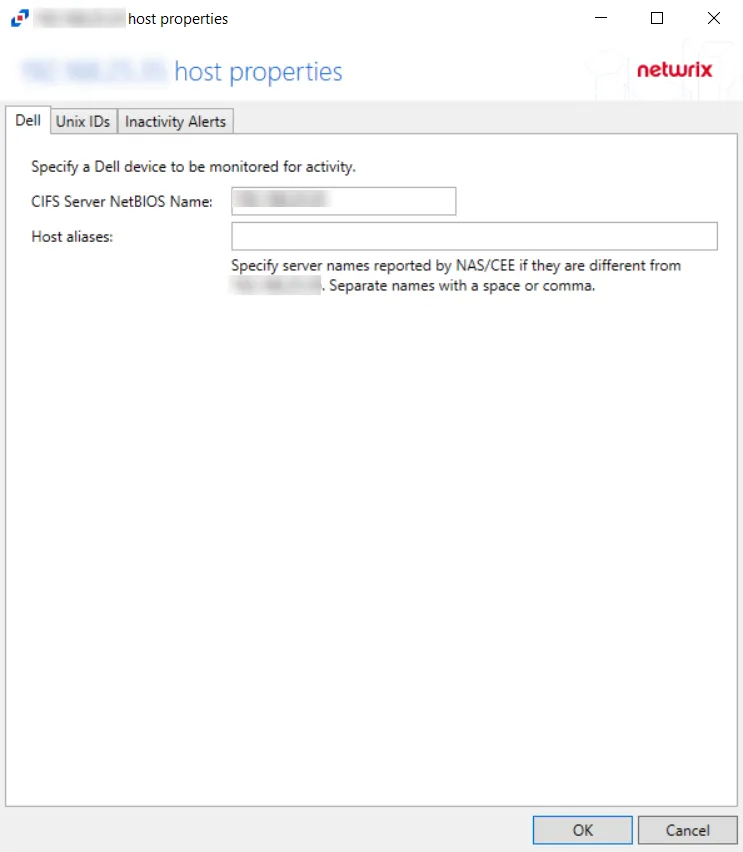
If changes are made to these configuration options, click OK to save the changes.