CTERA Activity Auditing Configuration
The Netwrix Activity Monitor can be configured to monitor file system activity on CTERA Edge Filer appliances.
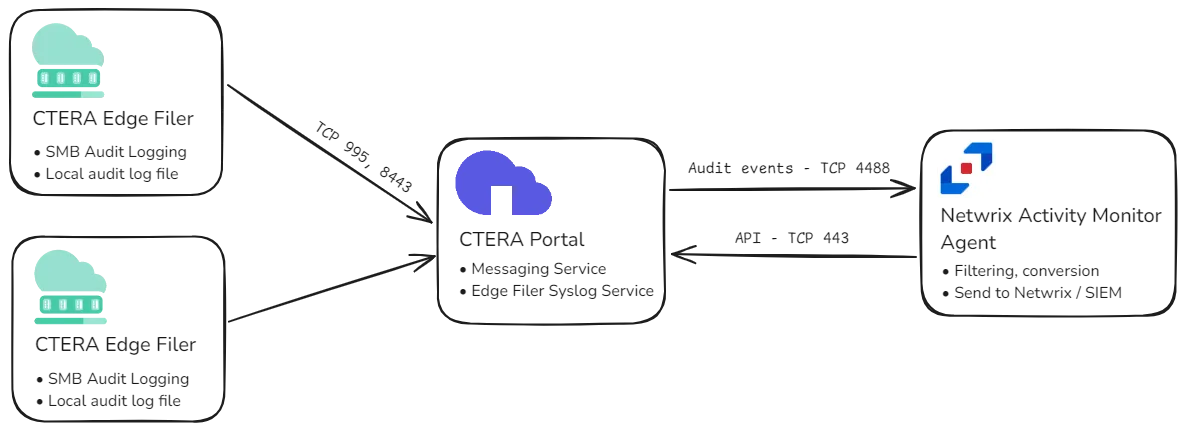
The monitoring process relies on the SMB auditing feature of the CTERA Edge Filer. A local audit log file is generated by each Edge Filer and audit events from these files are collected by the CTERA Portal. The CTERA Portal forwards the events from the Edge Filers to the Activity Monitor Agent through the Messaging and Syslog services.
To prepare CTERA for monitoring:
- Provision an account.
- Enable auditing on the CTERA Edge Filer.
- Enable Messaging and Edge Filer Syslog services on the CTERA Portal.
Provision Account
Netwrix Activity Monitor uses the CTERA Portal API to retrieve information about portals, Edge Filers, their auditing configurations, and optionally to enable syslog forwarding automatically. To access the API, Activity Monitor requires an account in the CTERA Portal with the Read Only Administrator role.
Step 1 – Log in to the CTERA Portal web interface. In the global administration view, select Users > Administrators.
Step 2 – Click New Admin, specify a username, password, email, and the Read Only Administrator role.
This credential will then be used when configuring the Activity Monitor Agent to monitor the CTERA portal.
Enable Auditing on CTERA Edge Filer
The CTERA Edge Filer can generate audit log events for the SMB access. Audit events are stored in a local file and then forwarded to the CTERA Portal for further processing. The audit log is disabled by default and must be enabled.
Follow the steps to enable SMB audit logs.
Step 1 – Log in to the Edge Filer web interface. In the Configuration view, select Logs > Audit Logs.
Step 2 – Select the Enable CIFS/SMB Audit Logs option.
Step 3 – Specify a share to save the audit logs in the Save log files option. If a share does not exist, create a new one first.
NOTE: CTERA recommends that SMB Audit logging is saved to a folder that is local on the Edge Filer and not synced to the cloud. For example, in the root of vol1, which can then be used to create a share.
Step 4 – Adjust the Keep closed files for parameter. Otherwise, use the default value.
Step 5 – Check all events except the Read Extended Attributes event in Events to log list. If you do not require monitoring of Directory Read/List operations, which typically generate a high volume of data, uncheck the List Folder Read Data event.
Step 6 – Make sure that Log permission changes in human readable format is unchecked.
Step 7 – Click Save.
To verify that the auditing is enabled, generate some file activity and check the share specified in
Step 3. An audit log should be created in audit.log.dir/audit.log.
See the Auditing SMB File Access article in the CTERA Edge Filer Administrator Guide for additional information.
Enable Services on CTERA Portal
The following services must be enabled and configured on the CTERA Portal:
- CTERA Messaging Service -– Enables sending notifications to various consumers, including the Edge Filer Syslog service.
- CTERA Edge Filer Syslog Service – Consolidates audit events from Edge Filers and sends them to the Activity Monitor Agent and other consumers.
Both services are disabled by default and must be enabled. The Messaging service must be enabled first.
Enable the Messaging Service
See the Managing the CTERA Messaging Service article in the CTERA Portal Global Administrator Guide for additional information on requirements and recommendations for production and POC environments.
Step 1 – Before setting up the Messaging Service in the web interface, first initialize the messaging components with the following CLI command:
set /settings/platformServicesSetting/enabled true
Initialization takes a few minutes.
Step 2 – Log in to the CTERA Portal web interface. In the global administration view, select Services > Messaging.
Step 3 – To add a new messaging server, click Add Messaging Servers. Select the servers to use as messaging servers. Click Save.
NOTE: In a production environment, designate three servers as messaging servers. In a small or
test environment, CTERA supports using a single messaging server, typically the main database
server. However, in all other cases, exactly three servers must be assigned as messaging servers.
See the
Managing the CTERA Messaging Service
article for additional information.
Step 4 – Deploying the messaging service takes a few minutes. The status will change to STARTING and then to ACTIVE. Wait until the status is ACTIVE before proceeding to the next step.
NOTE: If the status does not change to ACTIVE, the log files need to be collected from
/usr/local/lib/ctera/work/logs/services directory.
See the
CTERA Messaging Service Logs
article for additional information.
Enable the Edge Filer Syslog Service
Ensure the Enable the Messaging Service section is completed before proceeding to enable the Syslog Service.
The Edge Filer Syslog Service can be configured in two ways:
- Automatically by the Activity Monitor using the API from CTERA Portal.
- Manually using the CTERA Portal web interface.
It is recommended to configure the service automatically. With automatic configuration, the Activity Monitor Agent will apply the settings and perform periodic checks to ensure correctness. To enable automatic configuration, use the Enable Edge Filer Syslog auditing option in the host properties and specify credentials to access the CTERA Portal API.
Follow the steps to configure the Edge Filer Syslog Service manually.
Step 1 – Configure monitoring of the CTERA Portal in the Activity Monitor Console.
Step 2 – Add a CTERA host on the Monitored Hosts page and specify the portal host name, username, password, and complete the wizard.
Step 3 – Enable the newly added host.
Step 4 – Copy a TLS certificate file, certca.pem, from
%ProgramData%\Netwrix\Activity Monitor\Agent\Data folder on the agent's server.
Step 5 – Log in to the CTERA Portal web interface. In the global administration view, select Services > Edge Filer Syslog.
Step 6 – Click Add a Server.
Step 7 – Specify the FQDN of the agent or IP address in the Addressfield.
Step 8 – Specify 4488 in the Port field.
NOTE: The default port can be changed in the properties of the agent on the CTERA page.
Step 9 – Change the protocol to TCP/TLS.
Step 10 – Click Server Certificate > Select File to upload the file collected at Step 2.
Step 11 – Click Save.
Step 12 – Click Enable in the status bar.
The status will change to STARTING. If the CTERA Portal manages to connect to the Activity Monitor Agent, the status changes to ACTIVE. If not, review the error message and check Logs & Alerts > System Log for details.
See the Managing the Edge Filer Syslog Service article in the CTERA Portal Global Administrator Guide for additional information.
Nasuni Edge Appliance Activity Auditing Configuration
Generation of an API Access Key is required for Nasuni activity monitoring. The Nasuni Edge Appliance generates its own audit trail. An API Access Key is used by the Activity Monitor to form a network connection to the appliance. Nasuni will then stream event data to the activity agent. See Nasuni Support Documentation for additional information.
Configuration Checklist
Complete the following checklist prior to configuring activity monitoring of Nasuni Edge Appliances. Instructions for each item of the checklist are detailed within the following topics.
Checklist Item 1: Generate Nasuni API Access Key
-
Generate an API Access Key for each Nasuni Edge Appliance to be monitored through one of the following:
- Nasuni Filer Management Interface
- Nasuni Management Console
Checklist Item 2: Activity Monitor Configuration
- Deploy the Activity Monitor activity agent to a Windows proxy server
Nasuni Filer Management Interface
Follow the steps to generate a Nasuni API Access Key in the Nasuni Filer Management Interface.
Step 1 – Within the Configuration menu, under USERS & SECURITY, select API Access Keys. The API Access Keys page opens.
Step 2 – Click Add API Key button. The Add API Key window opens.
Step 3 – Enter a Name for thekey; for example, the name of the application.
Step 4 – Click Create Key.
Step 5 – In the Successfully Generated API Key window, copy the Key Passcode.
Both the Key Name and the Key Passcode are required by the Activity Monitor in order to connect to the Nasuni Edge Appliance. Once the API Key has been generated, it is time to configure and enable monitoring with the Activity Monitor console.
NOTE: Nasuni API key names are case sensitive. When providing them, ensure they are entered in the exact same case as generated.
Nasuni Management Console
Follow the steps to generate a Nasuni API Access Key in the Nasuni Management Console.
Step 1 – Click Filers and select API Keys from the menu on the left. The Filer API Access Key Settings page opens.
Step 2 – Click New API Key button. The Add API Access Key window opens.
Step 3 – From the Filer drop-down menu, select the desired Nasuni Edge Appliance. Then enter a Name for the key; for example, the name of the application.
Step 4 – Click Add API Key.
Step 5 – A message appears which includes the Key Passcode; copy the Key Passcode.
Both the Key Name and the Key Passcode are required by the Activity Monitor in order to connect to the Nasuni Edge Appliance. Once the API Key has been generated, it is time to configure and enable monitoring with the Activity Monitor console.
NOTE: Nasuni API key names are case sensitive. When providing them, ensure they are entered in the exact same case as generated.
Nutanix Files Activity Auditing Configuration
The Netwrix Activity Monitor can be configured to monitor file activity on Nutanix Files devices.
A user having REST API access must be created on the Nutanix Files server to monitor the files server using Activity Monitor. Additional configurations are done automatically by Activity Monitor using the Nutanix API with the help of this user.
Follow the steps to create a new user account with Nutanix Prism:
Step 1 – Open Nutanix Prism web portal.
Step 2 – Select File Server category. In the list of servers, select the server you want to audit.
Step 3 – Click Manage roles.
Step 4 – In the Manage roles dialog box locate the REST API access user section and click +New user.
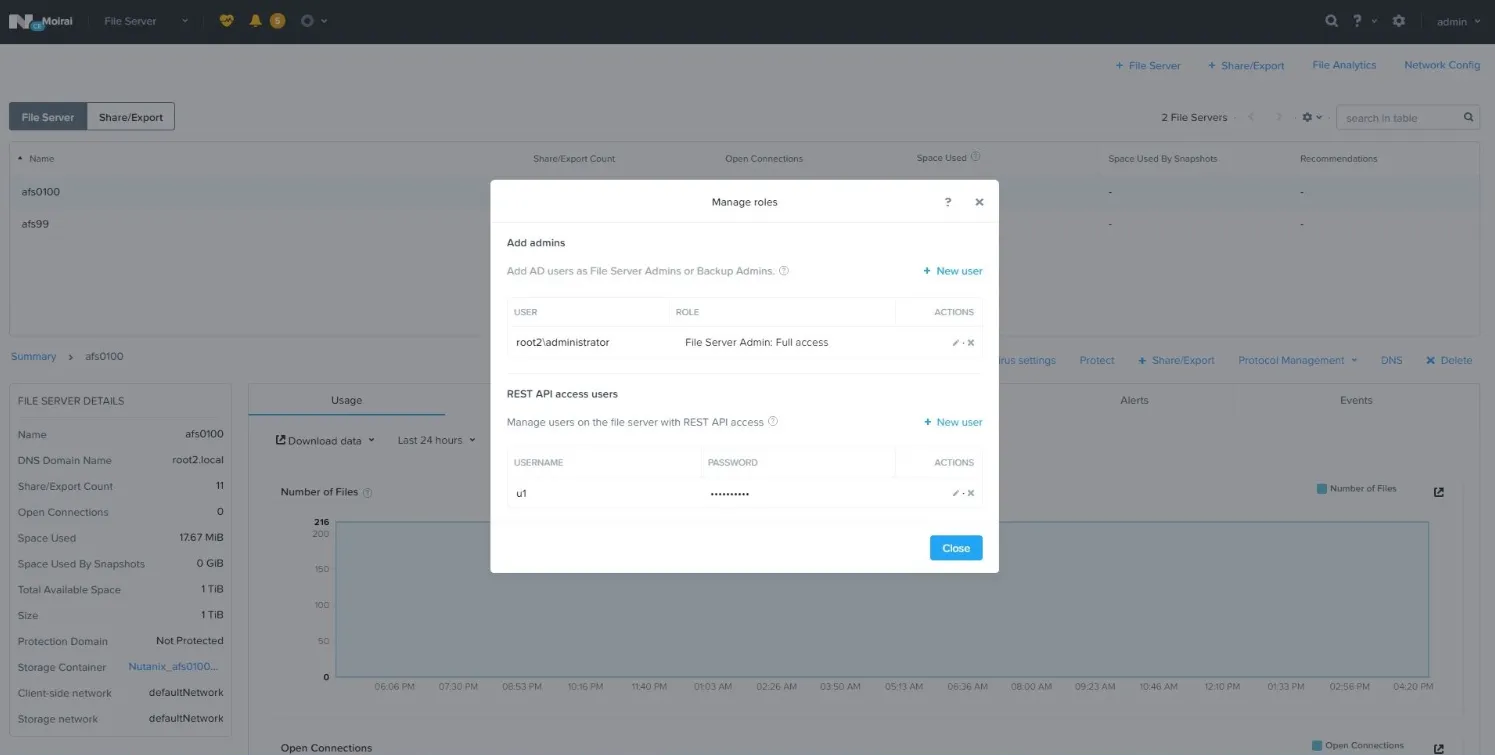
Step 5 – Enter local user account name and password, then click Save to save the settings.
Step 6 – Click Close to close the Manage roles dialog box.
NOTE: The user credentials created here are used when adding a Nutanix file server in Activity Monitor.
NOTE: Nutanix Files does not report events for activity originating from a server where the Activity Monitor Agent is installed.
Panzura CloudFS Monitoring
Netwrix Activity Monitor can be configured to monitor file system activity on Panzura CloudFS file-based storage.
The monitoring process is based on two technologies:
- Third Party Vendor Support auditing feature – Delivers audit events to Activity Monitor Agents
- CloudFS API – Used to register Activity Monitor as a consumer of audit events to query and update auditing settings
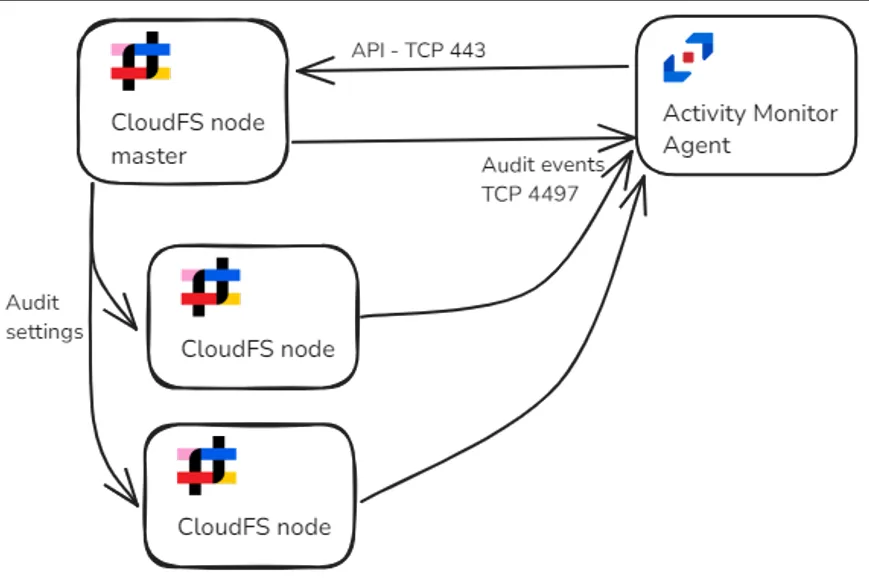
Auditing must be enabled on the master Panzura node and optionally overridden on the subordinate nodes to support different deployment scenarios depending on the expected load and network latency. A single agent monitors several Panzura nodes.
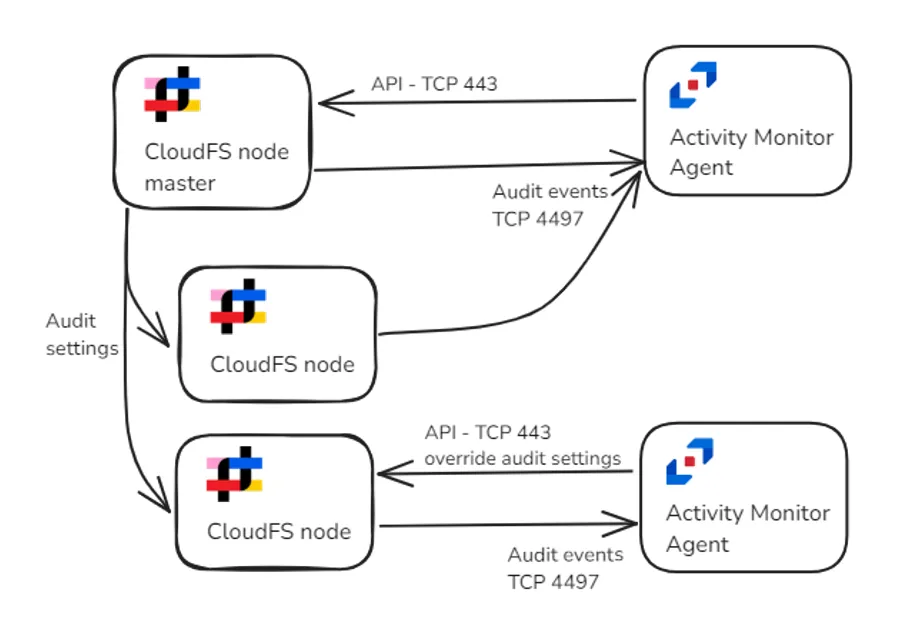
Audit events are distributed between two agents. Audit settings are overridden on one Panzura node.
The monitoring process relies on the Third Party Vendor Support auditing feature of the Panzura CloudFS platform, which uses the AMQP protocol for event delivery. Unlike typical uses of the AMQP protocol that require messaging middleware, the Panzura master and subordinate nodes connect directly to the Netwrix Activity Monitor Agent, eliminating the need for middleware.
Netwrix Activity Monitor uses Panzura API to register itself as a consumer of auditing events. It also uses the API to perform periodic checks to ensure the auditing settings in Panzura are correct. The credentials to access the API must be specified when a Panzura host is added to Activity Monitor for monitoring. Additionally, the IP address of the port is 4497 by default and can be customized in the properties for the Agent.
NOTE: See the Panzura topic for additional information on Panzura Host.
To prepare Panzura CloudFS for monitoring, auditing must be enabled.
Enable Auditing in CloudFS
Auditing in CloudFS can be enabled either automatically or manually.
RECOMMENDED: Using the automatic option using the CloudFS API streamlines the configuration process and ensures that auditing remains enabled and accurate.
Automatic Configuration
Netwrix Activity Monitor uses the CloudFS API to configure Third Party Vendor Support auditing option.
If a master node is targeted, the product will configure the global audit settings and assign to be pushed to subordinate nodes. If a subordinate node is targeted, the product will configure the local audit settings to override the global ones.
The product will also ensure the settings are correct with periodic checks.
Manual Configuration
Follow these steps to enable auditing.
Step 1 – Navigate to Audit Settings > Third Party Support.
Step 2 – Enable the Generate Third Party Logs option.
Step 3 – Enable the Push to Subordinate(s) option.
Step 4 – Enter other as the Vendor Name.
Step 5 – Under Actions, specify close, create, delete, delxattr, mkdir, move, open, read, remove, rename, rlclaim, rmdir, setxattr, and writeUnder .
If you require monitoring of Directory Read/List operations, which typically generate a high volume of data, also include readdir to the list.
Step 6 – Specify * in Include Files.
Step 7 – Specify - in Exclude Files.
Step 8 – Finally, add the Panzura host to be monitored in the Activity Monitor Console.
Auditing is now enabled.
Network Configuration
Activity Monitor agents register themselves as consumers of audit data via the CloudFS API. The agents pass their IP address and port along with other AMQP parameters. Panzura nodes use this information to establish connections with the Activity Monitor agents.
NOTE: The address and port used for registration can be found or modified in the agent’s settings.
Follow the steps for network configuration.
Step 1 – Open Activity Monitor Console.
Step 2 – On the Agents tab, select an agent and click Edit.
Step 3 – Use the Network tab to select the network interface that will be used for registration.
Step 4 – Use the Panzura tab to modify the port. The default port is 4497.
The agent will configure the Windows Firewall to allow incoming connections to the specified port automatically. Use the following table to configure the firewall.
| Communication Direction | Protocol | Ports | Description |
|---|---|---|---|
| Activity Monitor Console to Activity Monitor Agents | TCP | 4498 | Agent communication |
| Activity Monitor Agent to Panzura nodes | TCP/HTTPS | 443 | CloudFS API |
| Panzura nodes to Activity Monitor Agent | TCP/AMQP | 4497 | Audit events |
Qumulo Activity Auditing Configuration
The Netwrix Activity Monitor can be configured to monitor activity on Qumulo devices. To prepare Qumulo to be monitored, an account needs to be provisioned and the audit event format may need to be modified.
Provision Account
Activity Monitor requires an account with the Observers role to monitor a Qumulo cluster. Follow the steps to create a new account in the Qumulo web user interface with the Observers role.
Step 1 – Create a new user in Cluster > Local Users & Groups.
Step 2 – Assign the Observers role to the user using Cluster > Role Management.
This credential will then be used when configuring the Activity Agent to monitor the Qumulo device.
Verify Audit Event Format
Qumulo reports audit events in one of two formats: CSV and JSON. While the Netwrix Activity Monitor supports both, the JSON format is recommended as it provides more detail. In particular, it allows the product to distinguish between permission change events and attribute change events, presents granular information for permission changes, and includes user SIDs instead of just usernames. The advanced filtering of Microsoft Office activity also requires the JSON format.
The JSON format for audit events was introduced in Qumulo Core 6.0.1. The new format can be enabled via an SSH session to the Qumulo cluster.
Follow the steps to verify that audit event format and change the format, if needed.
Step 1 – Connect to the Qumulo cluster with SSH.
Step 2 – Execute the following command to log in:
qq --host <ip-address-of-qumulo> login -u <user-name>

The command will ask for the password.

__Step 3 –__ Execute the following command to check current format:

qq audit_get_syslog_config

The format will be shown in the __format__ field. The old format is __csv__; the new format is __json__.

__Step 4 –__ Execute the following command to change the format, if needed:

qq audit_set_syslog_config --json

The change willshould be reflected in the __format__ field.