Active Directory Search Results
When a search has been started, the Search Status table at the bottom displays the percentage complete according to the size and quantity of the activity log files being searched per AD agent. You can Filter and Sort the results using the column headers. Below the Search button is the Export option.
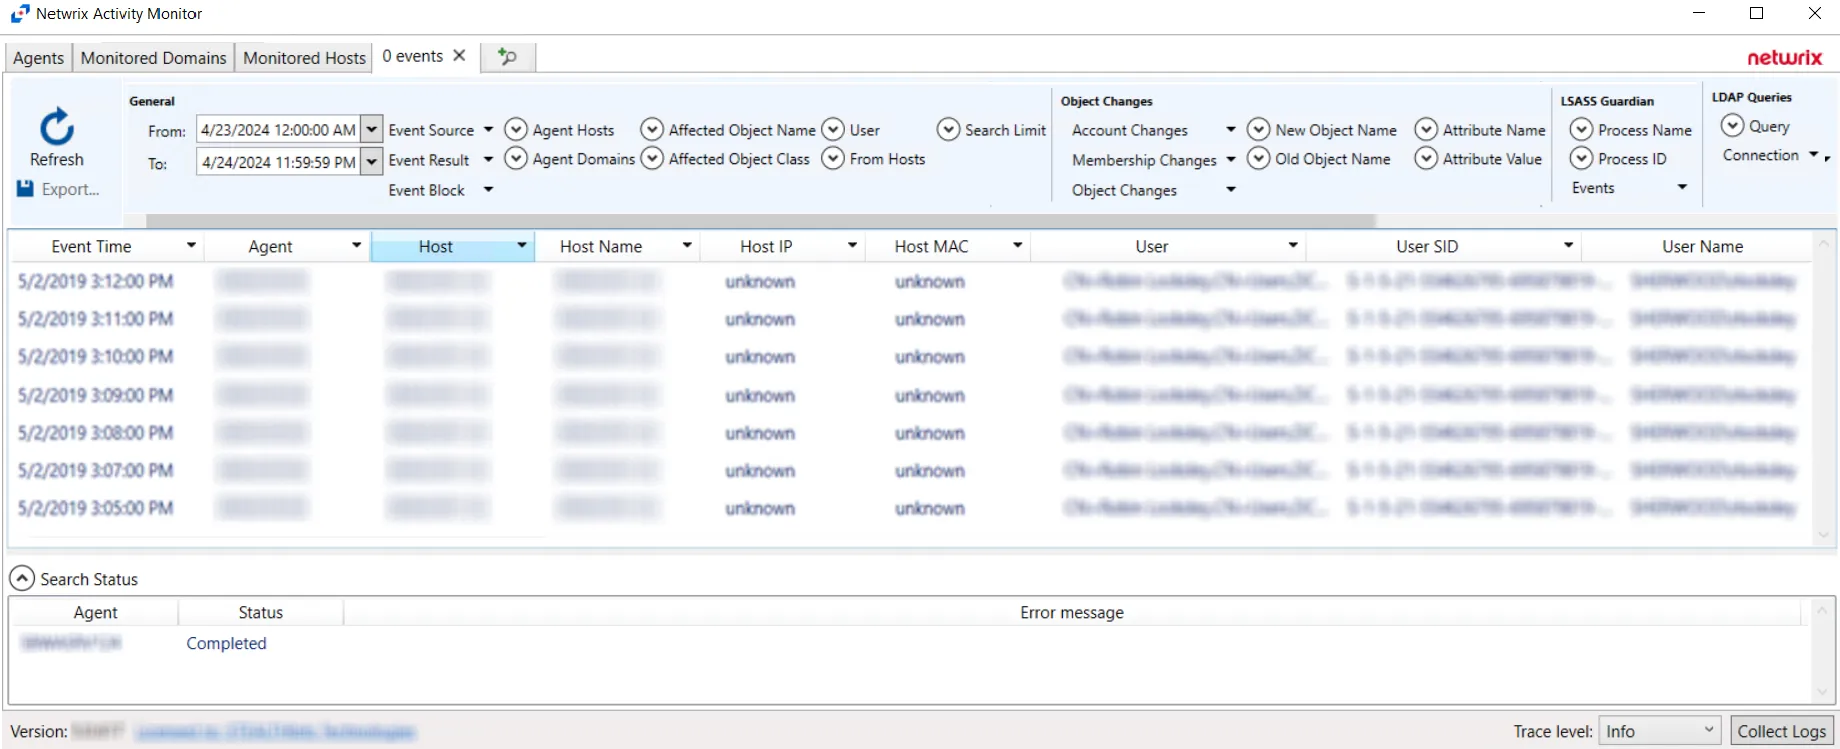
The results data grid columns display the following information for each event:
- Event Time – Date timestamp of the event
- Agent – Server where the Agent is deployed
- Host – Target host where the event was recorded
- Host Name – Name of the target host
- Host IP – IP address of the target host
- Host MAC – Network adapter identifier
- User – Security principal of the account that triggered the event
- User SID – Security Identifier of the account used in the event
- User Name – Name for the security principal that triggered the event
- User Class – Active Directory class of the affected object
- Blocked – Indicates the Agent blocked the event from occurring
- Success – Indicates the event completed successfully
- Event Source – Location of Monitored host where event occurred
- Event Type – Indicates the type of event
- Affected Object – Active Directory distinguished name for the affected object
- Affected Object SID – Security Identifier of the object/account affected by the event
- Affected Object Name – Name of the Affected Object
- Protocol – Protocol(s) used for the monitored operation
- Query Filter – LDAP filter used in the operation
- Secured Query – Indicates if LDAP connection is secured or not
- Query Objects – Number of returned objects produced by the LDAP request
- Process Name – Contains process name that is monitored. Currently this is only lsass.exe.
- PID – Process Identifier generated for each active process
- Old Name – Value prior to the monitored change
- New Name – Value after the monitored change
- Authentication Type – Indicates type of authentication event. Possible values: Kerberos, NTLM.
- Target Host – Name of the originating host
- Target IP – IP address of the originating host
- Authentication Protocol – Indicates authentication protocol. Possible values: Unknown, Kerberos, KerberosTgs, KerberosAs, NTLM, NTLMv1, NTLMMixed, NTLMv2.
- NTLM Logon Type – Indicates type of protocol used to authenticate a connection between client and server
- Ticket Encryption – Indicates encryption type used in request part of the Kerberos ticket
- PAC – RID for the group that does not have access
- SPN – Detects attempts to obtain a list of Service Principal Name values
- User Exists – Indicates if user exists
- N2 Password – Indicates if an invalid password matches the user’s password history
At the bottom of the search interface, additional information is displayed for selected events in the data grid. The Attribute Name, Operation, Old Value, and New Value for the logged event (as applicable to the event) are displayed.
Microsoft Entra ID Search Results
When a search has been started, the Search Status table at the bottom displays the percentage complete according to the size and quantity of the activity log files being searched per activity agent. You can Filter and Sort the results using the column headers. Below the Search button is the Export option.
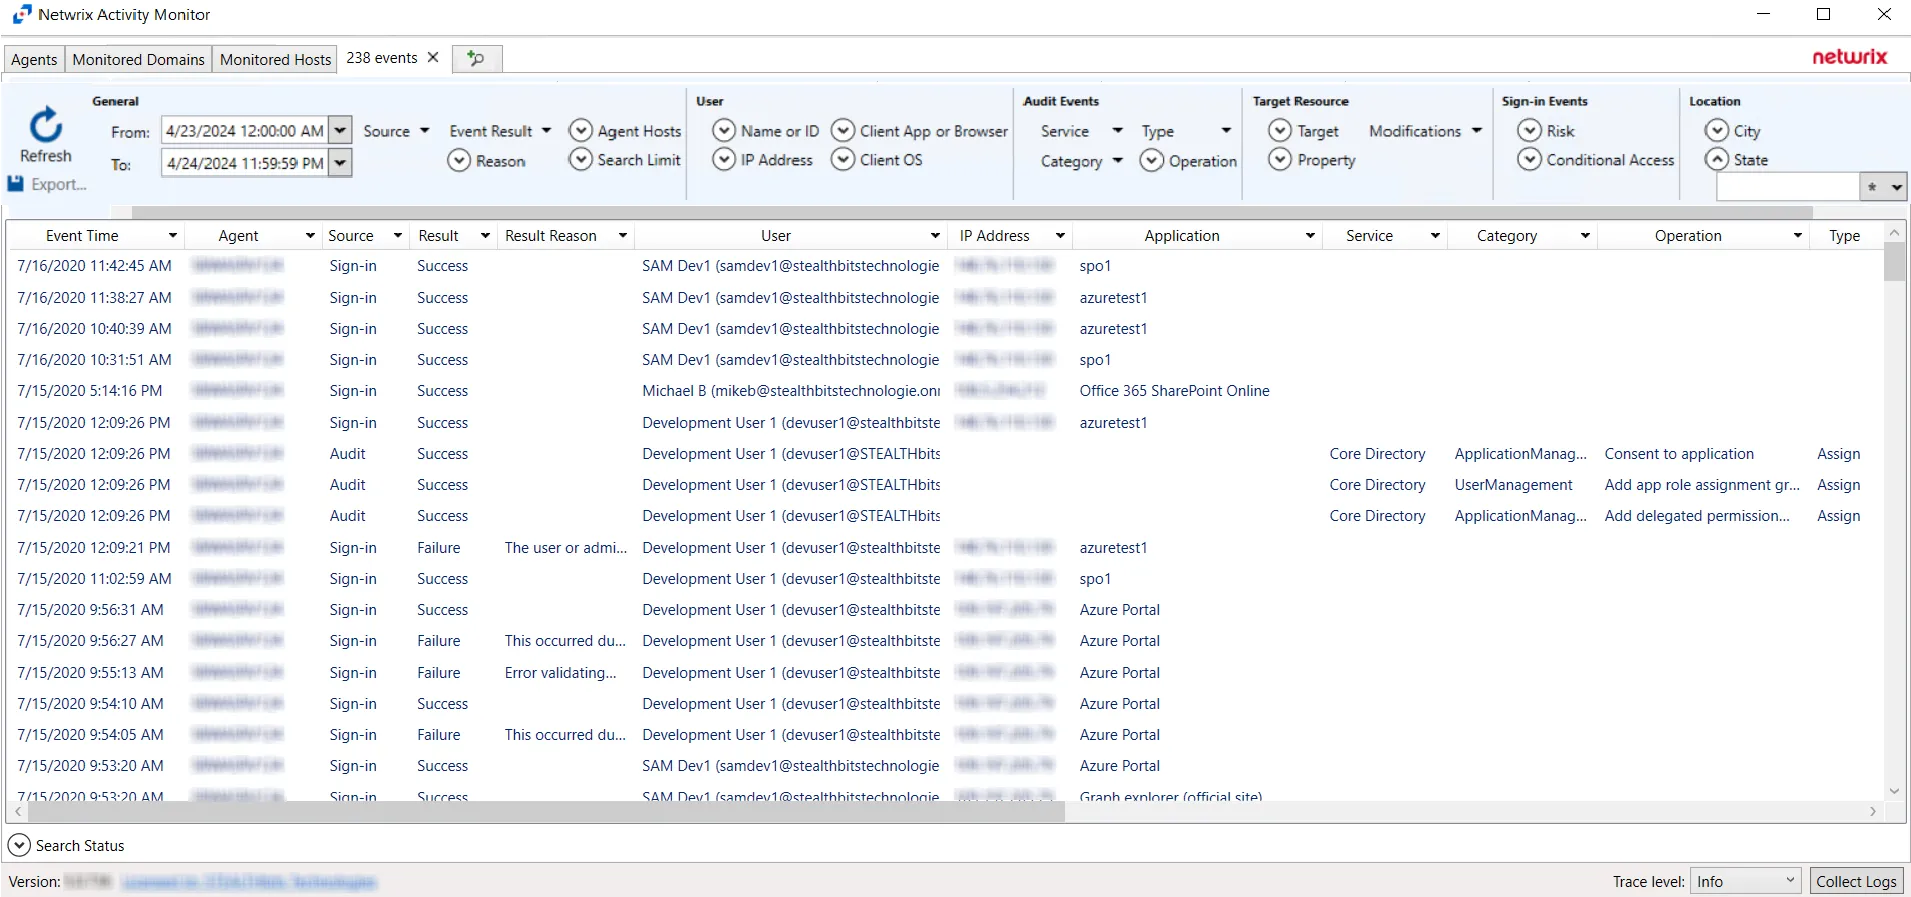
The results data grid columns display the following information for each event:
- Event Time – Date timestamp of the event
- Agent – Agent which monitored the event
- Source – Indicates the source of the activity event
- Result – Indicates whether the event resulted in a Success or Failure
- Result Reason – If an event resulted in a Failure, the reason for it will be listed in the Result Reason column
- User – Indicates user account associated with the event
- IP Address – Indicates the IP Address associated with the event
- Application – Indicates the Application associated with the event
- Service – Indicates the Service associated with the event
- Category – Indicates the Category associated with the event. Categories returned from search queries can be configured using the Category filter drop-down.
- Operation - Indicates the Operation associated with the event. Operations returned from search queries can be configured using the Operation filter drop-down.
- Type – Indicates the Type associated with the event. Types returned from search queries can be configured using the Type filter drop-down.
- Target(s) – Indicates the Target(s) of the event
- Modified – Indicates modifications associated with the event
- Client App – Indicates the Client App associated with the event
- OS – Indicates the OS associated with the event
- Browser – Indicates the browser associated with the event
- City – Indicates the City associated with the event
- State – Indicates the State associated with the event
- Country – Indicates the Country associated with the event
- Coordinates – Indicates the Coordinates associated with the event
- Interactive – Indicates whether the event was an Interactive event
- Risk – Indicates the level of Risk associated with events
- Conditional Access – Indicates whether Conditional Access was applied to the event
- Conditional Policy – Indicates whether a Conditional Policy was applied to the event
- Details – If applicable, provides additional information associated with the event that is not provided by the other Results columns
At the bottom of the search interface, additional information is displayed for selected events in the data grid. The Attribute Name, Operation, Old Value, and New Value for the logged event (as applicable to the event) are displayed.
Exchange Online Search Results
When a search has been started, the Search Status table at the bottom displays the percentage complete according to the size and quantity of the activity log files being searched per activity agent. You can Filter and Sort the results using the column headers. Below the Search button is the Export option.
The results data grid columns display the following information for each event:
- Event Time – Date timestamp of the event
- Agent – Agent which monitored the event
- Source – Indicates the source of the activity event
- Operation - Operation associated with event
- User – Indicates user account associated with the event
- User Type - Type of user associated with event
- External – Indicates whether external sharing is associated with the event
- IP Address – Indicates the IP Address associated with the event
- Object - Object associated with event
- Mailbox - The mailbox associated with the event
- Modified - Indicates whether a modification is associated with the event
- DLP Policy - If applicable, indicates the DLP Policy associated with the event
At the bottom of the search interface, additional information is displayed for selected events in the data grid. The Attribute Name, Operation, Old Value, and New Value for the logged event (as applicable to the event) are displayed.
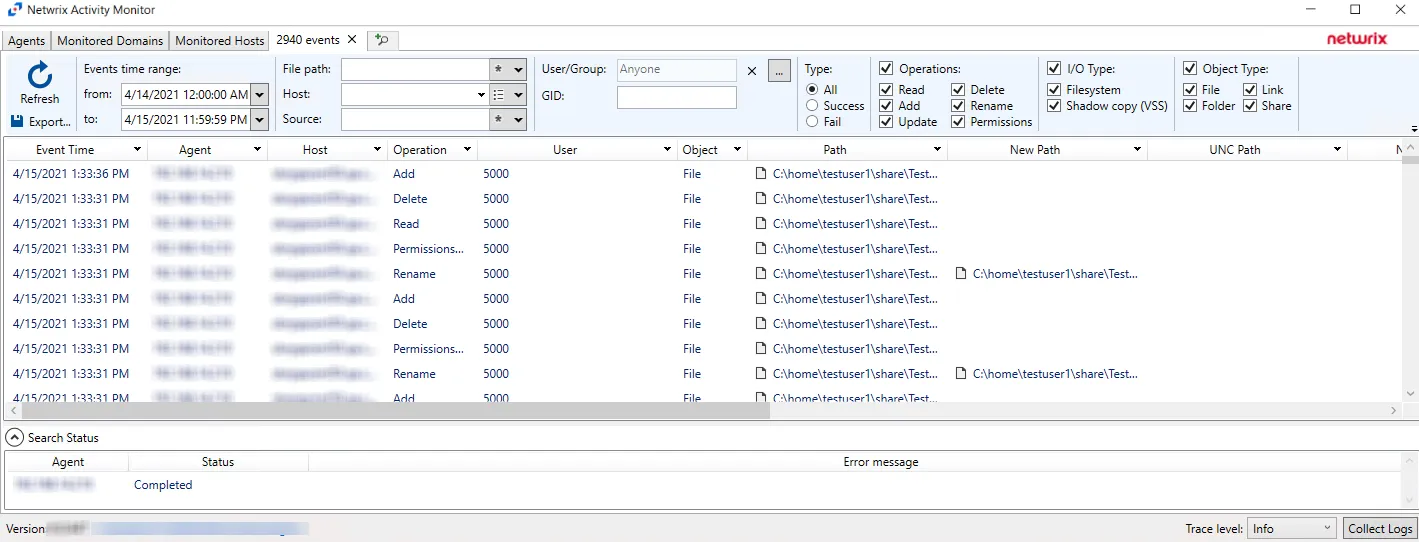
File Search Results
When a search has been started, the Search Status table at the bottom displays the percentage complete according to the size and quantity of the activity log files being searched per activity agent. You can Filter and Sort the results using the column headers. Below the Search button is the Export option.
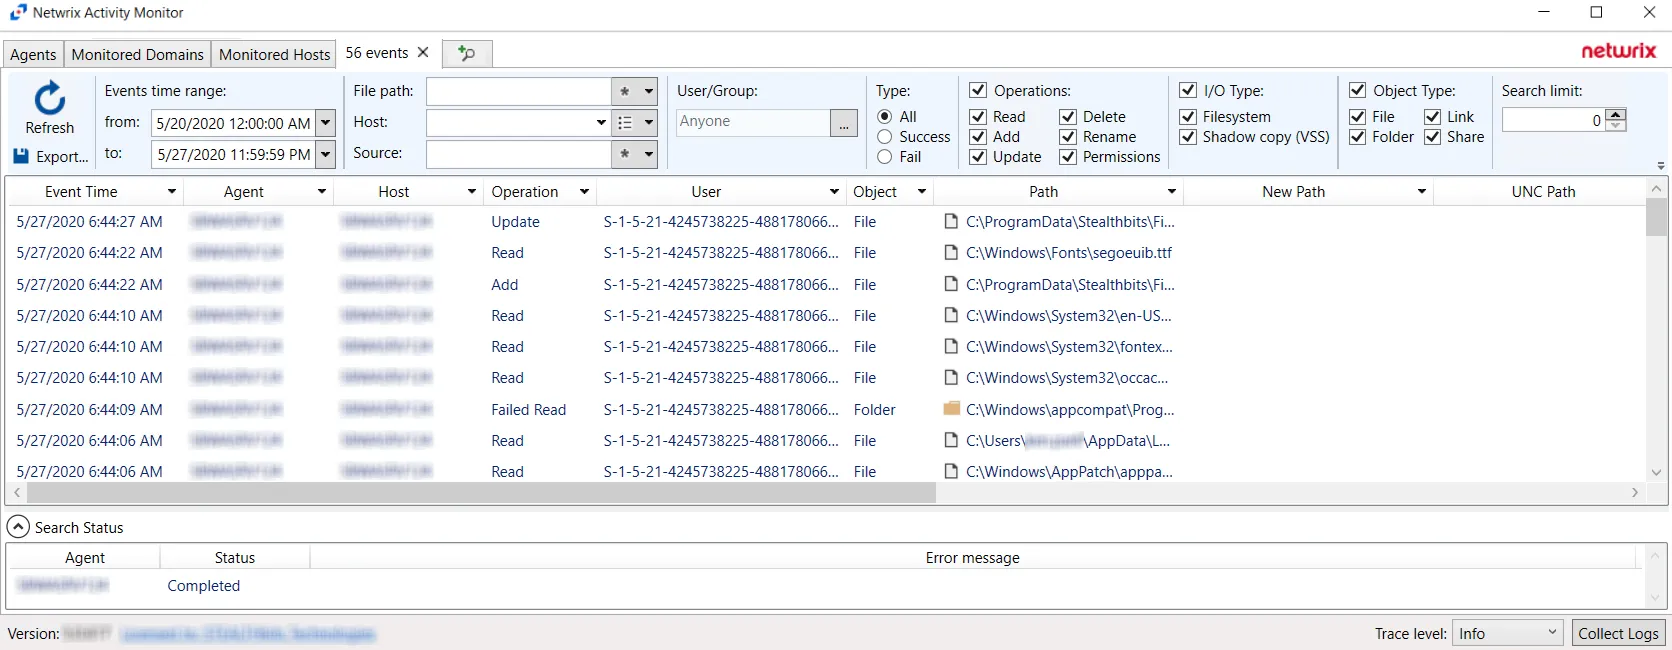
The results data grid columns display the following information for each event:
-
Event Time – Date timestamp of the event
-
Agent – Agent which monitored the event
-
Host – Monitored host where the event occurred
-
Operation – Type of the activity event which was monitored
-
User – User account that performed the activity event
-
Object – Type of object the activity event occurred upon:
- File
- Folder
- Unknown
-
Path – Path where the operation occurred
-
New Path – For rename operation events only, the path’s new location/name
-
UNC Path – UNC path employed by a remote user to access the share, folder, and/or file
-
New UNC Path – For rename operation events only, the UNC path’s new location/name employed by a remote user
-
Source – Indicates the source of the activity event
- For local Windows activity – Process name (e.g. notepad.exe)
- For network Windows activity – IP Address of the user
- For NAS device activity – IP Address for the NAS device of the user
-
Share Name – Name of share where the activity event occurred. This includes NFS.
-
I/O Type – Displays the input/output type
-
Protocol – Communication protocol used to access the share, folder, and/or file:
- CIFS
- NFS
- VSS
- HTTP
-
Protocol Version – Displays the Protocol Version for NetApp Data ONTAP Cluster-Mode device. This field is empty for all other servers/devices.
-
File Size — Displays the file size
-
Tags — (Windows Only) Operation tags. Reports 'Copy' for events that are probably copies.
-
Group — Displays the Group Name or ID (GID)
At the bottom of the search interface, additional information is displayed for selected events in the data grid. The Attribute Name, Operation, Old Value, and New Value for the logged event (as applicable to the event) are displayed.
Permissions Changes
When the results data grid displays information about permissions changes, additional information is made available.
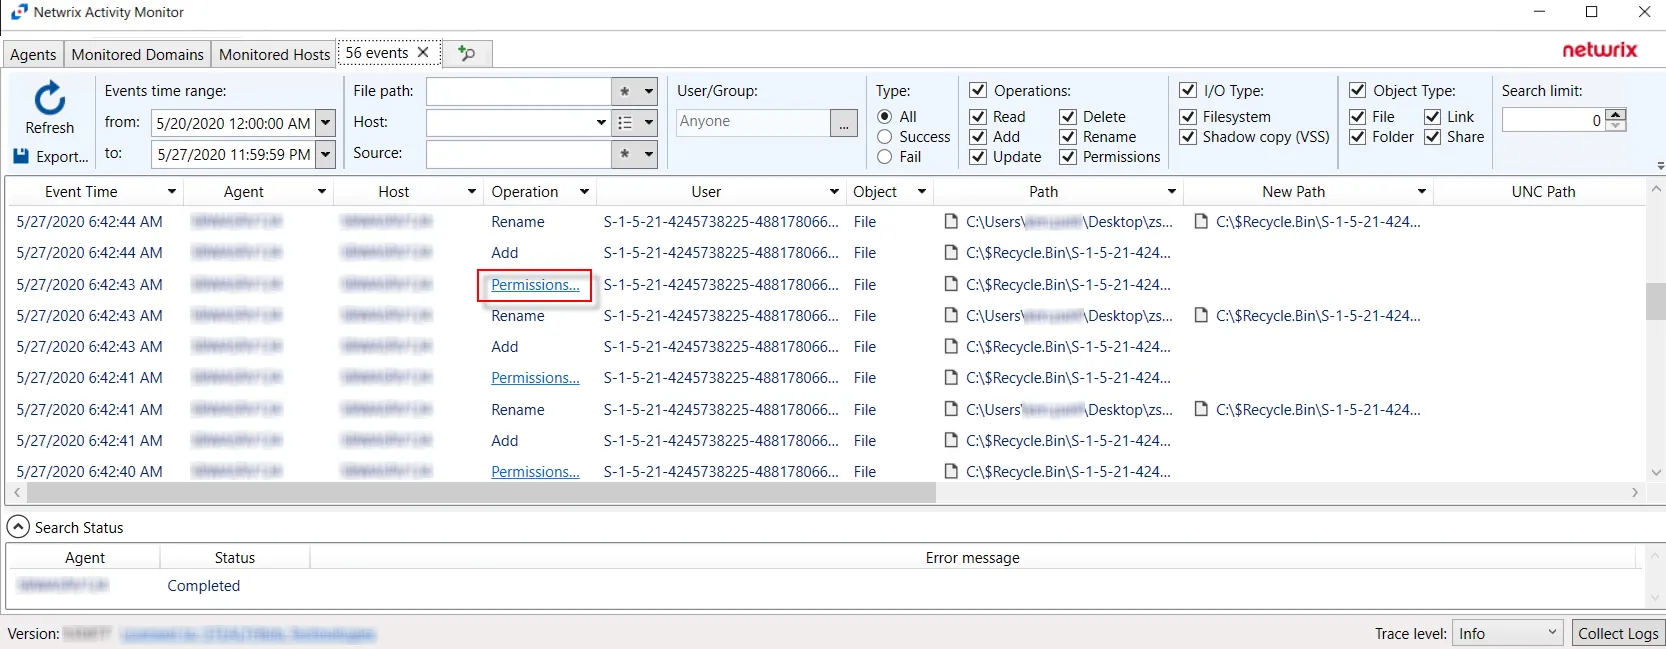
A link displays in the Operation column of the results data grid. Click the Permissions Change link to open the Permissions Change Details window.
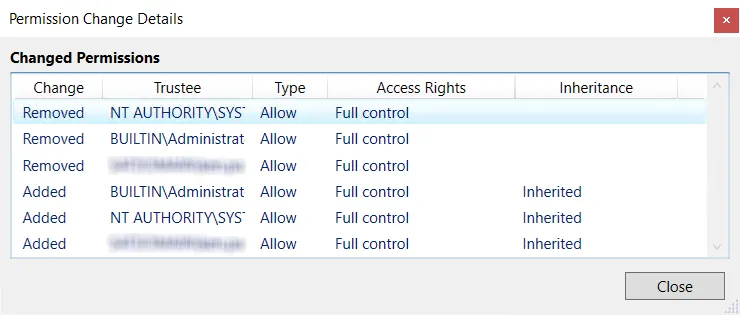
The window displays details about the changes of the security descriptor with information from the new line added to a DACL:
- Change – Type of change which occurred (Added, Removed, etc.)
- Trustee – SAM account name of the affected object
- Type – Type of permission applied (Allow/Deny)
- Access Rights – Rights associated with the type of permission change
- Inheritance – Indicates how the permission change is inherited
Linux Search Results
When a search has been started, the Search Status table at the bottom displays the percentage complete according to the size and quantity of the activity log files being searched per Linux agent. You can Filter and Sort the results using the column headers. Below the Search button is the Export option.
The results data grid columns display the following information for each event:
-
Event Time – Date timestamp of the event
-
Agent – Agent which monitored the event
-
Host – Monitored host where the event occurred
-
Operation – Type of the activity event which was monitored
-
User – User account that performed the activity event
-
Object – Type of object the activity event occurred upon:
- File
- Folder
- Unknown
-
Path – Path where the operation occurred
-
New Path – For rename operation events only, the path’s new location/name
-
UNC Path – UNC path employed by a remote user to access the share, folder, and/or file
-
New UNC Path – For rename operation events only, the UNC path’s new location/name employed by a remote user
-
Source – Indicates the source of the activity event
-
Share Name – Name of share where the activity event occurred. This includes NFS.
-
I/O Type – Displays the input/output type
-
Protocol — Will be LOCAL for Linux Activity
-
Protocol Version — This field is empty for Linux Activity
-
GID — Group ID associated with event
At the bottom of the search interface, additional information is displayed for selected events in the data grid. The Attribute Name, Operation, Old Value, and New Value for the logged event (as applicable to the event) are displayed.
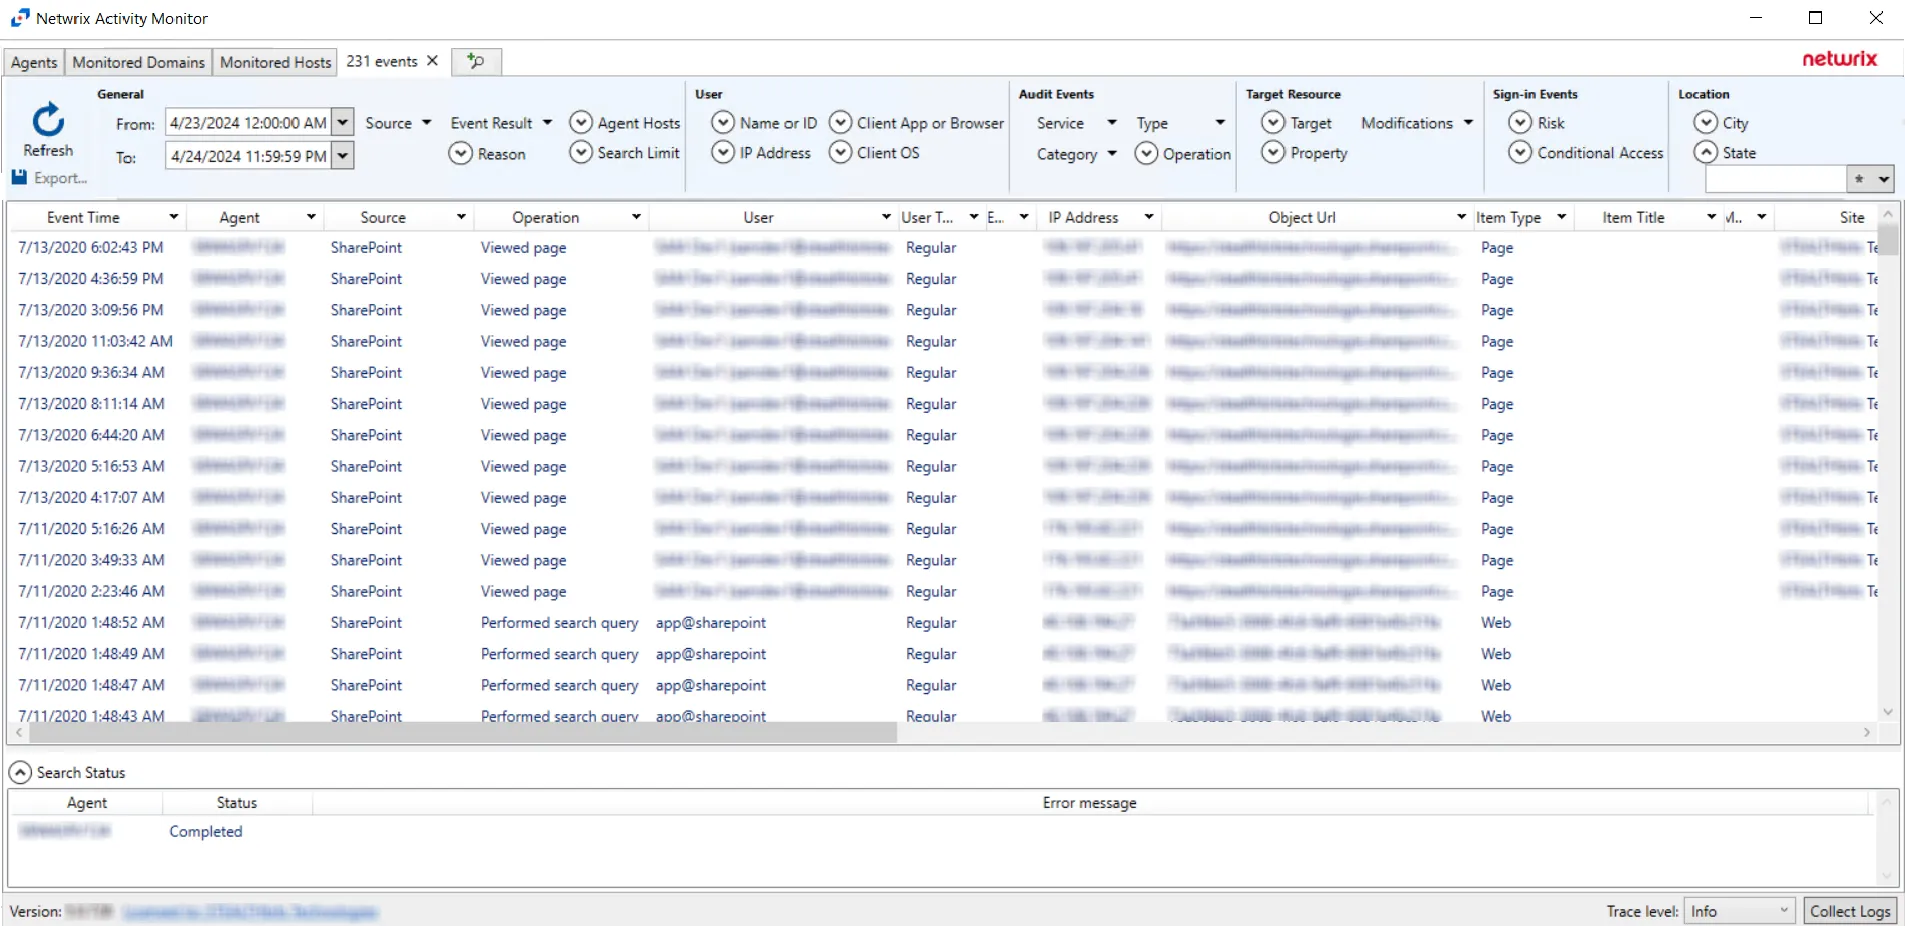
SharePoint Search Results
When a search has been started, the Search Status table at the bottom displays the percentage complete according to the size and quantity of the activity log files being searched per activity agent. You can Filter and Sort the results using the column headers. Below the Search button is the Export option.
The results data grid columns display the following information for each event:
- Event Time – Date timestamp of the event
- Agent Host – Agent used to collect event information
- Event Type – Indicates the type of event
- User – User account that performed the activity event
- User Login – User login associated with the event
- Protocol – Protocol used for the monitored operation
- Absolute URL - Indicates the Absolute URL associated with the event
- Web Application – Indicates the web application associated with the event
- Site URL – Site URL associated with the event
- Web Title - If applicable, indicates the Web Title associated with the event
- Doc Location – If applicable, indicates the location of the document associated with the event
- New Doc Location – If applicable, indicates the new location of the document associated with the event
At the bottom of the search interface, additional information is displayed for selected events in the data grid. The Attribute Name, Operation, Old Value, and New Value for the logged event (as applicable to the event) are displayed.
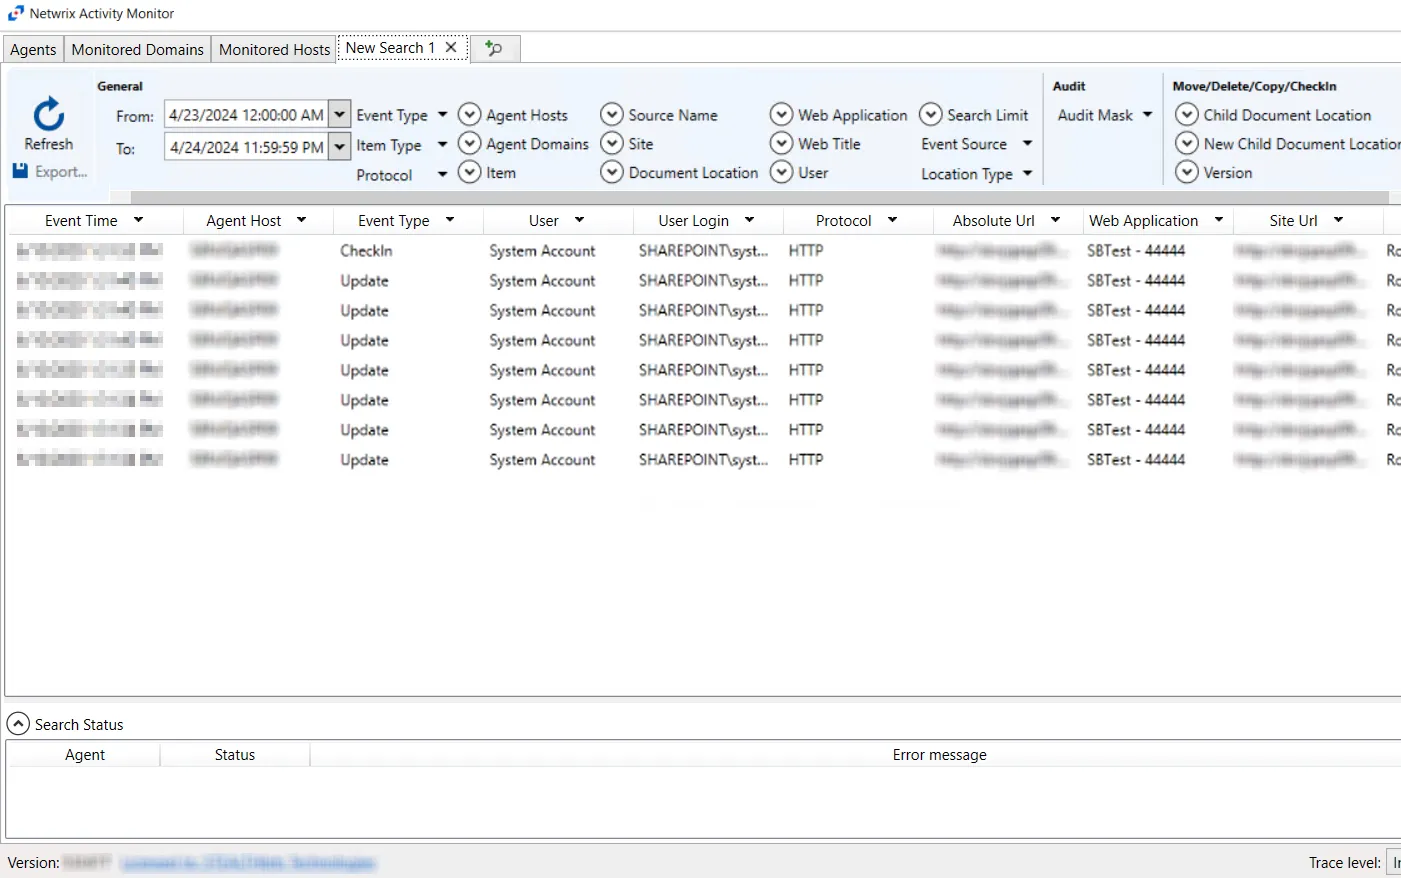
SharePoint Online Search Results
When a search has been started, the Search Status table at the bottom displays the percentage complete according to the size and quantity of the activity log files being searched per activity agent. You can Filter and Sort the results using the column headers. Below the Search button is the Export option.
The results data grid columns display the following information for each event:
- Event Time – Date timestamp of the event
- Agent – Agent which monitored the event
- Source – Indicates the source of the activity event
- Operation - Operation associated with event
- User – User account that performed the activity event
- User Type - Type of user associated with event
- External – Indicates whether external sharing is associated with the event
- IP Address - IP Address associated with event
- Object Url - Object Url associated with event
- Item Type - The type of the item associated with the event
- Item Title - The title of the item associated with the event
- Modified - Indicates whether a modification is associated with the event
- Site - Site where the event occurred
- List - Indicates which list the event is associated with
- Relative URL - Indicates the Relative URL associated with the event
- File Name - The name of the file associated with the event
- Extension - If applicable, indicates the extension of the file associated with the event
- New Relative URL - If applicable, indicates the new relative URL of the file associated with the event
- New File Name - If applicable, indicates the new name for the file associated with the event
- New Extension - If applicable, indicates the new extension of the file associated with the event
- Workload - Workload associated with the event
- Access - If applicable, indicates what level of access is associated with the event
- Target Account - If applicable, indicates the recipient of the event
- Target Type - If applicable, indicates the type of account of the recipient of the event
- DLP Policy - If applicable, indicates the DLP Policy associated with the event
- Event Data – Data associated with the event
- Custom Event - If the Custom Event filter was configured in the Query bar, it will appear here
At the bottom of the search interface, additional information is displayed for selected events in the data grid. The Attribute Name, Operation, Old Value, and New Value for the logged event (as applicable to the event) are displayed.
SQL Server Search Results
When a search has been started, the Search Status table at the bottom displays the percentage complete according to the size and quantity of the activity log files being searched per activity agent. You can Filter and Sort the results using the column headers. Below the Search button is the Export option.
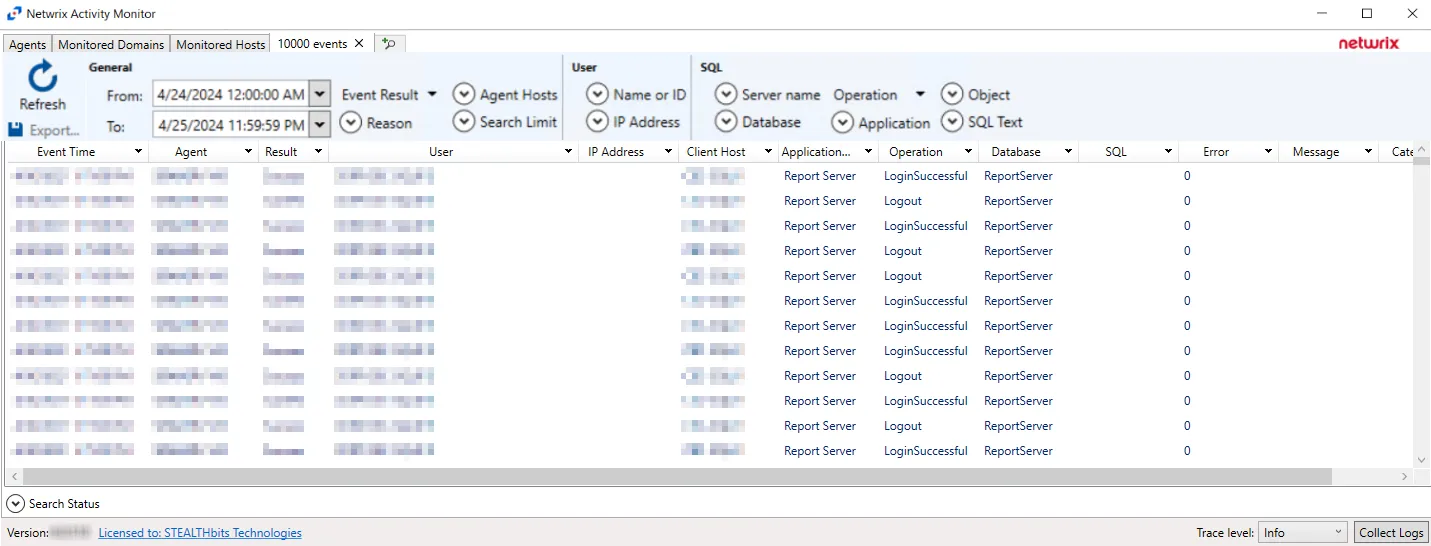
The results data grid columns display the following information for each event:
- Event Time – Date timestamp of the event
- Agent – Agent which monitored the event
- Result – Indicates whether the event type was a success
- User – User account that performed the activity event
- IP Address – IP Address of the client host associated with the event
- Client Host – Name of the client host associated with the event
- Application Name – Name of the application associated with the event
- Operation – The type of operation associated with the event
- Database – The type of database associated with the event
- SQL – The SQL Server Query text associated with the event
- Error – Indicates SQL Server Error Code associated with the event
- Message – Description of the error associated with the event
- Category – Category of the error associated with the event
At the bottom of the search interface, additional information is displayed for selected events in the data grid. The Attribute Name, Operation, Old Value, and New Value for the logged event (as applicable to the event) are displayed.