Activity Records Statistics
Aggregated statistics on the activity records is provided in the Activity records by date widget. The chart shows the number of activity records produced by your data sources, collected and saved by Netwrix Auditor during the last 7 days. This data can help you to assess the activity records generation intensity in your IT infrastructure, and product load.
After you click View details, the Activity Records Statistics window will be displayed.
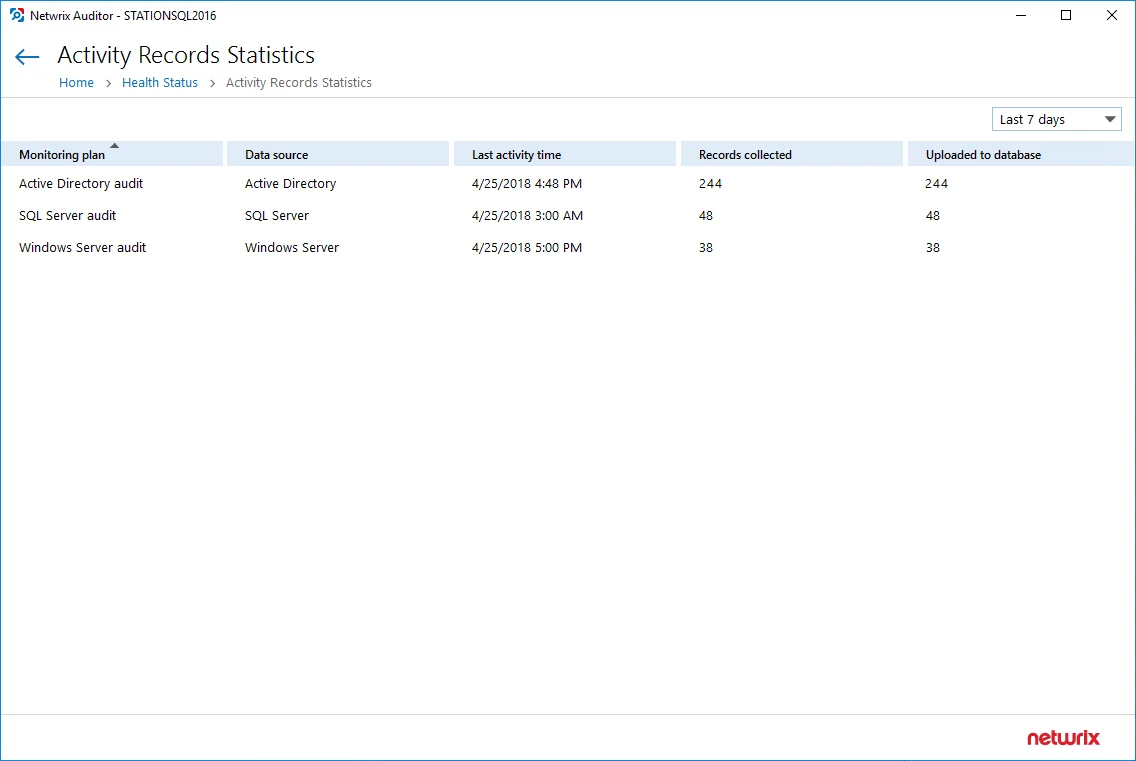
By default, statistics on activity records processing is grouped by Monitoring plan and presented for the Last 7 days. To modify the timeframe, use the drop-down list in the upper right corner.
Other fields provide the following information: data source that produces activity records, with date and time of the last collected record, and the overall number of records collected and uploaded to the corresponding Audit database during the specified timeframe.
If the data sources processed by a monitoring plan did not produce any activity records during the specified timeframe, this monitoring plan will not appear in the list.
Database Statistics
Databases may tend to run out of free space due to poor capacity provisioning or to retention settings not configured properly. Use the Database statistics widget to examine database size and adjust retention accordingly. The widget displays the name of default SQL Server instance hosting all Netwrix Auditor databases, the overall database capacity at the moment and its change over the last day (24 hours).
Transaction logs size is not included in the calculations.
After you click View details, the following information will be displayed for the specified SQL Server instance:
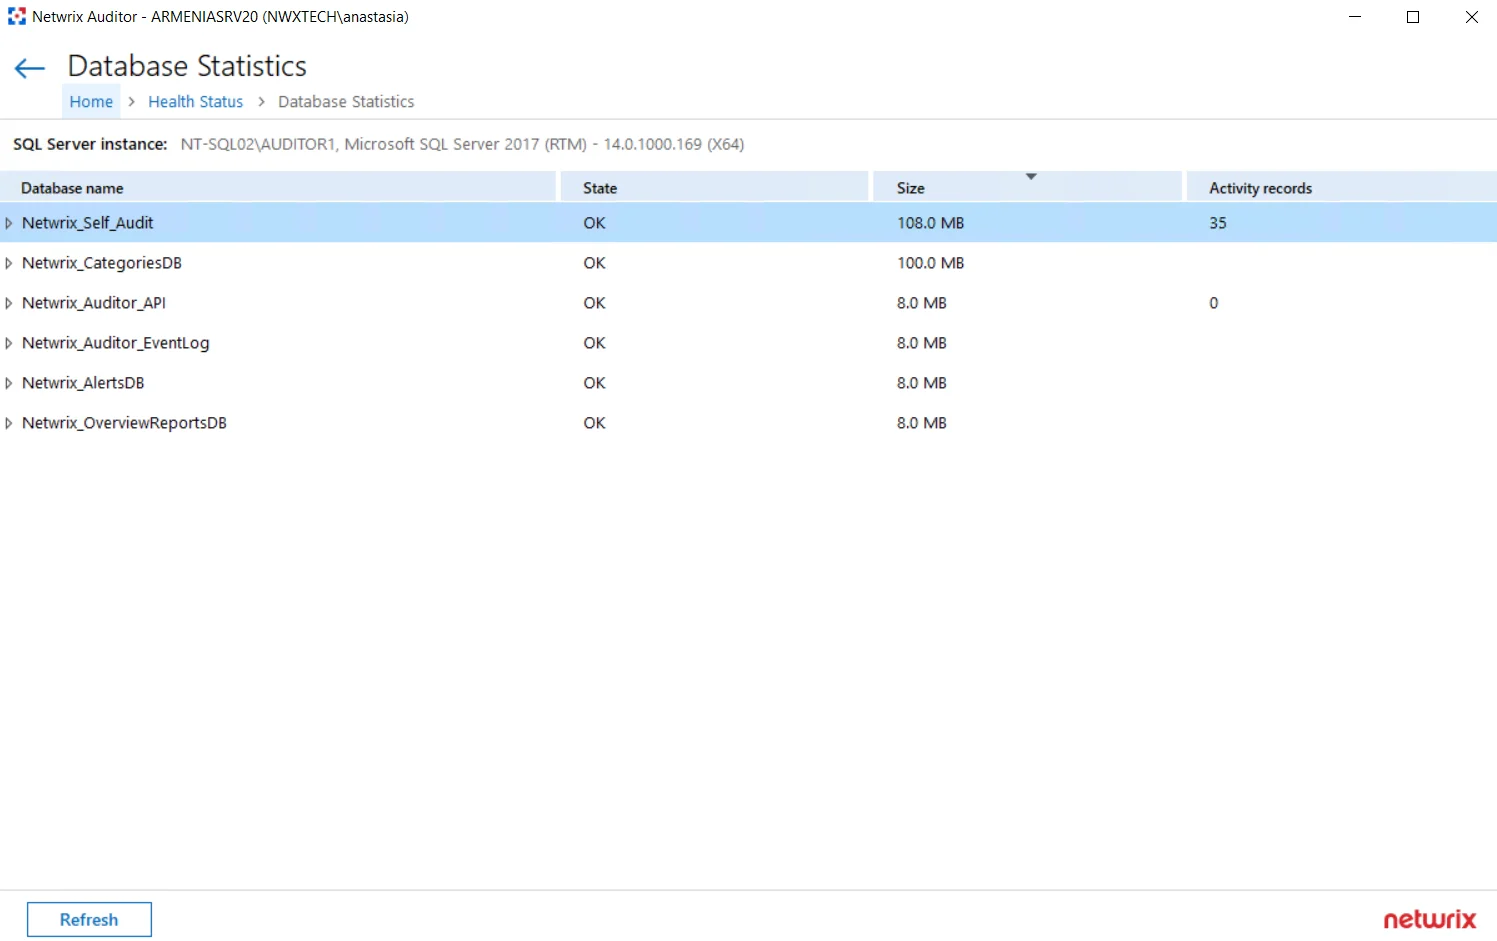
The Database name column contains the list of Netwrix Auditor databases hosted by the specified instance of the SQL Server:
- Special databases are created automatically on the default SQL Server instance to store:
- alerts—Netwrix_AlertsDB database
- activity records collected using Integration API—Netwrix_Auditor_API database
- internal event records—Netwrix_Auditor_EventLog database
- data collected by Netwrix Auditor self-audit—Netwrix_Self_Audit database
- data needed for overview reports generation—Netwrix_OverviewReportsDB
- To store data from the data sources included in the monitoring plan, dedicated Audit databases are
created and named by user (default name format is Netwrix_Auditor
<monitoring_plan_name>_)
The following capacity metrics are displayed for each database:
- State—database state summary
- Size—current database size (logs are not included)
- Activity records—number of the activity records stored in the database at the moment
After you expand the database node, the detailed database properties will be shown:
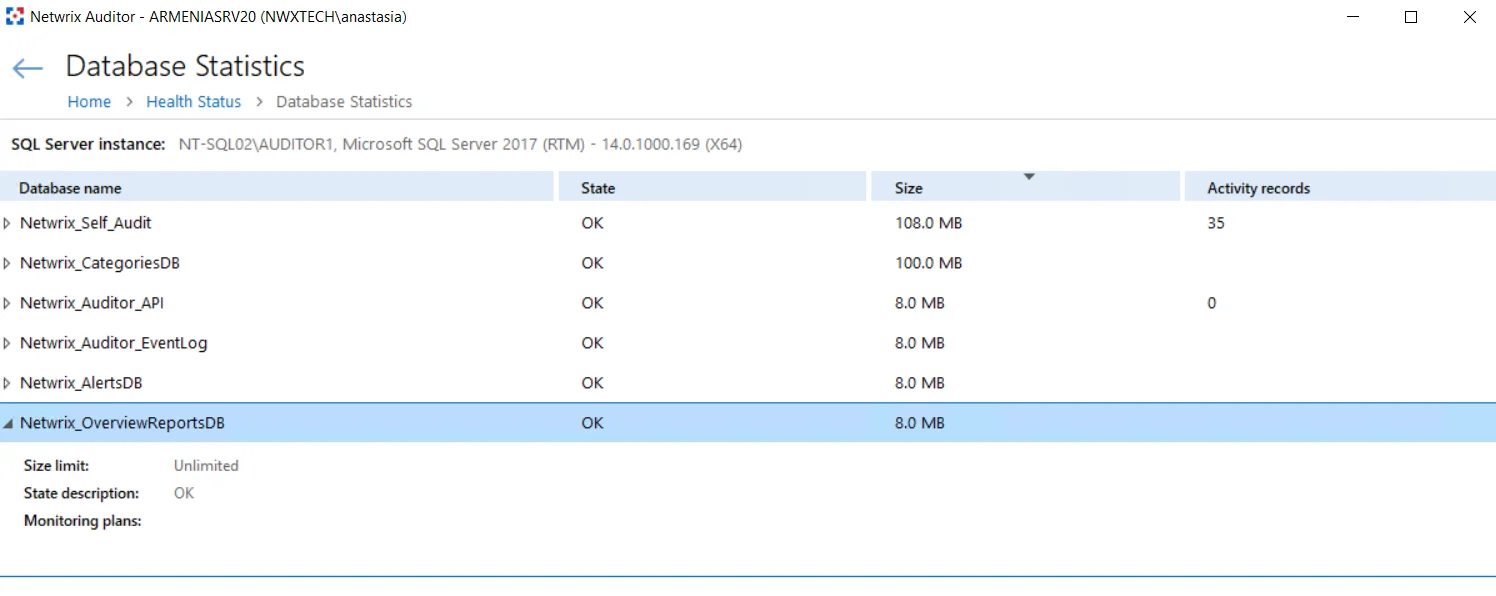
These properties are as follows:
| Property | Possible Values | Description |
|---|---|---|
| Size limit | <size_limit> | For SQL Server Express Edition–shows database size limitations |
| Unlimited | ||
| State description | OK | Database is operating properly. |
| Capacity error | Database is running low on disk space. -OR- Size limit for SQL Server Express Edition will be reached soon (threshold is 500 MB, i.e. 5% of 10 GB limit remaining). | |
| Failed to store data | Failed to store data to the database due to some issues. | |
| Unavailable | Failed to connect to the database. | |
| Upgrade in progress | Database is being upgraded. | |
| Monitoring plans | <monitoring_plan> | All monitoring plans for which this database is a target. Usually it is recommended to configure a dedicated database for each plan. |
You can use the Search field, or apply a filter to display the information you need. For example, in the Apply Filters dialog you can select the Show only plans with issues to display only the monitoring plans that require attention and corrective actions.
This information will help you to troubleshoot the product operation, detect and eliminate the root cause of the monitoring errors, providing for auditing continuity and compliance.
Netwrix Auditor Health Log
Daily summary of the Netwrix Auditor health log is displayed in the Health log widget. The chart shows how many events with different severity levels were written to the product health log in the last 24 hours. To open the health log, click the Open Health Log link in the Health Status dashboard. See the topic for additional information.
If you want to clear Netwrix Auditor Health Log, son the computer where Auditor Server is installed, navigate to EventViewer -> Application and Services Logs and locate the Netwrix Auditor System Health log. Then, follow the instructions provided by Microsoft. See the Microsoft article for additional information on How to Clear Event Logs.
Netwrix Auditor System Health Log
When an error occurs, a system administrator or support engineer must determine what caused this error and prevent it from recurring. For your convenience, Auditor records important events in the proprietary Netwrix Auditor System Health event log.
You can review events directly in the product:
-
When issues encountered during data collection, click Details... in the Status column and select View Health Log.
OR
-
In the main screen, in the Configuration section click the Health status tile, then in the Health log dashboard widget click Open health log.
You can also inspect the log in the Event Viewer.
There are three types of events that can be logged:
| Event Type | Description |
|---|---|
| Information | An event that describes the successful operation beginning or completion. For example, the product successfully completed data collection for a monitoring plan. |
| Warning | An event that is not necessarily significant, but may indicate a possible future problem. For example, the product failed to process a domain controller. |
| Error | An event that indicates a significant problem such as loss of data or loss of functionality. For example, the product failed to retrieve settings for your data source. |
Review the following:
If you want to monitor Auditor health status in more depth, you can do the following:
- Create a monitoring plan for this log using Event Log Manager too to collect activity data. See the Monitoring Overview topic for additional information.
- Configure alerts triggered by specific events in the product's health log. Create Alerts on Health Status
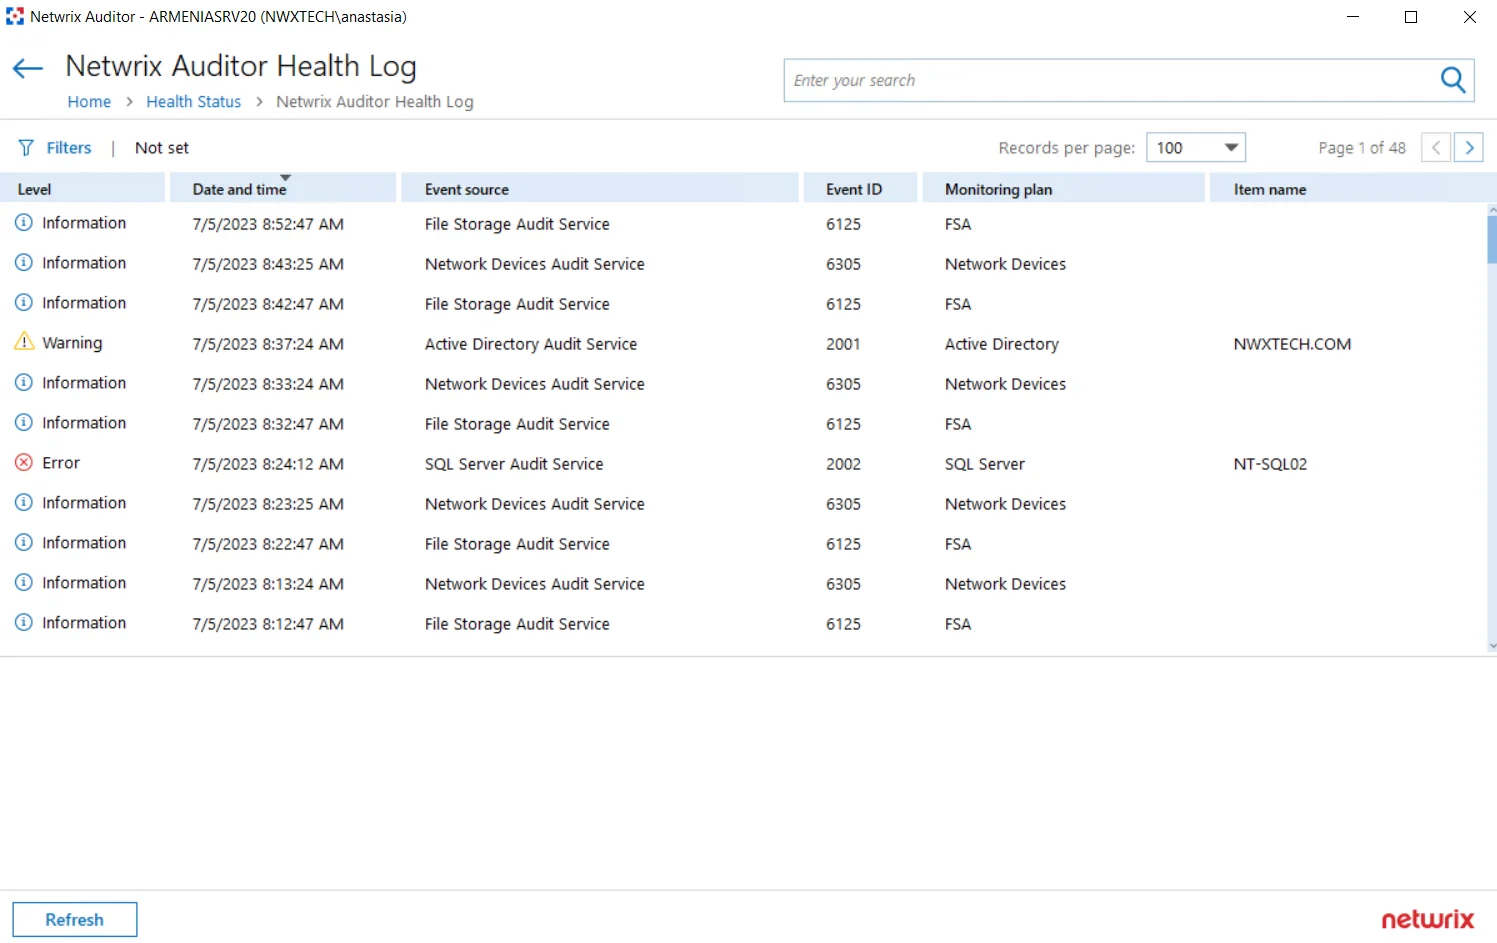
Inspect Events in Health Log
Follow the steps o inspect events in Netwrix Auditor health log
Step 1 – On the main Auditor page, select the Health status tile, then in the Health log dashboard widget click Open health log.
Step 2 – Select an entry to review it in details. You can also copy event details. Select the event in the list and click Copy details at the bottom of the window.
For your convenience, Auditor provides you with filters so that you can narrow down the number of events on the screen and focus on those that matter most. For example, warnings on failed data collection or events of an important monitoring plan.
Filter Events
Follow the steps to filter events.
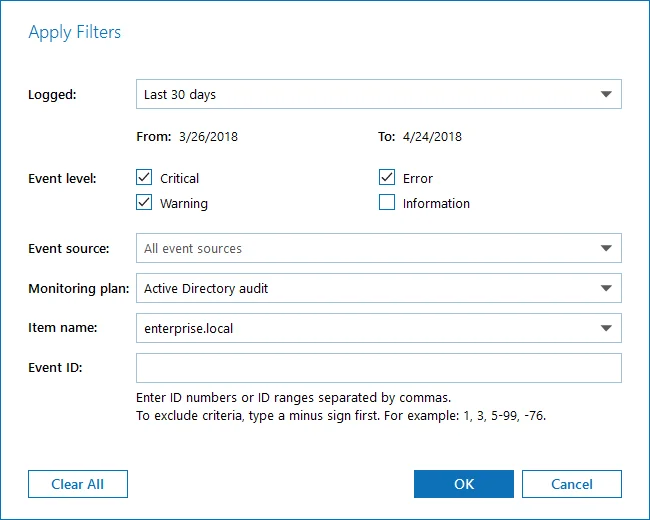
Step 1 – Select Filters in the upper part of the Netwrix Auditor Health Log window.
Step 2 – Complete the following fields:
| Option | Description |
|---|---|
| Logged | Specify event logging time period (date range, yesterday, etc.). |
| Event level | Select level of the events that you want to be displayed. |
| Event source | Select services and applications whose events you want to view. |
| Monitoring plan | Select to display events from one or several monitoring plans. |
| Item name | Select to display events from the certain item(s) you need. |
| Event ID | Enter event ID number or range of event IDs separated by commas. For example, 1, 3, 5-99. You can also exclude unwanted event IDs from being displayed. Type the minus sign before selected event ID. For example, -76. |
The applied filters will be listed on the top of the screen under the window title.
Monitoring Overview
Aggregated statistics on the monitoring plans is provided in the Monitoring overview widget. It displays current statuses of all monitoring plans:
- Ready (green indicator)—The monitoring plans (one or several) successfully processed the data sources with all their items and are ready for the next run.
- Pay attention (yellow indicator)—The monitoring plans (one or several) require your attention, as some items were not processed completely but only partially. This status applies to the monitoring plans targeted at Logon Activity and Windows File Server. See the table below for details.
- Take action (red indicator)—Any data source or item in the monitoring plan (one or several) was processed with errors.
After you click View details, the Monitoring Overview window will be displayed.
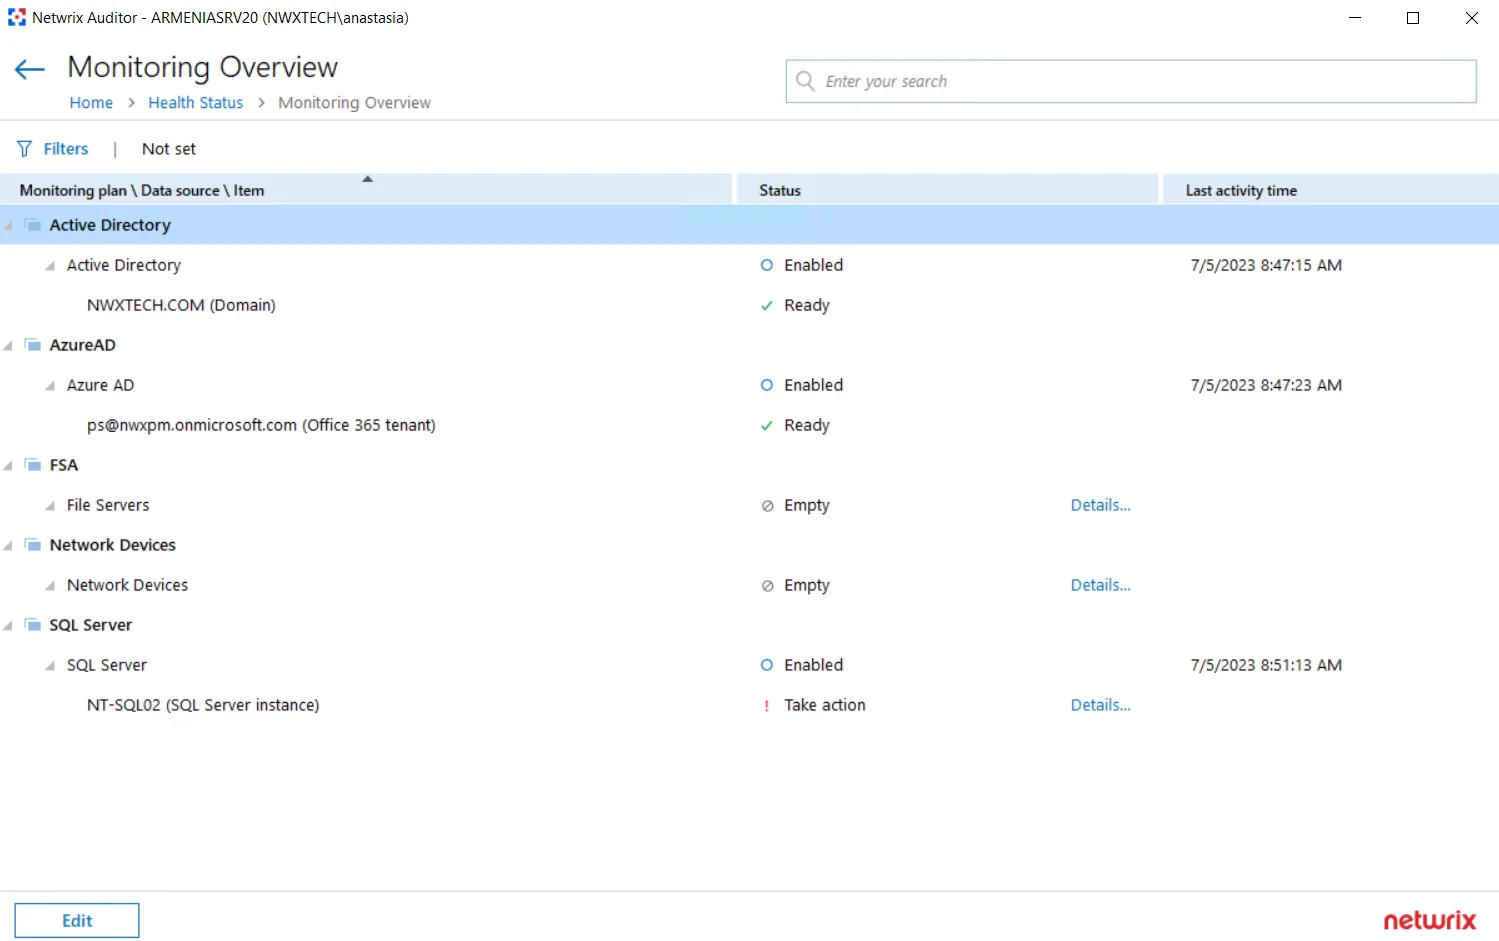
It provides the hierarchical list of monitoring plans, processed data sources and corresponding items with their current status and date/time of the last data processing session. For data sources and items their current status is depicted as follows:
| Entity | Status | Description |
|---|---|---|
| Data source | Disabled | A data source can be disabled manually via its settings (by switching Monitor this data source and collect activity data to OFF), or automatically, if the license is not valid any more (for example, the count of licensed objects was exceeded, or the trial period has expired). |
| Empty | No items have been added to this data source yet. | |
| Enabled | Monitor this data source and collect activity data is set to ON in the data source settings. | |
| Not available | The monitoring plan is corrupted and cannot process its data sources, so it is recommended to remove it and create anew. | |
| Not responding | Data collector for this data source is not responding. The underlying items will not be displayed for such data source. | |
| Working | The data source is being processed at the moment. | |
| (not displayed) | The data source status is unknown. | |
| Item | Pay attention | The item was processed with some issues (non-critical). This status applies to the monitoring plans targeted at Logon Activity and Windows File Server. It means that data collection from at least one entity completed with errors. For example, a MyFileServer item included in the File Server monitoring plan contains all CIFS shares hosted on the MyFileServer computer. If any of these shares was processed with errors while others were processed successfully, the processing of the whole MyFileServer item will be considered partially completed, and the monitoring plan will have a yellow indicator, requiring your attention. Click the Details link to examine the product log. |
| Ready | The item was processed successfully and is ready for the next run of data collection. | |
| Take action | Critical error(s) occurred while processing this item. Click the Details link to examine the product log. | |
| Working | The item is being processed at the moment. |
You can use the Search field, or apply a filter to display the information you need. For example, in the Apply Filters dialog you can select the Show only plans with issues to display only the monitoring plans that require attention and corrective actions.
This information will help you to troubleshoot the product operation, detect and eliminate the root cause of the monitoring errors, providing for auditing continuity and compliance.
Health Status Dashboard
New Health Status dashboard facilitates Auditor maintenance and troubleshooting tasks, providing IT specialists with at-a-glance view on the most critical factors: data collection performance, product health and storage capacity. The dashboard comprises a set of widgets that display the status of these aspects using aggregated statistics and charts. Nearly each widget allows you to drill down to the detailed information on the aspect you are interested in.
To view the dashboard, on the main Auditor page, click the Health status tile located in the Configuration section.
The dashboard includes the following widgets:
- The Activity records by date chart—Shows the number of activity records produced by your data sources, collected and saved by Netwrix Auditor during the last 7 days. See the Activity Records Statistics topic for additional information.
- The Monitoring overview widget—Shows aggregated statistics on the statuses of all monitoring plans configured in Netwrix Auditor at the moment. See the Monitoring Overview topic for additional information.
- The Health log chart—Shows the statistics on the events written in the Netwrix Auditor health log in the last 24 hours. Click the link in this widget to view the log. See the Netwrix Auditor Health Log topic for additional information.
- The Database statistics widget—Helps you to estimate database capacity on the default SQL Server instance that hosts the product databases. See the Database Statistics topic for additional information.
- The Long-Term Archive widget—Helps you to estimate the capacity of the Long-Term Archive file-based storage. To modify its settings, including location and retention, click the link in this widget. See the System Health topic for additional information.
- The Working Folder widget—Helps you to estimate the capacity of the Auditor working folder used to keep operational information (configuration files of the product components, log files, and other data) on the Auditor Server. See the System Health topic for additional information.
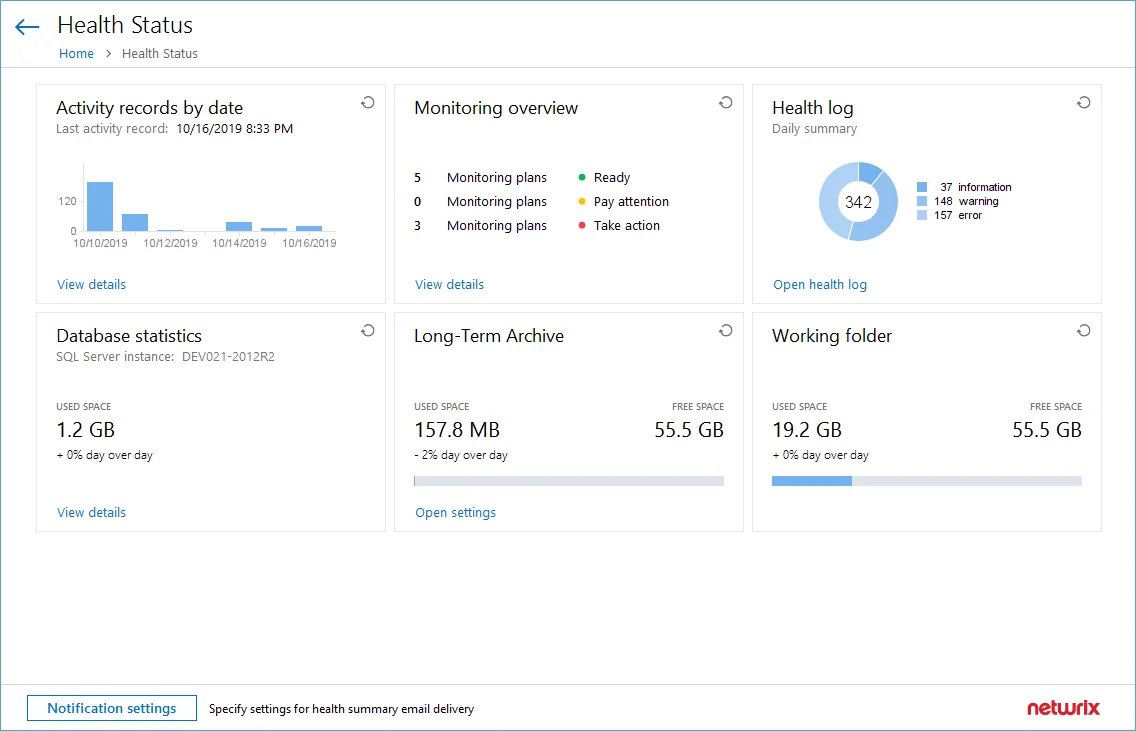
You can also instruct Netwrix Auditor to forward similar statistics as a health summary email to personnel in charge. For that, click Notification settings, then follow the steps described in the Notifications topic.
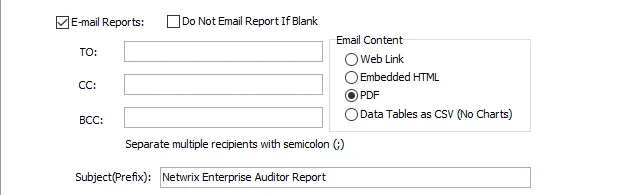
Health Summary Email
Auditor Health Summary email includes all statistics on the product operations and health for the last 24 hours; it also notifies you about license status. By default, this email is generated daily at 7:00 AM and delivered to the recipient specified in the Notifications settings. Email content is very similar to data presented in the Health Status Dashboard.
For greater usability, to depict overall product health state, the email includes a color indicator in the topmost section: green means Auditor had no issues while auditing your IT infrastructure, and red means there were some problems that require your attention.
The email looks like shown below:
The Monitoring Overview section of the email provides detail information only for the monitoring plans with issues. Successfully completed monitoring plans are not included.