Work with Collected Data
Review the examples below for the possible scenarios on how to work with collected data.
Example 1: Search by Index
Follow the steps to search by index:
Step 1 – Navigate to the Search page of the add-on or Search & Reporting Splunk app
Step 2 – Enter the search command:
index=<your_netwrix_index>
for example:
index=netwrix
Step 3 – Press the Last 24 hours button and choose All time time range.
Step 4 – Press the search button; you should see list of the events currently indexed in Splunk.
Step 5 – Click on the arrow button next to any of the returned event to expand the list of parsed fields and confirm that fields are populated properly.
If you do not see any fields, make sure that you are running the search in Smart or Verbose mode.
Follow the steps to get all user account creation events from Microsoft Entra ID (formerly Azure AD) ports .
Step 1 – Navigate to the Search page of the add-on or Search & Reporting Splunk app
Step 2 – Enter the search command:
index=netwrix Action=”Added” ObjectType=”user”
| table Who Action ObjectType What Where
Step 3 – Press the Last 24 hours button and choose All time time range.
Example 2: Use Netwrix Auditor Fields in Index Search
Follow the steps to use Auditor fields in index search:
Step 1 – Navigate to the Search page of the add-on or Search & Reporting Splunk app
Step 2 – Enter the search command:
| datamodel <data_model_name> search
| search sourcetype=netwrix
for example:
| datamodel Authentication search
| search sourcetype=netwrix
Step 3 – Press the Last 24 hours button and choose All time time range.
Step 4 – Press the search button; you should see list of the events currently indexed in Splunk and mapped to the selected data model.
Step 5 – Click on the arrow button next to any of the returned event to expand the list of parsed fields and confirm that fields are populated properly.
Example 3: Use CIM Data Model Search and Data Model Fields
Follow the steps to get all events for account deletion:
Step 1 – Navigate to the Search page of the add-on or Search & Reporting Splunk app
Step 2 – Enter the search command:
| datamodel Change search
| search sourcetype=netwrix All_Changes.action=”deleted”
| table All_Changes.vendor_product All_Changes.action All_Changes.src All_Changes.dest All_Changes.user All_Changes.object All_Changes.object_attrs
Step 3 – Press the Last 24 hours button and choose All time time range.
CIM Data Model Mapping
The Splunk Common Information Model (CIM) is installed with an add-on and adds a set of data models that allow data normalization to simplify search.
The CIM contains a number of standard data models that can be used for search. Each of them has predefined set of standard fields common for different data sources.
Netwrix Auditor Add-on for Splunk will map some of the Activity Records that match certain scenario to the respective CIM data models.
| Criteria | Data model | Description |
|---|---|---|
| DataSource IN ("Microsoft Entra ID", "Logon Activity", "SQL Server", "VMware") Action="Successful Logon" | Authentication > Authentication > Successful_Authentication | Successful login events |
| DataSource IN ("Microsoft Entra ID", "Logon Activity", "SQL Server", "VMware") Action="Failed Logon" | Authentication > Authentication > Failed_ Authentication | Failed login events |
| DataSource IN ("Active Directory", "Microsoft Entra ID", "Exchange*") Action="Added" ObjectType IN ("user", "computer", "inetorgperson", "service principal", "mail contact", "mail user") | Change > All_Changes > Account Management > Created Accounts | Account creation events |
| DataSource IN ("Active Directory", "Microsoft Entra ID", "Exchange*") Action IN ("Modified", "Moved") ObjectType IN ("user", "computer", "inetorgperson", "service principal", "mail contact", "mail user") | Change > All_Changes > Account Management > Updated Accounts | Account update events |
| DataSource IN ("Active Directory", "Microsoft Entra ID", "Exchange*") Action="Removed" ObjectType IN ("user", "computer", "inetorgperson", "service principal", "mail contact", "mail user") | Change > All_Changes > Account Management > Deleted Accounts | Account deletion events |
| DataSource IN ("Active Directory", "Microsoft Entra ID", "Exchange*", "File Servers") Action IN ("Added", "Modified", "Moved", "Removed") NOT ObjectType IN ("user", "computer", "inetorgperson", "service principal", "mail contact", "mail user") | Change > All_Changes | All other – not related to accounts – changes |
| DataSource IN ("Active Directory", "Microsoft Entra ID", "Exchange*") ObjectType IN ("user", "computer", "inetorgperson", "service principal", "mail contact", "mail user") is_ lockout=1 | Change > All_Changes > Account Management > Locked Accounts | Account lockout events |
| DataSource IN ("Active Directory", "Microsoft Entra ID", "Exchange*") Action IN ("Added", "Modified", "Removed") is_audit=1 | Change > All_Changes > Auditing Changes | Changes to audit settings or policies |
| DataSource="Exchange*" ObjectType="Mailbox Item" Action IN ("Sent", "Removed") | Email > All Email | Information related to sent or received emails |
| DataSource="File Server" Action IN ("Added". "Modified", "Moved", "Removed", "Renamed") ObjectType IN ("file", "folder") | Endpoint > Filesystem | Changes to file shares |
Deployment Procedure
Prepare Netwrix Auditor for Data Processing
In the Netwrix Auditor client, go to the Integrations section and verify Integration API settings:
- Make sure the Leverage Integration API is switched to ON.
- Check the TCP communication port number – default is 9699.
See the Configure Integration API SettingsAudit Databasetopic for additional information.
Download the Add-on
Follow the steps to download the add-on.
Step 1 – Download the distribution package Netwrix_Auditor_Add-on_for_Splunk.zip from the following web page: https://www.netwrix.com/add-on_for_splunk.html
Step 2 – Unpack it to a folder on the computer from which you can access Splunk Web.
Install the Add-on
Follow the steps to install the add-on.
Step 1 – Login to Splunk Web using Splunk Administrator account.
Step 2 – Open the Splunk Apps settings in any of the following ways:
- On the main Explore Splunk Enterprise screen, click the gear icon at the top of the left Apps panel:

-
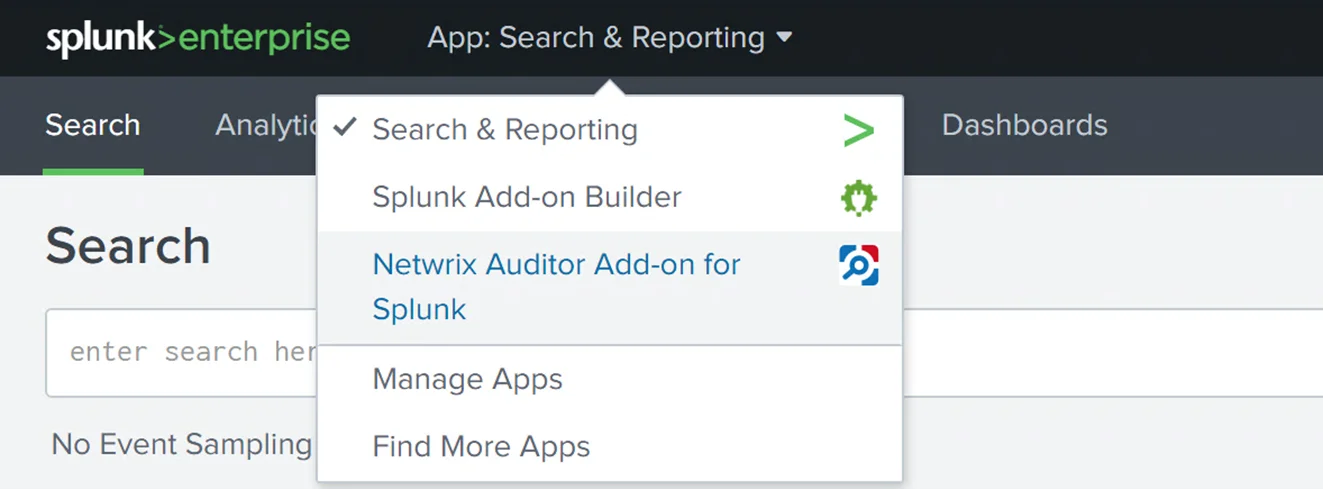
When on any other screen, you can expand the drop-down list at the top panel and choose Manage Apps:

Step 3 – On the Apps screen, click Install app from file:

Step 4 – Click Choose File, navigate to the folder where you unpacked the add-on package, select the "TA-netwrix-auditor-add-on-for-splunk-1.6.1.spl" file and click Open.
Step 5 – Click Upload.
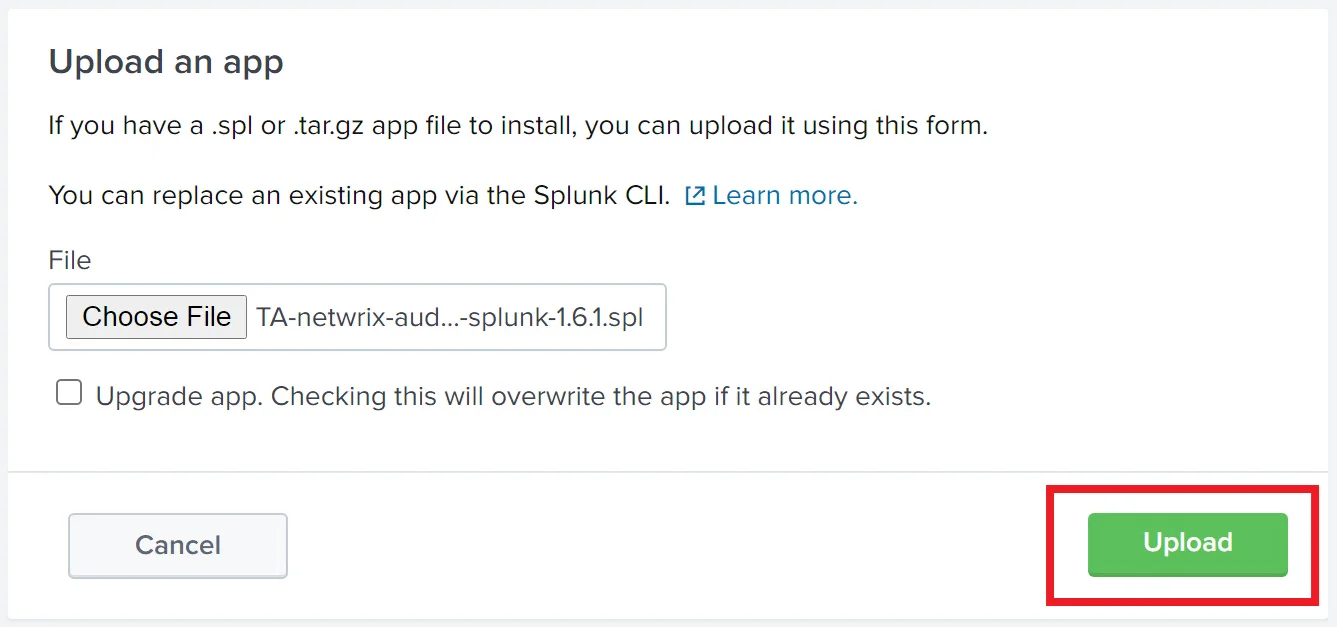
The Upload button text will change to "Processing…". When the installation is complete, you will see an invitation to reboot Splunk. This is optional unless you plan to create index configuration in the add-on folder. In addition, Splunk might not display add-on icon until restart.
The installed add-on should appear in the Apps list in Splunk.
Prepare for Using Netwrix Auditor Integration API
Make sure you have the following information required for the add-on configuration:
- User name and password for the account you will be using to access the Netwrix Auditor Integration API
- Netwrix Auditor Integration API host name or IP address
- TCP port used by Integration API (default port is 9699)
Configure the Add-on
Follow the steps to configure the add-on.
Step 1 – From the Explore Splunk Enterprise or from the drop-down list on the top Splunk panel, open Netwrix Auditor add-on for Splunk and navigate to the Configuration page:
![]()
Step 2 – Configure the account:
-
On the Configuration page, open the Account section.

-
Click Add and populate the fields:
- For the Account name provide a unique name for the account that will be visible to the add-on users
- In the Username field insert the user name of the account that will be used to access Netwrix Auditor Integration API. If a domain account is used, make sure to use the DOMAIN\User format.
- In the Password field insert the account password
-
Click the Add button. The added account should appear in the list:

Step 3 – Configure the Netwrix Auditor Integration API location:
-
On the Configuration page open the Add-on Settings section:

-
In the Netwrix Auditor API location field provide the host name or IP address of your Netwrix Auditor Integration API host (Netwrix Auditor server).
-
In the Netwrix Auditor API port field provide the TCP port used by Netwrix Auditor Integration API; by default it is 9699.
NOTE: Make sure that your Netwrix Auditor Integration API is configured to use HTTPS protocol.
-
Press the Save button.
Configure Data Input
Splunk uses indexes to store data and manage access to it. While you can send Netwrix Auditor data to one of the existing indexes it is strongly recommended to create a separate index.
Follow the steps to configure data input.
Step 1 – Create a new index to store data from Netwrix Auditor:
-
In Splunk expand the Settings drop-down menu and click on the Indexes option under the DATA section.
-
Press the New Index button to create an index.
-
Provide the new index parameters:
-
Index name — this parameter will be used in the search.
-
App — points where the index configuration is stored; Choosing Search & Reporting is recommended.
-
Check if you need to provide custom location for the Home, Cold and Thawed paths. By default they are in the Splunk program folder.
-
Set the Max Size of Entire Index to match the expected volume of logs from Netwrix Auditor.
-
By default, Splunk deletes old events when the size of the index exceeds its max value. If you want Splunk to archive them instead specify the Frozen Path.
Please refer to the Managing Indexers and Clusters of Indexers manual for additional details on indexes.
-
Step 2 – Create a data input:
-
Open Netwrix Auditor add-on for Splunk and go to the Inputs section.

-
Click Create New Input.
-
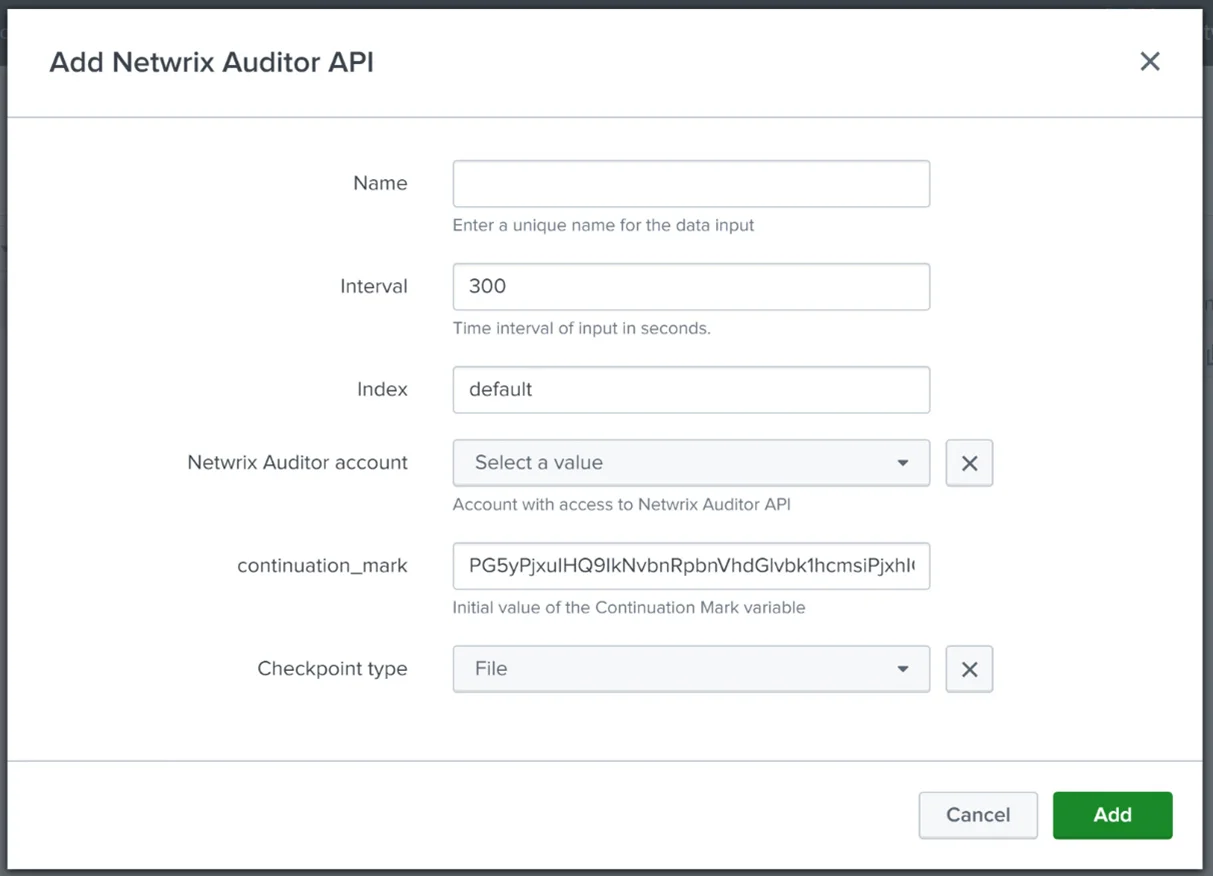
Provide the new data input parameters:
-
Name of the new data input.
-
Set the interval (period) for Splunk to periodically request new data from Netwrix Auditor Integration API. Recommended period is 300 seconds.
-
Select the index that will be used to store the collected data.
-
Select account with access to Netwrix Auditor Integration API.
-
If not following the upgrade procedure, keep the default value for Continuation Mark.
CAUTION: This field should never be empty.
-
Checkpoint type specifies location for continuation mark data. File is the recommended option. Do not change this setting unless advised accordingly by your Splunk Administrator.
-
-
Click the Add button.
Upgrade Procedure
If you were using the older (Windows event log-based) version of Netwrix Auditor add-on for Splunk and plan to migrate to the new version, remember to take the additional steps described below. They will help to ensure imported data consistency and avoid excessive operations. Otherwise, the new add-on will pull Netwrix Auditor’s activity data that had already been imported into your Splunk system by the old add-on.
Follow the steps to upgrade the add-on.
Step 1 – Stop the old version of Netwrix Auditor add-on for Splunk. You can do this with the Windows Scheduled Tasks.
Step 2 – Locate the Netwrix_Auditor_Activity_Records_to_Event_Log_Add-on_Cookie.bin file in the installation directory of the old add-on for Splunk. Store that file content to a safe location.
Step 3 – Install the new add-on. When prompted for Continuation Mark, enter that NetwrixAuditor Activity_Records_to_Event_Log_Add-on_Cookie.bin file content.
Splunk
Netwrix Auditor is a visibility platform for user behavior analysis and risk mitigation that enables control over changes, configurations and access in hybrid IT environments to protect data regardless of its location. The platform provides security analytics to detect anomalies in user behavior and investigate threat patterns before a data breach occurs.
Splunk is a log management solution that enables search and visualization of data collected from the company's IT assets.
Netwrix Auditor add-on for Splunk works as an integration solution for both products: it instructs Splunk to pull the audit data collected by Netwrix Auditor and stored to the audit databases in Netwrix-compatible form (activity records). This data is saved in the event log format recognized by Splunk and also mapped to the CIM data models — for normalization and better correlation with other log sources. With that automated flow, you can use Splunk Enterprise as your single pane of glass for aggregated data analysis. This makes the IT infrastructure monitoring more efficient and helps you keep tabs on your IT assets.
The major benefits- are:
- Aggregated audit data from the variety of sources available from a single console
- Efficient search through the audit data
Compatibility notice
Netwrix Auditor add-on for Splunk is compatible with the following products:
- Splunk Enterprise 8.0.6 and 8.2.1
- Netwrix Auditor 9.96 and above
Supported data sources
Netwrix Auditor add-on for Splunk supports and provides CIM data models mapping for the following Netwrix Auditor data sources:
| Netwrix Auditor data source | CIM Data Model |
|---|---|
| Active Directory | Authentication Change |
| Exchange | Change Email |
| Exchange Online | Change Email |
| File Servers | Change Endpoint |
| Microsoft Entra ID | Authentication Change |
| SharePoint | Change |
| SharePoint Online | Change |
| SQL Server | Authentication Change |
| VMware | Authentication Change |
| Windows Server | Change |
See CIM Data Model Mapping for details.
How It Works
Netwrix Auditor add-on for Splunk allows pulling activity records data from the Netwrix Auditor via its Integration API. Data is retrieved in JSON format, transferred over HTTPS and stored to Splunk index.
To learn more about Netwrix Auditor activity records, see the Activity Records topic for additional information.
For this data to be provided to Splunk, it adds a new Splunk source type, performing additional data parsing and field extraction. The audit data is also mapped into the Common Information Model (CIM) data models — for normalization and better correlation with other log sources.
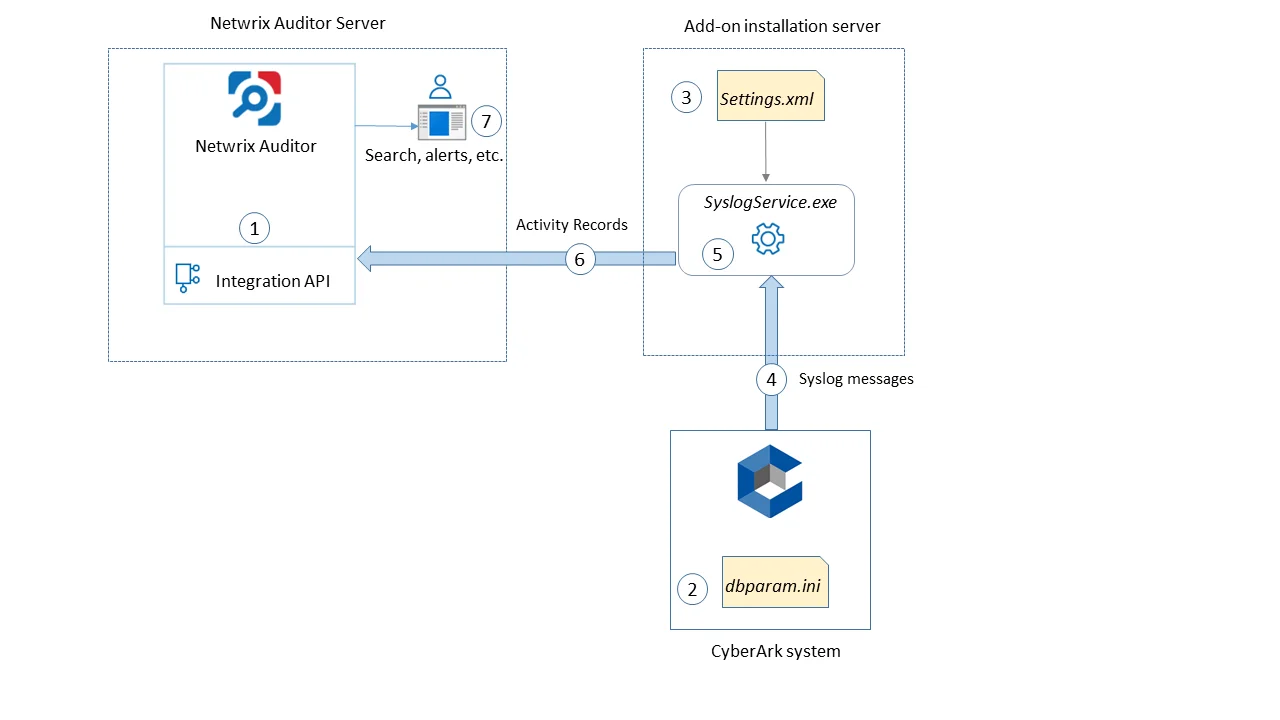
On a high level, the solution works in the following steps.
Step 1 – An IT administrator configures Netwrix Auditor Integration API settings to enable sharing Netwrix Auditor data with external applications.
Step 2 – On the Splunk side, the IT administrator installs and configures the add-on, providing the necessary parameters for its operation: Netwrix Auditor Integration API host and account to access it with sufficient access rights.
Step 3 – The IT administrator prepares a Splunk index to store the data that will be collected from Netwrix Auditor.
Step 4 – Splunk starts pulling activity records via Netwrix Auditor Integration API by sending POST requests with Continuation Mark. Data is received in JSON format and stored in the specified Splunk index — to make it available for further search by Splunk.
Step 5 – When search is performed, Splunk attempts to extract additional information available in the audit data and to map it to CIM data models.
User opens Splunk Enterprise to work with collected data:
- Search for the activity records in the specified index or data model
- Create reports and dashboards in Splunk
Report and dashboard creation in Splunk is outside the scope of this guide.
Add-on delivery package
Netwrix Auditor add-on for Splunk delivery package is a ZIP archive that includes the following files:
| File name | Description |
|---|---|
| ta-netwrix-auditor-add-on-for- splunk-1.6.1.spl | Netwrix Auditor add-on for Splunk package. |
Prerequisites
Before running the add-on, ensure that all the necessary components and policies are configured as follows:
| On... | Ensure that... |
|---|---|
| Auditor Server side | - Auditor version is 9.8 or later. - The Audit Database settings are configured in Auditor Server. See the Prerequisites and Audit Database topics for additional information. - The TCP 9699 port (default Auditor Integration API port) is open for inbound connections. - The user retrieving data from the Audit Database is granted the Global reviewer role in Auditor or is a member of the Netwrix Auditor Client Users group. See the Role-Based Access and Delegation topic for additional information. Alternatively, you can grant the Global administrator role or add the user to the Netwrix Auditor Administrators group. In this case, this user will have the most extended permissions in the product. |
| Splunk Enterprise | - Splunk version is 8.0.6 or higher. - Splunk Common Information Model add-on version 4.17.0 or higher. - Splunk Administrator or any other account with permissions to add add-ons, create indexes and data inputs. - The TCP 9699 port must be open on firewalls between Splunk and Netwrix Auditor server. |
Considerations and limitations
- If the information is not available in the activity record received from Auditor, it will also not be available in Splunk.
- CIM might not have data models for some of the activity records received from Auditor; such information can only be accessed in Splunk using search by index.
Maintenance and Troubleshooting
Splunk records service logs to the _internal index. Follow the steps to troubleshoot data input from Netwrix Auditor API:
Step 1 – Navigate to the Search page of the add-on or Search & Reporting Splunk app.
Step 2 – Enter the search command:
index=_internal "<data_input_name>"
For example:
index=_internal "<netwrix_data_input>"
Step 3 – Press the Last 24 hours button and choose Last 15 minutes time range.
Step 4 – Press the search button; you should see list of the events with Splunk service information.
When the add-on operates normally there should be no errors and the following types of events should appear regularly:
- Regular events from *splunk\ta-netwrix-auditor-add-on-for-splunk_netwrix_auditor_api_input*_ source with POST requests to the Netwrix Auditor API.
- Regular events from *splunk\ta-netwrix-auditor-add-on-for-splunk_netwrix_auditor_api_input*_ source with checkpoint update with new ContinuationMarks received from Netwrix Auditor API.
- Events from *\splunk\metrics.log source with information about indexed volumes.