Active Directory
NOTE: Prior to configuring your monitoring plan, please read and complete the instructions in the following topics:
-
Protocols and Ports Required – To ensure successful data collection and activity monitoring configure necessary protocols and ports for inbound and outbound connections
-
Data Collecting Account – Configure data collecting accounts as required to audit your IT systems
-
Active Directory – Configure data source as required to be monitored
Complete the following fields:
| Option | Description |
|---|---|
| General | |
| Monitor this data source and collect activity data | Enable monitoring of the selected data source and configure Auditor to collect and store audit data. |
| Monitor Active Directory partitions | Select which of your Active Directory environment partitions you want to audit. By default, Auditor only tracks changes to the Domain partition and the Configuration partition of the audited domain. If you also want to audit changes to the Schema partition, or to disable auditing of changes to the Configuration partition, select one of the following: - Domain—Stores users, computers, groups and other objects. Updates to this partition are replicated only to domain controllers within the domain. - Configuration—Stores configuration objects for the entire forest. Updates to this partition are replicated to all domain controllers in the forest. Configuration objects store the information on sites, services, directory partitions, etc. - Schema—Stores class and attribute definitions for all existing and possible Active Directory objects. Updates to this partition are replicated to all domain controllers in the forest. You cannot disable auditing the Domain partition for changes. |
| Detect additional details | Specify additional information to include in reports and activity summaries. Select Group membershipif you want to include Group membership of the account under which the change was made. |
| Specify data collection method | You can enable network traffic compression. If enabled, a Compression Service will be automatically launched on the audited computer, collecting and prefiltering data. This significantly improves data transfer and minimizes the impact on the target computer performance. |
| Configure audit settings | You can adjust audit settings automatically. Your current audit settings will be checked on each data collection and adjusted if necessary. This method is recommended for evaluation purposes in test environments. If any conflicts are detected with your current audit settings, automatic audit configuration will not be performed. Do not select the checkbox if you want to configure audit settings manually. See the Active Directory configuration topic for additional information about audit settings required to collect comprehensive audit data and the instructions on how to configure them. |
| Collect data for state-in-time reports | Configure Auditor to store daily snapshots of your Active Directory domain configuration required for further state-in-time reports generation. See the State–In–Time Reports topic for additional information. The product updates the latest snapshot on the regular basis to keep users up-to-date on actual system state. Only the latest snapshot is available for reporting in Auditor. If you want to generate reports based on different snapshots, you must import snapshots to the Audit Database. For that, in the Manage historical snapshots section, click Manage and select the snapshots that you want to import. To import snapshots, you must be assigned the Global administrator or the Global reviewer role . Move the selected snapshots to the Snapshots available for reporting list using the arrow button. When finished, click OK. |
| Users | |
| Specify monitoring restrictions | Specify user accounts to exclude from data collection (and, therefore, search results, reports and Activity Summaries). To add a user to the exclusion list, click Add, then provide the user name in the domain\user format. Consider the following: - Use NetBIOS format for domain name: mydomain - Some audit data (events) may contain System as the user (initiator) account name. To exclude such data, specify "System" when adding a user name here. In addition to the restrictions for a monitoring plan, you can use the *.txt files to collect more granular audit data. Note that the new monitoring scope restrictions apply together with previous exclusion settings configured in the *.txt files. See the Monitoring Planstopic for additional information. |
| Objects | |
| Specify monitoring restrictions | Specify restrictions for the objects to monitor in your Active Directory. Use them to create the lists of specific objects to include and / or exclude from the monitoring scope (and, therefore, search results, reports and Activity Summaries). The following options are available: - Monitor all objects - Include these objects - Exclude these objects To create a list of inclusions / exclusions, click Add and enter object path using one of the following formats: - Canonical name, for example: mydomain.local/Computers/filesrv01 OR - Object path as shown in the "What" column of reports and search results, for example: \local\mydomain\Computers\filesrv01 You can use a wildcard (*) to replace any number of characters in the path. See the examples below for more information. |
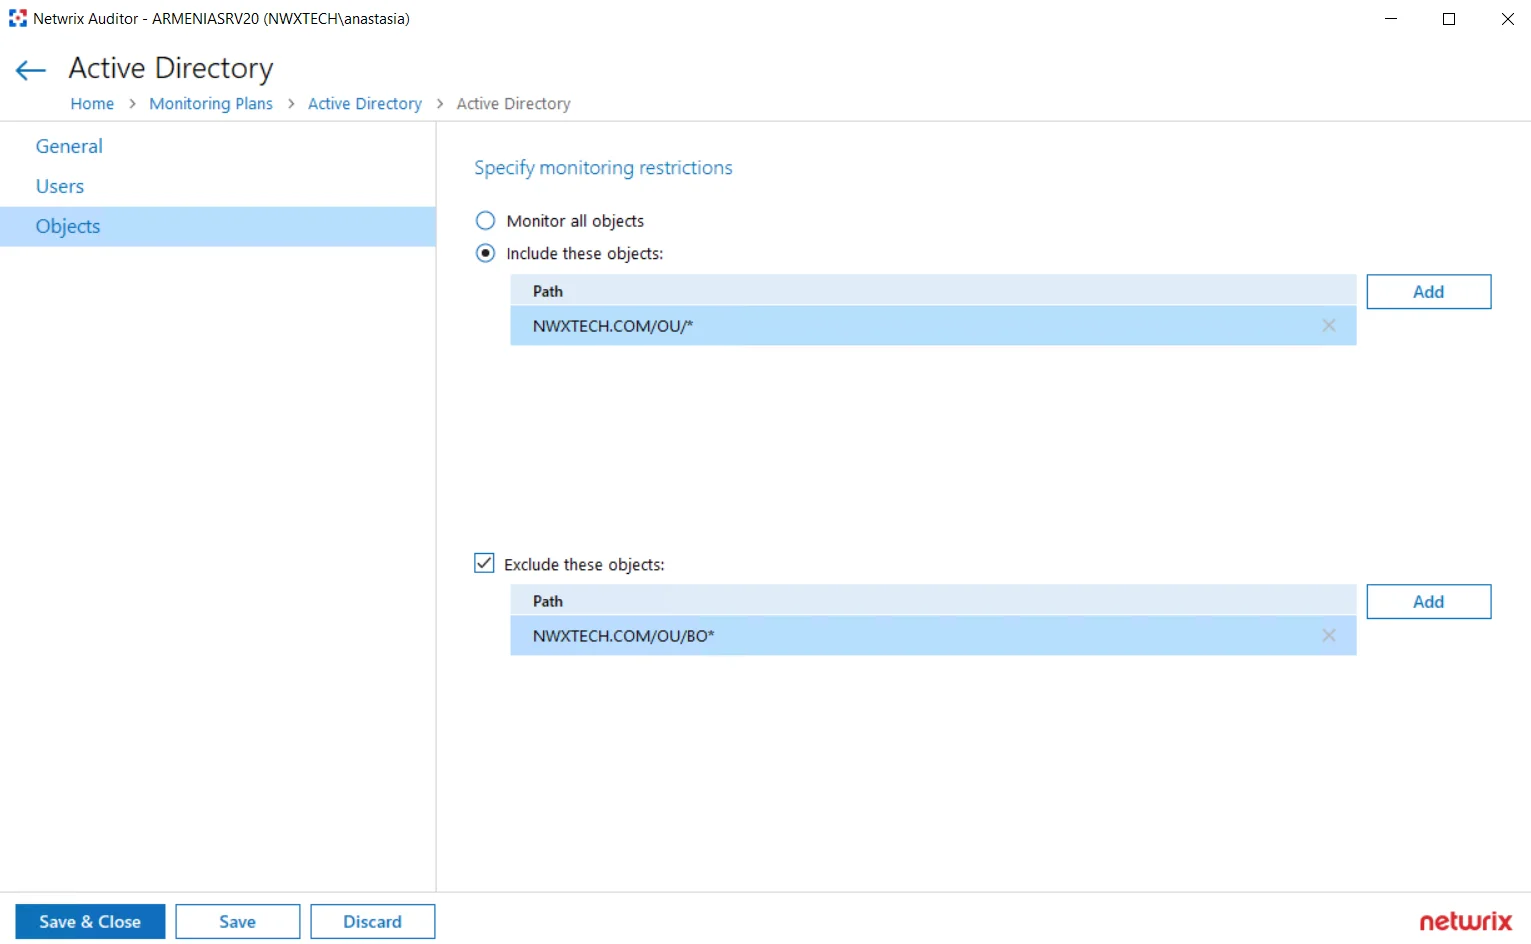
Examples
The following examples explain how the exclusion rules work. Same logic applies to the inclusion rules.
- dc11.local/OU will exclude the OU itself. However, objects within this OU will not be excluded.
- dc11.local/OU/* will exclude objects within the OU. However, the OU itself will not be excluded.
- dc11.local/OU* will exclude the OU itself, all objects within it, and also all objects whose path begins with dc11.local/OU (like dc11.local/OU_HQ).
So, with the settings as in the screenshot above, the program will monitor all objects within the OU, except for the objects whose path begins with enterprise.local/OU/BO. The OU itself, however, will not be monitored, meaning that, for example, its renaming will not be reported.
In addition to the restrictions for a monitoring plan, you can use the *.txt files to collect more granular audit data. Note that the new monitoring scope restrictions apply together with previous exclusion settings configured in the *.txt files. See the Monitoring Planstopic for additional information.
Enable Auditing of Active Directory Partitions
This topic applies to auditing Active Directory only.
Active Directory environment consists of the following directory partitions:
- Domain partition — Stores users, computers, groups and other objects. Updates to this partition are replicated only to domain controllers within the domain.
- Configuration partition — Stores configuration objects for the entire forest. Updates to this partition are replicated to all domain controllers in the forest. Configuration objects store the information on sites, services, directory partitions, etc.
- Schema partition — Stores class and attribute definitions for all existing and possible Active Directory objects. Updates to this partition are replicated to all domain controllers in the forest.
By default, Netwrix Auditor only tracks changes to the Domain partition and the Configuration partition of the audited domain. If you also want to audit changes to the Schema partition, or to disable auditing of changes to the Configuration partition do the following:
You cannot disable auditing the Domain partition for changes.
To enable auditing of the Configuration and Schema partitions
- Navigate to All monitoring plans > your monitoring plan > Active Directory.
- In the right pane, click Configure, next to Advanced Options.
- In the Advanced Options dialog, select Configuration and Schema.
Information on changes to the selected partitions will be available in reports and will be saved in snapshots.
AD Container
Complete the following fields:
| Option | Description |
|---|---|
| General | |
| Specify AD container | Specify a whole AD domain, OU or container. Click Browse to select from the list of containers in your network. You can also: - Select a particular computer type to be audited within the chosen AD container: Domain controllers, Servers (excluding domain controllers), or Workstations. - Click Exclude to specify AD domains, OUs, and containers you do not want to audit. In the Exclude Containers dialog, click Add and specify an object. The list of containers does not include child domains of trusted domains. Use other options (Computer, IP range to specify the target computers. |
| Specify the account for collecting data | Select the account that will be used to collect data for this item. If you want to use a specific account (other than the one you specified during monitoring plan creation), select Custom account and enter credentials. The credentials are case sensitive. Starting with version 9.96, you can use group Managed Service Accounts (gMSA) as data collecting accounts. If using a group Managed Service Account, you can specify only the account name in the domain\account$ format. Password field can be empty. A custom account must be granted the same permissions and access rights as the default account used for data collection. See theData Collecting Account topic for additional information. |
| Containers and Computers | |
| Monitor hidden shares | By default, Auditor will monitor all shares stored in the specified location, except for hidden shares (both default and user-defined). Select Monitor user-defined hidden shares if necessary. Even when this option is selected, the product will not collect data from administrative hidden shares such as: default system root or Windows directory (ADMIN$), default drive shares (D$, E$, etc.), shares used by printers to enable remote administration (PRINT$), etc. |
| Specify monitoring restrictions | Specify restriction filters to narrow your monitoring scope (search results, reports and Activity Summaries). All filters are applied using AND logic. Depending on the type of the object you want to exclude, select one of the following: - Add AD Container – Browse for a container to be excluded from being audited. You can select a whole AD domain, OU or container. - Add Computer – Provide the name of the computer you want to exclude as shown in the "Where" column of reports and Activity Summaries. For example, backupsrv01.mydomain.local. Wildcards (*) are not supported. In addition to the restrictions for a monitoring plan, you can use the *.txt files to collect more granular audit data. Note that the new monitoring scope restrictions apply together with previous exclusion settings configured in the *.txt files. See the Monitoring Planstopic for additional information. |
Domain
Complete the following fields:
| Option | Description |
|---|---|
| Specify Active Directory domain | Specify the audited domain name in the FQDN format. For example, "company.local". |
| Specify the account for collecting data | Select the account that will be used to collect data for this item. If you want to use a specific account (other than the one you specified during monitoring plan creation), select Custom account and enter credentials. The credentials are case sensitive. You can also use group Managed Service Accounts (gMSA) as data collecting accounts. If using a Managed Service Account, you can specify only the account name in the domain\account$ format. Password field can be empty. A custom account must be granted the same permissions and access rights as the default account used for data collection. |
See the Permissions for Active Directory Auditing topic for additional information.
Active Directory Federation Services
NOTE: Prior to configuring your monitoring plan, please read and complete the instructions in the following topics:
-
Protocols and Ports Required – To ensure successful data collection and activity monitoring configure necessary protocols and ports for inbound and outbound connections
-
Data Collecting Account – Configure data collecting accounts as required to audit your IT systems
-
AD FS – Configure data source as required to be monitored
Complete the following fields:
| Option | Description |
|---|---|
| Monitor this data source and collect activity data | Enable monitoring of the selected data source and configure Auditor to collect and store audit data. |
| Schedule AD FS logons collection | Specify period for AD FS logons collection. |
| Specify data collection method | You can enable network traffic compression. If enabled, a Compression Service will be automatically launched on the audited computer, collecting and pre-filtering data. This significantly improves data transfer and minimizes the impact on the target computer performance. |
| Configure audit settings | You can adjust audit settings automatically. Your current audit settings will be checked on each data collection and adjusted if necessary. If any conflicts are detected with your current audit settings, automatic audit configuration will not be performed. Do not select the checkbox if you want to configure audit settings manually. For a full list of audit settings required to collect comprehensive audit data and instructions on how to configure them, refer to AD FS. |
Review your data source settings and click Add to go back to your plan. The newly created data source will appear in the Data source list. As a next step, click Add item to specify an object for monitoring. See the Add Items for Monitoring topic for additional information.
Federation Server
If you are going to audit an entire AD FS farm, consider adding all AD FS server one by one as items to your monitoring plan. Otherwise, your audit scope may contain warnings, errors or incomplete data.
Complete the following fields:
| Option | Description |
|---|---|
| Specify AD FS federation server | Provide a server name by entering its FQDN, NETBIOS or IPv4 address. You can click Browse to select a computer from the list of computers in your network. |
| Specify the account for collecting data | Select the account that will be used to collect data for this item. If you want to use a specific account (other than the one you specified during monitoring plan creation), select Custom account and enter credentials. The credentials are case sensitive. A custom account must be granted the same permissions and access rights as the default account used for data collection. See the Data Collecting Account topic for additional information. |
Data Collecting Account
This is a service account that Auditor uses to collect audit data from the monitored items (domains, OUs, servers, etc.). Netwrix recommends creating a dedicated service account for that purpose. Depending on the data source your monitoring plan will process, the account must meet the corresponding requirements (see the table below).
If you are going to enable integration with Netwrix Data Classification (NDC Provider), additional server roles must be assigned to the account. See Sensitive Data Discovery topic for additional information.
Starting with version 9.96, you can use group Managed Service Account (gMSA) as data collecting account. Currently, the following data sources are supported: Active Directory (also for Group Policy and Logon Activity), Windows Server, File Server (currently for Windows File Servers), SQL Server, SharePoint.
For more details about gMSA usage, see the Use Group Managed Service Account (gMSA)topic for additional information.
The gMSA should also meet the related requirements (see the table below).
Update Credentials for Account
Once a Data Collecting Account has been configured, you can always update the password for this account in Netwrix Auditor.
Follow the steps to update credentials for the accounts used by Auditor:
Step 1 – On the Auditor home page, navigate to Settings.
Step 2 – Locate the General tab.
Step 3 – Click the Manage button under Accounts and Passwords.
Step 4 – Select an account you want to update the password for.
Step 5 – Review the account configuration scope and click Update password next to this account.
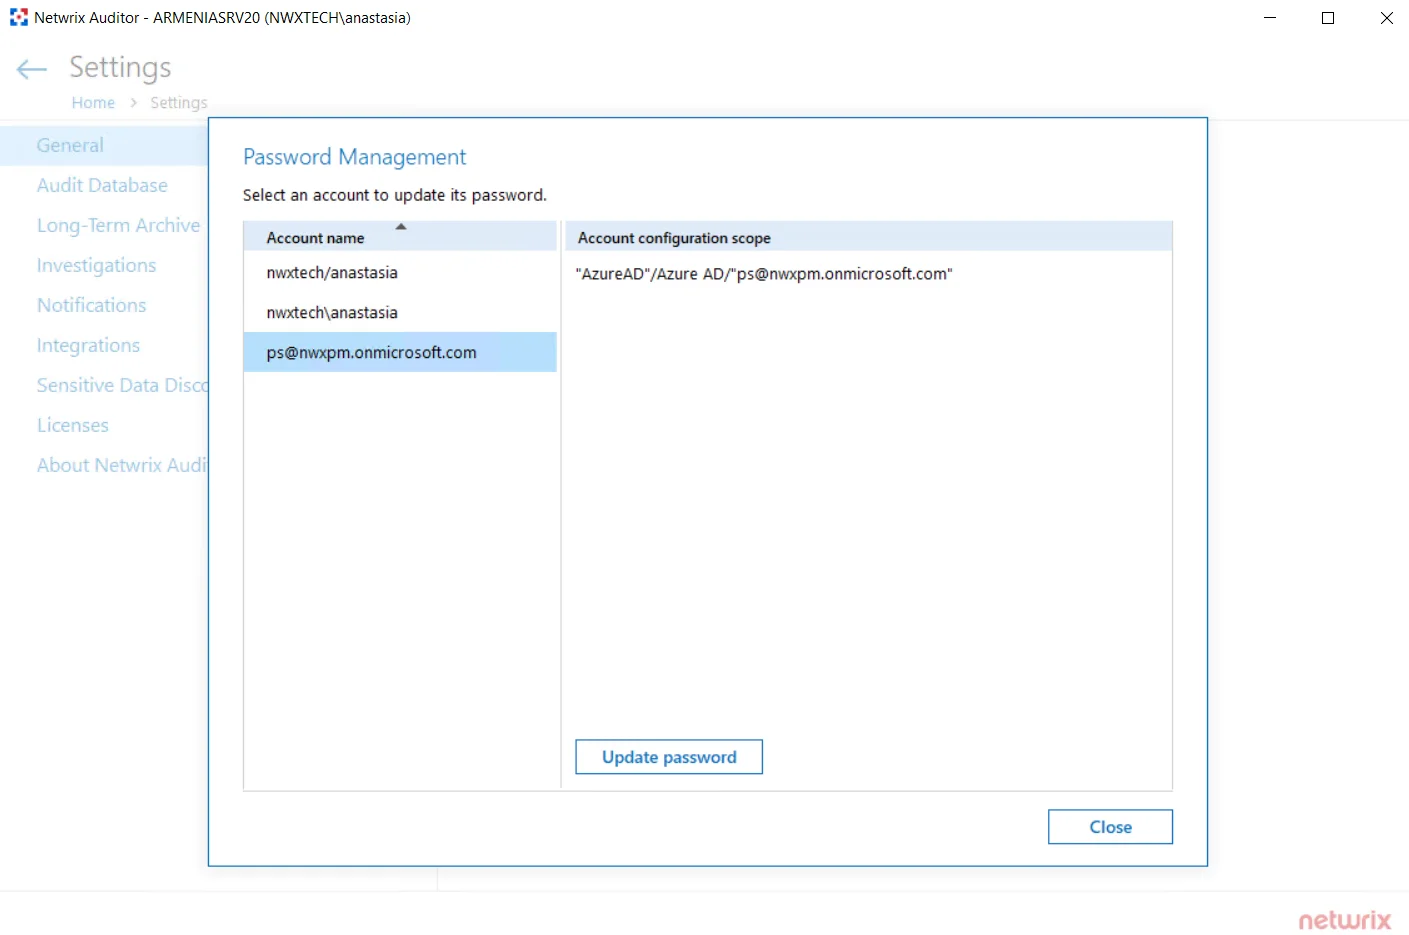
Step 6 – Save your edits.
See the General topic for additional information.
Manage Data Sources
You can fine-tune data collection for each data source. Settings that you configure for the data source will be applied to all items belonging to that data source. Using data source settings, you can, for example:
- Enable state-in-time data collection (currently supported for several data sources)
- Depending on the data source, customize the monitoring scope (e.g., enable read access auditing, monitoring of failed attempts)
To add, modify and remove data sources, enable or disable monitoring, you must be assigned the Global administrator role in the product or the Configurator role on the plan. See the Role-Based Access and Delegation topic for additional information.
Modify Data Source Settings
Follow the steps to modify data source settings.
Step 1 – Select the monitoring plan you need and click Edit.
Step 2 – Within the monitoring plan window, highlight the data source (the first one is the row right under the blue table header) and click Edit data source on the right:
Step 3 – Modify data source settings as you need.
Step 4 – When finished, click Save.
Review the following for additional information:
- Active Directory
- Active Directory Federation Services
- Microsoft Entra ID
- Exchange
- Exchange Online
- File Servers
- Group Policy
- Logon Activity
- MS Teams
- Network Devices
- Oracle Database
- SharePoint
- SharePoint Online
- SQL Server
- User Activity
- VMware
- Windows File Share
Also, you can add a data source to the monitoring plan, or remove a data source that is no longer needed.
Add a Data Source to an Existing Plan
Follow the steps to add a data source to existing plan.
Step 1 – Select the monitoring plan you need and click Edit.
Step 2 – In the right pane, select Add data source.
Step 3 – Specify a data source.
Step 4 – Configure settings specific to your data source.
Step 5 – When finished, click the Add button to save the settings.
Add Items for Monitoring
Once you completed monitoring plan wizard and specified data sources, add items for monitoring. You can add as many items for a data source as you want. In this case, all items will share settings you specified for this data source.
Each data source has a dedicated item type. Netwrix Auditor automatically suggests item types associated with your data source.
| Data Source | Item |
|---|---|
| Active Directory Group Policy Exchange Logon Activity | Domain |
| Active Directory Federation Services | Federation Server |
| Microsoft Entra ID Exchange Online SharePoint Online Microsoft Teams | Microsoft Entra ID |
| File Servers (including Windows file server, Dell, NetApp, Nutanix File server, Synology, and Qumulo) | AD Container Computer Dell Isilon Dell VNX VNXe File Servers NetApp Windows File Share Nutanix SMB Shares Qumulo Synology By default, Auditor will monitor all shares stored in the specified location, except for hidden shares (both default and user-defined). If you want to monitor user-defined hidden shares, select the related option in the monitored item settings. Remember that administrative hidden shares like default system root or Windows directory (ADMIN$), default drive shares (D$, E$), etc. will not be monitored. See the topics on the monitored items for details. |
| Network Devices | Syslog Device Cisco Meraki Dashboard |
| Oracle Database | Oracle Database Instance |
| SharePoint | SharePoint Farm |
| SQL Server | SQL Server Instance SQL Server Availability Group |
| VMware | VMware ESX/ESXi/vCenter |
| Windows Server User Activity | Computer AD Container File Servers |
| Netwrix API | Integration API |
To add, modify and remove items, you must be assigned the Global administrator role in the product or the Configurator role on the plan. See the Role-Based Access and Delegationtopic for additional information.
Follow the steps to add a new item to a data source:
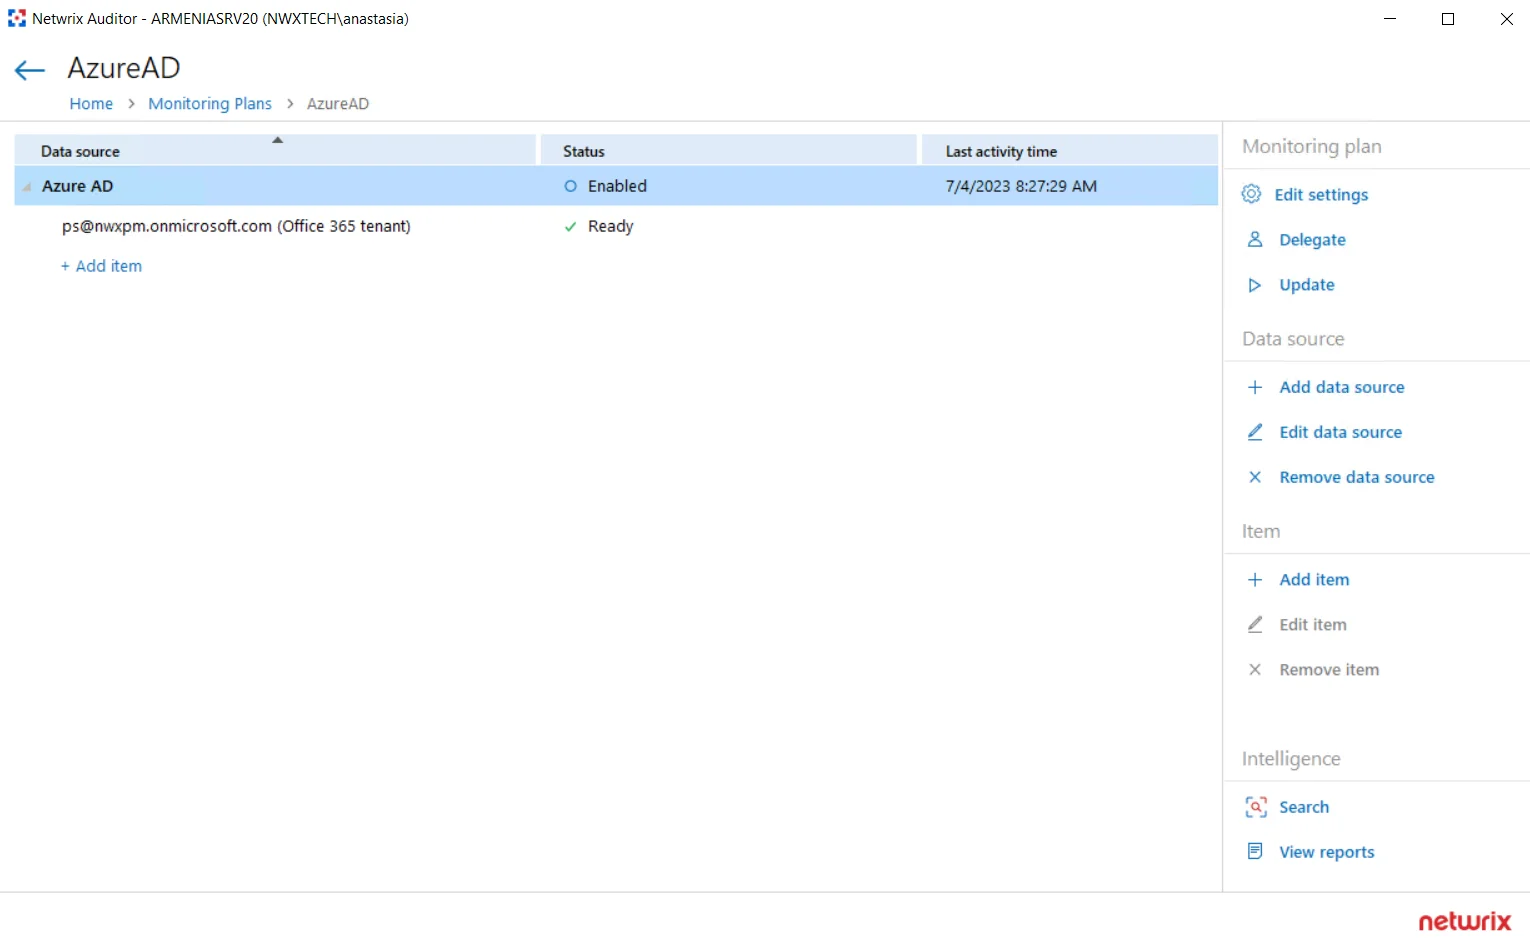
Step 6 – Navigate to your plan settings.
Step 7 – Click Add item under the data source.
Step 8 – Provide the object name and configure item settings.
You can fine-tune data collection for each item individually. To do it, select an item within your monitoring plan and click Edit item. For each item, you can:
- Specify a custom account for data collection
- Customize settings specific your item (e.g., specify SharePoint site collections)
Configure Monitoring Scope
In some environments, it may not be necessary to monitor the entire IT infrastructure. Netwrix monitoring scope can be configured on the Data Source and/or Item levels. the section below contains examples on how to use omit functionality in Auditor.
In addition to the restrictions for a monitoring plan, you can use the *.txt files to collect more granular audit data. Note that the new monitoring scope restrictions apply together with previous exclusion settings configured in the *.txt files. See the Monitoring Planstopic for additional information.
| Use case | Related documentation |
|---|---|
| Active Directory | |
| I want to omit all activity by a specific service account or service accounts with specific naming pattern. | Active Directory |
| If Netwrix user is responsible just for a limited scope within corporate AD, s/he needs to omit everything else. | Active Directory - Always both activity and state in time data are omitted. - In group/Not in group filters don’t not process groups from omitted OUs. |
| Logon Activity | |
| I want to omit domain logons by a specific service account or service accounts with specific naming pattern. | Logon Activity |
| File Servers (including Windows file server, Dell, NetApp, Nutanix File server) | |
| I have a server named StationWin16 where I can't install .Net 4.5 in OU where I keep all member servers. I want to suppress errors from this server by excluding it from the Netwrix auditing scope. | AD Container |
| A Security Officer wants to monitor a file share but s/he does not have access to a certain folder on this share. Then, s/he does not want the product to monitor this folder at all. | Computer Dell Isilon Dell VNX VNXe NetApp Windows File Share Nutanix SMB Shares |
| A Security Officer wants to monitor a file share but s/he does not have access to a certain folder on this share. Then, s/he does not want the product to monitor this folder at all. | Computer Dell Isilon Dell VNX VNXe NetApp Windows File Share Nutanix SMB Shares |
| A Security Officer wants to monitor a file share, but it contains a folder with a huge amount of objects, so s/he does not want Netwrix Auditor to collect State-in-Time data for this folder. | Computer Dell Isilon Dell VNX VNXe NetApp Windows File Share Nutanix SMB Shares |
| I want to exclude specific computers within an IP range from the Netwrix auditing scope. | File Servers |
| SQL Server | |
| I want to know if corp\administrator user is messing with SQL data. | SQL Server Instance |
| As a Auditor administrator I want to exclude the domain\nwxserviceaccount service account activity from SQL server audit so that I get reports without changes made by automatic systems. | SQL Server Instance |
| As a Auditor administrator I want to exclude all changes performed by MyCustomTool. | SQL Server Instance |
| SharePoint | |
| I want to exclude the domain\nwxserviceaccount account from data collection as it produces standard activity that doesn't require monitoring. | SharePoint Farm |
| As a Auditor Administrator I want to exclude shared PublicList from read audit. | SharePoint Farm |
| Windows Server | |
| I have a server named StationWin16 where I can't install .Net 4.5 in OU where I keep all member servers. I want to suppress errors from this server by excluding it from the Netwrix auditing scope. | AD Container |
| I want to exclude specific computers within an IP range from the Netwrix auditing scope. | File Servers |
| VMware | |
| I have a virtual machine named "testvm" I use for testing purposes, so I want to exclude it from being monitored. | VMware ESX/ESXi/vCenter |
Exchange
NOTE: Prior to configuring your monitoring plan, please read and complete the instructions in the following topics:
-
Protocols and Ports Required – To ensure successful data collection and activity monitoring configure necessary protocols and ports for inbound and outbound connections
-
Data Collecting Account – Configure data collecting accounts as required to audit your IT systems
-
Exchange – Configure data source as required to be monitored
Complete the following fields:
| Option | Description |
|---|---|
| Monitor this data source and collect activity data | Enable monitoring of the selected data source and configure Auditor to collect and store audit data. |
| Detect additional details | Specify additional information to include in reports and activity summaries. Select Group membershipif you want to include Group membership of the account under which the change was made. |
| Specify data collection method | You can enable network traffic compression. If enabled, a Compression Service will be automatically launched on the audited computer, collecting and prefiltering data. This significantly improves data transfer and minimizes the impact on the target computer performance. |
| Configure audit settings | You can adjust audit settings automatically. Your current audit settings will be checked on each data collection and adjusted if necessary. This method is recommended for evaluation purposes in test environments. If any conflicts are detected with your current audit settings, automatic audit configuration will not be performed. Do not select the checkbox if you want to configure audit settings manually. See the Exchange configuration topic for additional information about audit settings required to collect comprehensive audit data and the instructions on how to configure them. |
| Collect data on non-owner access to mailboxes | Enable monitoring of unauthorized access to mailboxes within your Exchange Online organization. Configure the following: - Notify users if someone gained access to their mailboxes — Select this checkbox if you want to notify users on non-owner access events to their mailboxes. - Notify only specific users — Select this checkbox and click Add Recipient to specify the list of users who will receive notifications on non-owner access to their mailboxes. Users not included in this list will not be notified. - Enable automatic audit configuration— If any conflicts are detected with your current audit settings, automatic audit configuration will not be performed. See the Exchange and Exchange Online topics for additional information about the audit settings required for Auditor to collect comprehensive audit data and instructions on how to configure them. If you select to automatically configure audit in the target environment, your current audit settings will be checked on each data collection and adjusted if necessary. |
Review your data source settings and click Add to go back to your plan. The newly created data source will appear in the Data source list. As a next step, click Add item to specify an object for monitoring. See the Add Items for Monitoring topic for additional information.
Domain
Complete the following fields:
| Option | Description |
|---|---|
| Specify Active Directory domain | Specify the audited domain name in the FQDN format. For example, "company.local". |
| Specify the account for collecting data | Select the account that will be used to collect data for this item. If you want to use a specific account (other than the one you specified during monitoring plan creation), select Custom account and enter credentials. The credentials are case sensitive. You can also use group Managed Service Accounts (gMSA) as data collecting accounts. If using a Managed Service Account, you can specify only the account name in the domain\account$ format. Password field can be empty. A custom account must be granted the same permissions and access rights as the default account used for data collection. |
See the Permissions for Exchange Auditing topic for additional information.
Exchange Online
NOTE: Prior to configuring your monitoring plan, please read and complete the instructions in the following topics:
-
Protocols and Ports Required – To ensure successful data collection and activity monitoring configure necessary protocols and ports for inbound and outbound connections
-
Data Collecting Account – Configure data collecting accounts as required to audit your IT systems
-
Exchange Online – Configure data source as required to be monitored
How to Add Office365 Item
This instruction shows how to collect audit data from the Office365 organization. See the Configuring Microsoft Entra ID App for Auditing Microsoft Entra ID topic for additional information on how to prepare Microsoft Entra ID app with required permissions. Make sure you have the following at hand:
- Tenant name
- Application (client) ID
- Application secret
Types of data that can be collected by Netwrix Auditor from the Office 365 organization depend on the authentication option you choose.
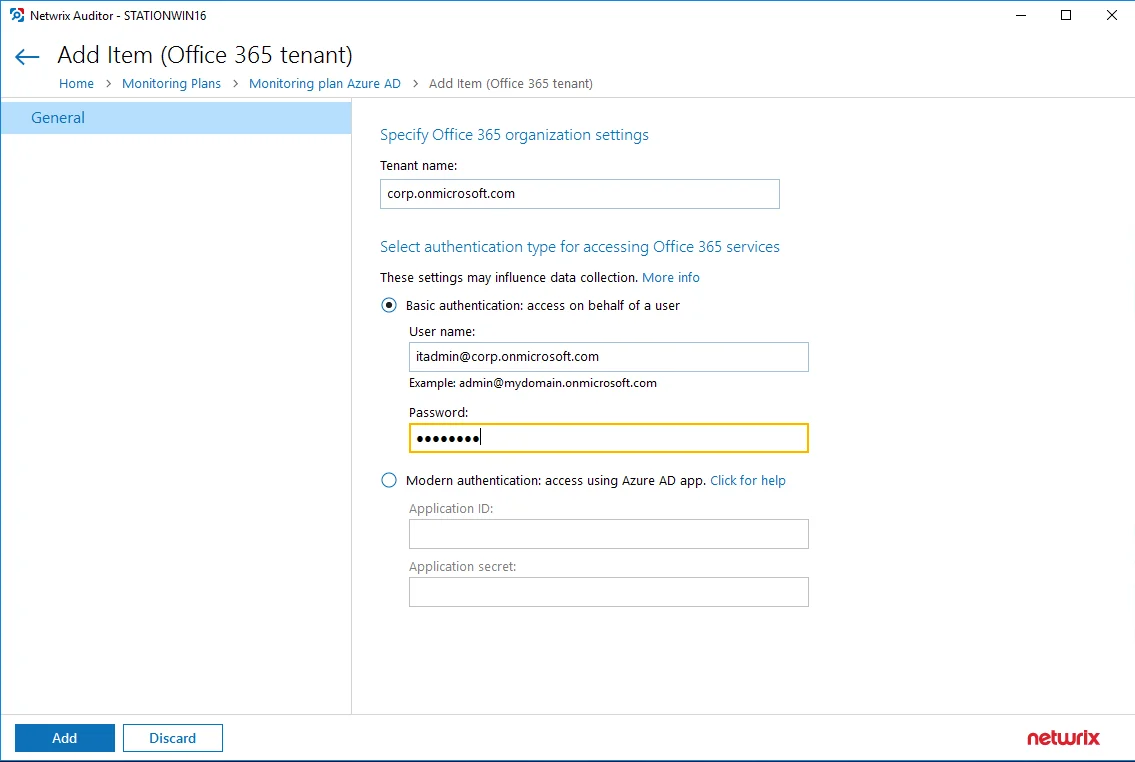
Follow the steps to configure Microsoft 365 tenant as a monitored item.
Step 1 – On the General page of the item properties, specify Tenant name:
-
If you are going to use Basic authentication, you can proceed to the next step – Tenant name will be filled in automatically after it.
-
NOTE: Basic authentication is no longer possible for Exchange Online. For the already existing tenants it is still possible to use basic authentication for SharePoint Online and Microsoft Entra ID monitoring.
-
If you are going to use Modern authentication, paste the obtained name. See the Using Modern Authentication with Microsoft Entra ID topic for additional information.
Step 2 – Select authentication method that will be used when accessing Microsoft 365 services:
-
Basic authentication:
- Selected, Microsoft 365 organization will be accessed on behalf of the user you specify.
- Enter User name and password; use any of the following formats: user@domain.com or user@domain.onmicrosoft.com.
- The Tenant name field then will be filled in automatically.
- Make sure this user account has sufficient access rights. See Using Basic Authentication with Microsoft Entra ID topic for additional information.
-
Modern authentication:
-
Selected, Microsoft 365 organization will be accessed using the Microsoft Entra ID (formerly Azure AD) app you prepared. Enter:
-
Application ID;
- Application secret.
-
-
See the Using Modern Authentication with Microsoft Entra ID for additional information.
-
Step 3 – Click the Add button.
You can use a single account to collect audit data for different Microsoft 365 services (Microsoft Entra ID, Exchange Online, SharePoint Online); however, Netwrixrecommends that you specify individual credentials for each of them.
If you plan to collect and report on the audit data for Exchange Online non-owner mailbox access, consider that the value shown in the “Who” field in reports and search results will be displayed in UPN format (unlike the earlier Netwrix Auditor versions). This refers to the following scenarios:
-
All new installations
-
Upgrade from the previous versions if:
-
Modern authentication is selected in the item settings after the upgrade.
OR
-
Modern authentication has ever been selected in the item settings and reverted back to Basic later
-
Step 4 – Complete the following fields:
| Option | Description |
|---|---|
| Monitor this data source and collect activity data | |
| Configure audit settings | See the Exchange Online configuration topic for additional information about audit settings required to collect comprehensive audit data and the instructions on how to configure them. |
| Collect data for state-in-time reports | Configure Netwrix Auditor to store daily snapshots of your system configuration required for further state-in-time reports generation. See the State–In–Time Reports topic for additional information. |
| Collect data on non-owner access to mailboxes |
Review your data source settings and click Add to go back to your plan. The newly created data source will appear in the Data source list. As a next step, click Add item to specify an object for monitoring. See the Add Items for Monitoring topic for additional information.
Step 5 – See the Exchange Online Monitoring Scope topic for additional information.
File Servers
NOTE: Prior to configuring your monitoring plan, please read and complete the instructions in the following topics:
-
Protocols and Ports Required – To ensure successful data collection and activity monitoring configure necessary protocols and ports for inbound and outbound connections
-
Data Collecting Account – Configure data collecting accounts as required to audit your IT systems
-
File Servers – Configure data source as required to be monitored
Complete the following fields:
| Option | Description | | -------------------------------------------------- | -------------------------------------------------------------------------------------------------------------------------------------------------------------------------------------------------------------------------------------------------------------------------------------------------------------------------------------------------------------------------------------------------------------------------------------------------------------------------------------------------------------------------------------------------------------------------------------------------------------------------------------------------------------------------------------------------------------------------------------------------------------------------------------------------------------------------------------------------------------------------------------------------------------------------------------------------------------------------------------------------------------------------------------------------------------------------------------------------------------------------------------------------------------------------------------------------------------------------------------------------------------------------------------------------------------------------------------------------------------------------------------------------------------------------------------------------------------------------------------------------------------------------------------------------------------------------------------------------------------------------------------------------------------------------------------------------------------------------------------------------------------------------------------------------------------------------------------------------------------------------------------------------------------------------------------------------------------------------------------------------------------------------------------------------------------------------------------------------- | ----------- | ---------- | ----------- | ------------ | ------------- | --------- | ---------- | --- | --- | ---------- | ------------------------------------------------------------------------------------------------------------------------------------ | --- | ------ | --------------------------------------------------------------------------------------------------------------------------------------------------------------------- | --- | ----------- | ------- | --- | ---------- | -------------------------------------------------------------------------------------------------------------------------------------------------------------------------------------------------------------------------------------------------------------------------------------------------------------------------------------------------- | --- | ------ | ------------------------------------------------------------------------------------------------------------------------------------------------------------------------------------------------------------------------------------------------------------------------------------------------------- | ------------------------------------------------------------------------------------------------------------------------------------------------------------------------------------------------------------------------------------------------------------------- | ---------------------- | --- | --- | --- | --- | --- | --- | --- | ----------- | --- | --- | --- | --- | --- | --- | --- | ----------------------------------- | --- | --- | --- | --- | --- | --- | --- | ----------------------------------------- | --- | --- | --- | --- | --- | --- | --- | ------------- | --- | --- | --- | --- | --- | --- | --- | | General | | | Monitor this data source and collect activity data | Enable monitoring of the selected data source and configure Auditor to collect and store audit data. | | Specify actions for monitoring | Specify actions you want to track and auditing mode. | | | | --- | --- | | Changes | | | Successful | Use this option to track changes to your data. Helps find out who made changes to your files, including their creation and deletion. | | Failed | Use this option to detect suspicious activity on your file server. Helps identify potential intruders who tried to modify or delete files, etc., but failed to do it. | | Read access | | | Successful | Use this option to supervise access to files containing confidential data intended for privileged users. Helps identify who accessed important files besides your trusted users. Enabling this option on public shares will result in high number of events generated on your file server and the amount of data written to the Long-Term Archive. | | Failed | Use this option to track suspicious activity. Helps find out who was trying to access your private data without proper justification. Enabling this option on public shares will result in high number of events generated on your file server and the amount of data written to the Long-Term Archive. | Actions reported by Auditor vary depending on the file server type and the audited object (file, folder, or share). The changes include creation, modification, deletion, moving, etc. To track the copy action, enable successful read access and change auditing. | | Specify data collection method | You can enable network traffic compression. If enabled, a Compression Service will be automatically launched on the audited computer, collecting and prefiltering data. This significantly improves data transfer and minimizes the impact on the target computer performance. To collect data from 32-bit operating systems, network traffic compression must be disabled. To collect data from Windows Failover Cluster, network traffic compression must be enabled. See the File Servers topic for additional information. | | Configure audit settings | You can adjust audit settings automatically. Your current audit settings will be checked on each data collection and adjusted if necessary. This method is recommended for evaluation purposes in test environments. If any conflicts are detected with your current audit settings, automatic audit configuration will not be performed. Do not select the checkbox if you want to configure audit settings manually. See the Supported Data Sources configuration topic for additional information about audit settings required to collect comprehensive audit data and the instructions on how to configure them. Some settings cannot be configured automatically. The product has the following limitations depending on your file server type. | File Server | SACL Check | SACL Adjust | Policy Check | Policy Adjust | Log Check | Log Adjust | | --- | --- | --- | --- | --- | --- | --- | | Windows | + | + | + | + | + | + | | Dell Celerra\VNX\Unity | + | + | + | — | + | — | | Dell Isilon | n/a | n/a | + | — | n/a | n/a | | NetApp Data ONTAP 7 and 8 in 7-mode | + | + | + | + | + | + | | NetApp Clustered Data ONTAP 8 and ONTAP 9 | + | + | + | + | + | — | | Nutanix Files | n/a | n/a | + | + | n/a | n/a | | | Collect data for state-in-time reports | Configure Auditor to store daily snapshots of your system configuration required for further state-in-time reports generation. See the State–In–Time Reports topic for additional information. When auditing file servers, changes to effective access permissions can be tracked in addition to audit permissions. By default, Combination of file and share permissions is tracked. File permissions define who has access to local files and folders. Share permissions provide or deny access to the same resources over the network. The combination of both determines the final access permissions for a shared folder—the more restrictive permissions are applied. Upon selecting Combination of file and share permissions only the resultant set will be written to the Audit Database. Select File permissions option too if you want to see difference between permissions applied locally and the effective file and share permissions set. To disable auditing of effective access, unselect all checkboxes under Include details on effective permissions. In the Schedule state-in-time data collection section, you can select a custom weekly interval for snapshots collection. Click Modify and select day(s) of week you want your snapshot to be collected. In the Manage historical snapshots section, you can click Manage and select the snapshots that you want to import to the Audit Database to generate a report on the data source's state at the specific moment in the past. You must be assigned the Global administrator or the Global reviewer role to import snapshots. Move the selected snapshots to the Snapshots available for reporting list using the arrow button. The product updates the latest snapshot on the regular basis to keep users up to date on actual system state. Users can also configure Only the latest snapshot is available for reporting in Auditor. If you want to generate reports based on different snapshots, you must import snapshots to the Audit Database. | | Users | | | Specify monitoring restrictions | Select the users to be excluded from search results, reports and Activity Summaries. To add users to the list, click Add and provide user name in the domain\user format: mydomain\user1. - Use NetBIOS domain name format. - To exclude events containing “System” instead of initiator's account name in the “Who” column, enter "System" value to the list. In addition to the restrictions for a monitoring plan, you can use the *.txt files to collect more granular audit data. Note that the new monitoring scope restrictions apply together with previous exclusion settings configured in the *.txt files. See the Monitoring Plans topic for additional information. |
Review your data source settings and click Add to go back to your plan. The newly created data source will appear in the Data source list. As a next step, click Add item to specify an object for monitoring.
| Windows File Server |
| Dell Data storage |
| NetApp storage |
| Nutanix File Server |
By default, Auditor will monitor all shares stored in the specified location, except for hidden shares (both default and user-defined). If you want to monitor user-defined hidden shares, select the related option in the monitored item settings.
Administrative hidden shares like default system root or Windows directory (ADMIN$), default drive shares (D$, E$), etc. will not be monitored. See the Add Items for Monitoring topic for additional information.
Remember, before adding your monitored items, examine the considerations, limitations and recommendations provided in the following sections:
Dell VNX VNXe
Dell VNX, VNXe, Celerra, and Unity NAS devices are collectively referred to as Dell Data Storage.
Complete the following fields:
| Option | Description |
|---|---|
| General | |
| Specify Dell VNX/VNXe, Celerra or Unity storage array | Provide a server name by entering its FQDN, NETBIOS or IPv4 address. You can click Browse to select a computer from the list of computers in your network. |
| Specify the account for collecting data | Select the account that will be used to collect data for this item. If you want to use a specific account (other than the one you specified during monitoring plan creation), select Custom account and enter credentials. The credentials are case sensitive. A custom account must be granted the same permissions and access rights as the default account used for data collection. See the Data Collecting Account topic for additional information. |
| Scope | |
| Monitor hidden shares | By default, Auditor will monitor all shares stored in the specified location, except for hidden shares (both default and user-defined). Select Monitor user-defined hidden shares if necessary. Even when this option is selected, the product will not collect data from administrative hidden shares such as: default system root or Windows directory (ADMIN$), default drive shares (D$, E$, etc.), shares used by printers to enable remote administration (PRINT$), etc. |
| Specify monitoring restrictions | Specify restriction filters to narrow your monitoring scope (search results, reports and Activity Summaries). All filters are applied using AND logic. See the Fine-tune Monitoring Scope for additional information on how to narrow your monitoring scope. In addition to the restrictions for a monitoring plan, you can use the *.txt files to collect more granular audit data. Note that the new monitoring scope restrictions apply together with previous exclusion settings configured in the *.txt files. See the Monitoring Plans topic for additional information. |
Fine-tune Monitoring Scope
To audit all file shares, under Specify monitoring restrictions, select Monitor all file shares in the array.
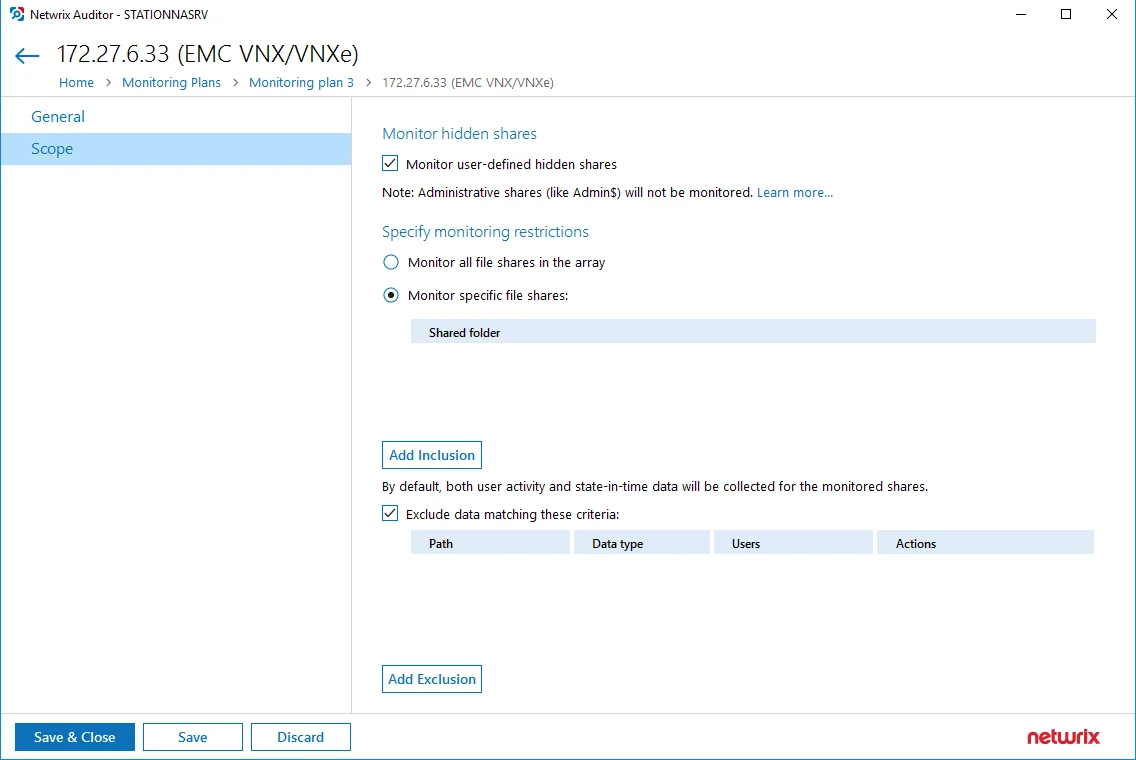
You can also create lists of specific file shares to include and/or exclude from being audited.
Include a File Share
Follow the steps to include a file share.
Step 1 – Under Specify monitoring restrictions, select Specific file shares.
Step 2 – Click Add Inclusion.
Step 3 – Provide UNC path to a shared resource. For example: NewStation\Shared.
Step 4 – Do not specify a default file share mapped to a local drive (e.g., \Server\e$).
Exclude Specific Data
Follow the steps to exclude specific data.
Click Add Exclusion. Then, in the Specify Filters dialog, do the following:
Step 5 – Provide the path to the file share where you are going to exclude some audit data. Use the path format as it appears in the "What" column of reports and Activity Summaries — for example, \corpsrv\shared.
Step 6 – You can use a wildcard (*) only if you need to exclude user activity on this file share. For other data types (state-in-time or all data) wildcards are not supported. This refers to the specified shared folder, its subfolders and files.
Step 7 – Select what type of data you want to exclude:
| Option | Description | Example |
|---|---|---|
| All Data | Select if you want to completely exclude the specified file share from being audited. The product will not collect any user activity or state-in-time data. NOTE: In this case,Auditor does not adjust audit settings automatically for the selected folders. | A Security Officer wants to monitor a file share but s/he does not have access to a certain folder on this share. Thus, s/he configures the product not to monitor this folder at all. |
| State-in-Time | Select to configure Auditor to exclude data for the state-in-time reports from the monitoring scope. | A Security Officer wants to monitor a file share, but it contains a folder with a huge amount of objects, so s/he does not want Auditor to collect state-in-time data for this folder. |
| User Activity | Select to exclude actions performed by specific users on the selected file share. See the procedure below for details. NOTE: In this case, the product still collects stat-in-time data for this share. | A Security Officer wants to monitor a file share that contains a public folder for which s/he does not want to collect Read operations. |
Follow the steps to exclude specific user activity.
Step 1 – Specify what user accounts should be excluded:
- All Users — Select to exclude the activity of any user on the file share you specified.
- These users— Select to exclude specific users' activity. Provide user names as shown in the "Who" column in reports and Activity Summaries, e.g., MyDomain\user1. To enter multiple accounts, use comma as a separator.
Step 2 – Specify what actions should be excluded:
- All actions — Exclude all actions of the selected users
- These actions — Use the drop-down list to select the actions to exclude, e.g. Added and Moved.
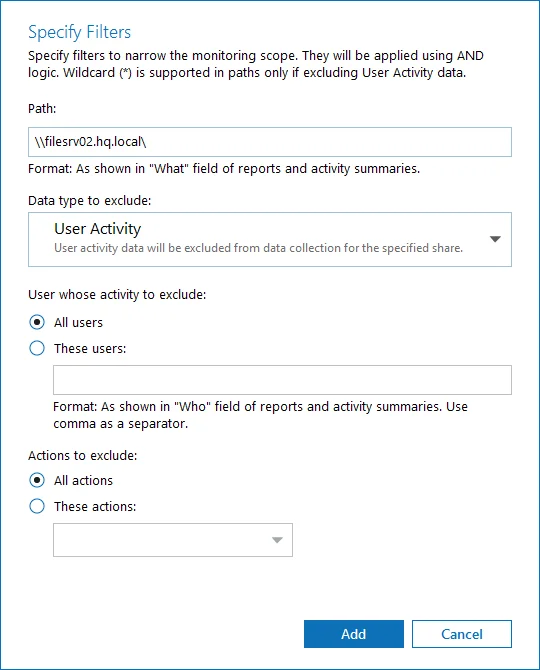
Step 3 – After configuring all filters, click Add to save them and return to the item settings.
Dell Isilon
Complete the following fields:
| Option | Description |
|---|---|
| General | |
| Specify Dell Isilon storage array | Provide the IP address or the host name of the name server used to connect to your access zone. For example, account.corp.lab |
| Access Zone | Enter the name of access zone partition within your EMC Isilon cluster. For example, zone_account |
| OneFS web administration interface URL | Enter Dell Isilon web administration URL (e.g., https://isiloncluster.corp.lab:8080). This URL is used to get configuration details about your Isilon cluster via OneFS API. |
| File Share UNC path to audit logs | Path to the file share located on a Dell Isilon with event log files (e.g., \srv\netwrix_audit$\logs). |
| Specify the account for collecting data | Select the account that will be used to collect data for this item. If you want to use a specific account (other than the one you specified during monitoring plan creation), select Custom account and enter credentials. The credentials are case sensitive. A custom account must be granted the same permissions and access rights as the default account used for data collection. See the Data Collecting Account topic for additional information. |
| Scope | |
| Specify monitoring restrictions | Specify restriction filters to narrow your monitoring scope (search results, reports and Activity Summaries). All filters are applied using AND logic. See the Fine-tune Monitoring ScopeFine-tune Monitoring Scopetopic for additional information about how to narrow your monitoring scope. In addition to the restrictions for a monitoring plan, you can use the *.txt files to collect more granular audit data. Note that the new monitoring scope restrictions apply together with previous exclusion settings configured in the *.txt files. See the Monitoring Plans topic for additional information. |
Configure the Scope
You can configure Netwrix Auditor to audit all file shares except for ones added as exclusions. For that, under Specify monitoring restrictions, select All file shares in the array. You can also create lists of specific file shares to include and/or exclude from being audited. Review the following for additional information:
Add Inclusion
Follow the steps to add inclusion.
Step 1 – Under Specify monitoring restrictions, select Specific file shares.
Step 2 – Click Add Inclusion.
Step 3 – Provide UNC path to a shared resource. For example: NewStation\Shared.
Do not specify a default file share mapped to a local drive (e.g., \Server\e$).
Add Exclusion
Follow the steps to add exclusion.
Click Add Exclusion. Then, in the Specify Filters dialog, do the following:
Step 4 – Provide the path to the file share where you are going to exclude some audit data. Use the path format as it appears in the "What" column of reports and Activity Summaries — for example, \corpsrv\shared.
Step 5 – You can use a wildcard (*) only if you need to exclude user activity on this file share. For other data types (state-in-time or all data) wildcards are not supported. This refers to the specified shared folder, its subfolders and files.
Step 6 – Select what type of data you want to exclude:
| Option | Description | Example |
|---|---|---|
| All Data | Select if you want to completely exclude the specified file share from being audited. The product will not collect any user activity or state-in-time data. NOTE: In this case,Auditor does not adjust audit settings automatically for the selected folders. | A Security Officer wants to monitor a file share but s/he does not have access to a certain folder on this share. Thus, s/he configures the product not to monitor this folder at all. |
| State-in-Time | Select to configure Auditor to exclude data for the state-in-time reports from the monitoring scope. | A Security Officer wants to monitor a file share, but it contains a folder with a huge amount of objects, so s/he does not want Auditor to collect state-in-time data for this folder. |
| User Activity | Select to exclude actions performed by specific users on the selected file share. See the procedure below for details. NOTE: In this case, the product still collects stat-in-time data for this share. | A Security Officer wants to monitor a file share that contains a public folder for which s/he does not want to collect Read operations. |
Follow the steps to exclude specific user activity.
Step 1 – Specify what user accounts should be excluded:
- All Users — Select to exclude the activity of any user on the file share you specified.
- These users— Select to exclude specific users' activity. Provide user names as shown in the "Who" column in reports and Activity Summaries, e.g., MyDomain\user1. To enter multiple accounts, use comma as a separator.
Step 2 – Specify what actions should be excluded:
- All actions — Exclude all actions of the selected users
- These actions — Use the drop-down list to select the actions to exclude, e.g. Added and Moved.
Step 3 – After configuring all filters, click Add to save them and return to the item settings.
NetApp
Complete the following fields:
| Option | Description |
|---|---|
| General | |
| Specify NetApp file server | Provide a server name by entering its FQDN, NETBIOS or IPv4 address. You can click Browse to select a computer from the list of computers in your network. |
| File share UNC path to audit logs | Select one of the following: - Detect automatically—If selected, a shared resource will be detected automatically. - Use this path—UNC path to the file share located on a NetApp Filer with event log files (e.g., \CORP\ETC$\log). |
| Specify the account for collecting data | Select the account that will be used to collect data for this item. If you want to use a specific account (other than the one you specified during monitoring plan creation), select Custom account and enter credentials. The credentials are case sensitive. A custom account must be granted the same permissions and access rights as the default account used for data collection. See the Data Collecting Account topic for additional information. |
| ONTAPI/ONTAP REST API | |
| Specify protocol for accessing ONTAPI/ONTAP REST API | Select one of the following: - Detect automatically—If selected, a connection protocol will be detected automatically. - HTTP - HTTPS Refer to Netwrix Auditor Installation and Configuration Guide for detailed instructions on how to enable HTTP or HTTPS admin access. NOTE: ONTAP REST API works only over HTTPS protocol |
| Specify management interface | Select management interface to connect to ONTAPI/ONTAP REST API. If you want to use custom management interface for ONTAPI/ONTAP REST API, select Custom and provide a server name by entering its FQDN, NETBIOS or IP address. |
| Specify account for connecting to ONTAPI/ONTAP REST API | Select an account to connect to NetApp and collect data through ONTAPI/ONTAP REST API. If you want to use a specific account (other than the one you specified on the General tab), select Custom and enter credentials. The credentials are case sensitive. Take into consideration that even if a custom account is specified, the account selected on the General tab must be a member of the Builtin\Administrators group and have sufficient permissions to access audit logs shared folder and audited shares. Data Collecting Account |
| Scope | |
| Monitor hidden shares | By default, Auditor will monitor all shares stored in the specified location, except for hidden shares (both default and user-defined). Select Monitor user-defined hidden shares if necessary. Even when this option is selected, the product will not collect data from administrative hidden shares such as: default system root or Windows directory (ADMIN$), default drive shares (D$, E$, etc.), shares used by printers to enable remote administration (PRINT$), etc. CAUTION: Monitoring of non-default hidden shares is not supported for NetApp servers in 7-mode. |
| Specify monitoring restrictions | Specify restriction filters to narrow your monitoring scope (search results, reports and Activity Summaries). All filters are applied using AND logic. See the Configure Scope section below for how to narrow your monitoring scope. In addition to the restrictions for a monitoring plan, you can use the *.txt files to collect more granular audit data. Note that the new monitoring scope restrictions apply together with previous exclusion settings configured in the *.txt files. See the Monitoring Plans topic for additional information. |
Configure Scope
You can configure Netwrix Auditor to audit all file shares except for ones added as exclusions. For that, under Specify monitoring restrictions, select All file shares in the array. You can also create lists of specific file shares to include and/or exclude from being audited. Review the following for additional information:
Add Inclusion
Follow the steps to add inclusion.
Step 1 – Under Specify monitoring restrictions, select Specific file shares.
Step 2 – Click Add Inclusion.
Step 3 – Provide UNC path to a shared resource. For example: NewStation\Shared.
NOTE: Do not specify a default file share mapped to a local drive (e.g., \Server\e$).
Add Exclusion
Follow the steps to add exclusion.
Click Add Exclusion. Then, in the Specify Filters dialog, do the following:
Step 4 – Provide the path to the file share where you are going to exclude some audit data. Use the path format as it appears in the "What" column of reports and Activity Summaries — for example, \corpsrv\shared.
Step 5 – You can use a wildcard (*) only if you need to exclude user activity on this file share. For other data types (state-in-time or all data) wildcards are not supported. This refers to the specified shared folder, its subfolders and files.
Step 6 – Select what type of data you want to exclude:
| Option | Description | Example |
|---|---|---|
| All Data | Select if you want to completely exclude the specified file share from being audited. The product will not collect any user activity or state-in-time data. NOTE: In this case,Auditor does not adjust audit settings automatically for the selected folders. | A Security Officer wants to monitor a file share but s/he does not have access to a certain folder on this share. Thus, s/he configures the product not to monitor this folder at all. |
| State-in-Time | Select to configure Auditor to exclude data for the state-in-time reports from the monitoring scope. | A Security Officer wants to monitor a file share, but it contains a folder with a huge amount of objects, so s/he does not want Auditor to collect state-in-time data for this folder. |
| User Activity | Select to exclude actions performed by specific users on the selected file share. See the procedure below for details. NOTE: In this case, the product still collects stat-in-time data for this share. | A Security Officer wants to monitor a file share that contains a public folder for which s/he does not want to collect Read operations. |
Follow the steps to exclude specific user activity.
Step 1 – Specify what user accounts should be excluded:
- All Users — Select to exclude the activity of any user on the file share you specified.
- These users— Select to exclude specific users' activity. Provide user names as shown in the "Who" column in reports and Activity Summaries, e.g., MyDomain\user1. To enter multiple accounts, use comma as a separator.
Step 2 – Specify what actions should be excluded:
- All actions — Exclude all actions of the selected users
- These actions — Use the drop-down list to select the actions to exclude, e.g. Added and Moved.
Step 3 – After configuring all filters, click Add to save them and return to the item settings.
Nutanix Files
NOTE: Prior to configuring your monitoring plan, please read and complete the instructions in the following topics:
- Protocols and Ports Required – To ensure successful data collection and activity monitoring configure necessary protocols and ports for inbound and outbound connections
- Data Collecting Account – Configure data collecting accounts as required to audit your IT systems
Complete the following fields:
| Option | Description | | -------------------------------------------------- | -------------------------------------------------------------------------------------------------------------------------------------------------------------------------------------------------------------------------------------------------------------------------------------------------------------------------------------------------------------------------------------------------------------------------------------------------------------------------------------------------------------------------------------------------------------------------------------------------------------------------------------------------------------------------------------------------------------------------------------------------------------------------------------------------------------------------------------------------------------------------------------------------------------------------------------------------------------------------------------------------------------------------------------------------------------------------------------------------------------------------------------------------------------------------------------------------------------------------------------------------------------------------------------------------------------------------------------------------------------------------------------------------------------------------------------------------------------------------------------------------------------------------------------------------------------------------------------------------------------------------------------------------------------------------------------------------------------------------------------------------------------------------------------------------------------------------------------------------------------------------------------------------------------------------------------------------------------------------------------------------------------------------------------------------------------------------------------------------- | --- | --- | --- | --- | --- | --- | ------- | --- | --- | ---------- | ------------------------------------------------------------------------------------------------------------------------------------ | --- | ------ | --------------------------------------------------------------------------------------------------------------------------------------------------------------------- | --- | ----------- | --- | --- | ---------- | -------------------------------------------------------------------------------------------------------------------------------------------------------------------------------------------------------------------------------------------------------------------------------------------------------------------------------------------------- | --- | ------ | ------------------------------------------------------------------------------------------------------------------------------------------------------------------------------------------------------------------------------------------------------------------------------------------------------- | ------------------------------------------------------------------------------------------------------------------------------------------------------------------------------------------------------------------------------------------------------------------- | | Monitor this data source and collect activity data | Enable monitoring of the selected data source and configure Auditor to collect and store audit data. | | Specify actions for monitoring | Specify actions you want to track and auditing mode. | | | | --- | --- | | Changes | | | Successful | Use this option to track changes to your data. Helps find out who made changes to your files, including their creation and deletion. | | Failed | Use this option to detect suspicious activity on your file server. Helps identify potential intruders who tried to modify or delete files, etc., but failed to do it. | | Read access | | | Successful | Use this option to supervise access to files containing confidential data intended for privileged users. Helps identify who accessed important files besides your trusted users. Enabling this option on public shares will result in high number of events generated on your file server and the amount of data written to the Long-Term Archive. | | Failed | Use this option to track suspicious activity. Helps find out who was trying to access your private data without proper justification. Enabling this option on public shares will result in high number of events generated on your file server and the amount of data written to the Long-Term Archive. | Actions reported by Auditor vary depending on the file server type and the audited object (file, folder, or share). The changes include creation, modification, deletion, moving, etc. To track the copy action, enable successful read access and change auditing. | | Specify data collection method | You can enable network traffic compression. If enabled, a Compression Service will be automatically launched on the audited computer, collecting and prefiltering data. This significantly improves data transfer and minimizes the impact on the target computer performance. | | Configure audit settings | You can adjust audit settings automatically. Your current audit settings will be checked on each data collection and adjusted if necessary. This method is recommended for evaluation purposes in test environments. If any conflicts are detected with your current audit settings, automatic audit configuration will not be performed. Do not select the checkbox if you want to configure audit settings manually. See the Supported Data Sources configuration topic for additional information about audit settings required to collect comprehensive audit data and the instructions on how to configure them. Netwrix Auditor can configure the following settings: - Policy Check - Policy Adjust | | Collect data for state-in-time reports | Configure Auditor to store daily snapshots of your system configuration required for further state-in-time reports generation. See the State–In–Time Reports topic for additional information. When auditing file servers, changes to effective access permissions can be tracked in addition to audit permissions. By default, Combination of file and share permissions is tracked. File permissions define who has access to local files and folders. Share permissions provide or deny access to the same resources over the network. The combination of both determines the final access permissions for a shared folder—the more restrictive permissions are applied. Upon selecting Combination of file and share permissions only the resultant set will be written to the Audit Database. Select File permissions option too if you want to see difference between permissions applied locally and the effective file and share permissions set. To disable auditing of effective access, unselect all checkboxes under Include details on effective permissions. In the Schedule state-in-time data collection section, you can select a custom weekly interval for snapshots collection. Click Modify and select day(s) of week you want your snapshot to be collected. In the Manage historical snapshots section, you can click Manage and select the snapshots that you want to import to the Audit Database to generate a report on the data source's state at the specific moment in the past. You must be assigned the Global administrator or the Global reviewer role to import snapshots. Move the selected snapshots to the Snapshots available for reporting list using the arrow button. The product updates the latest snapshot on the regular basis to keep users up to date on actual system state. Users can also configure Only the latest snapshot is available for reporting in Auditor. If you want to generate reports based on different snapshots, you must import snapshots to the Audit Database. |
Review your data source settings and click Add to go back to your plan. The newly created data source will appear in the Data source list. As a next step, click Add item to specify an object for monitoring. See the Add Items for Monitoring topic for additional information.
Nutanix SMB Shares
Complete the following fields:
| Option | Description |
|---|---|
| General | |
| Specify Nutanix File Server | Provide a server name by entering its FQDN, NETBIOS or IPv4 address. You can click Browse to select a computer from the list of computers in your network. If you need to audit a 3-node cluster, it is recommended to use FQDN or NETBIOS name. |
| Specify the account for collecting data | Select the account that will be used to collect data for this item. If you want to use a specific account (other than the one you specified during monitoring plan creation), select Custom account and enter credentials. A custom account must be granted the same permissions and access rights as the default account used for data collection. See the Data Collecting Account topic for more information. |
| Specify listening port for incoming connections | Provide the name of the TCP port to listen to notifications on the operations with Nutanix file shares. Default is 9898. For details on how to open the port, refer to the Nutanix Ports topic. |
| Nutanix File Server REST API | |
| Specify account for connecting to Nutanix File Server REST API | Specify the account that will be used to connect to Nutanix REST API. This account should have sufficient privileges on the Nutanix File Server. For details, refer to Create User Account to Access Nutanix REST API. |
| Scope | |
| Monitor hidden shares | By default, Netwrix Auditor will monitor all shares stored in the specified location, except for hidden shares (both default and user-defined). Select Monitor user-defined hidden shares if necessary. Even when this option is selected, the product will not collect data from administrative hidden shares such as: default system root or Windows directory (ADMIN$), default drive shares (D$, E$, etc.), shares used by printers to enable remote administration (PRINT$), etc. |
| Specify monitoring restrictions | Specify restriction filters to narrow your monitoring scope (search results, reports and Activity Summaries). All filters are applied using AND logic. Refer to the Configure Scope section below for detailed instructions on how to configure your monitoring scope. Currently, auditing is available for SMB shares only. Auditing of NFS shares is not supported due to known limitations. |
Configure Scope
You can configure Netwrix Auditor to audit all file shares except for ones added as exclusions. For that, under Specify monitoring restrictions, select All file shares in the array. You can also create lists of specific file shares to include and/or exclude from being audited. Review the following for additional information:
Add Inclusion
Follow the steps to add inclusion.
Step 1 – Under Specify monitoring restrictions, select Specific file shares.
Step 2 – Click Add Inclusion.
Step 3 – Provide UNC path to a shared resource. For example: NewStation\Shared.
Do not specify a default file share mapped to a local drive (e.g., \Server\e$).
Add Exclusion
Follow the steps to add exclusion.
Click Add Exclusion. Then, in the Specify Filters dialog, do the following:
Step 4 – Provide the path to the file share where you are going to exclude some audit data. Use the path format as it appears in the "What" column of reports and Activity Summaries — for example, \corpsrv\shared.
Step 5 – You can use a wildcard (*) only if you need to exclude user activity on this file share. For other data types (state-in-time or all data) wildcards are not supported. This refers to the specified shared folder, its subfolders and files.
Step 6 – Select what type of data you want to exclude:
| Option | Description | Example |
|---|---|---|
| All Data | Select if you want to completely exclude the specified file share from being audited. The product will not collect any user activity or state-in-time data. NOTE: In this case,Auditor does not adjust audit settings automatically for the selected folders. | A Security Officer wants to monitor a file share but s/he does not have access to a certain folder on this share. Thus, s/he configures the product not to monitor this folder at all. |
| State-in-Time | Select to configure Auditor to exclude data for the state-in-time reports from the monitoring scope. | A Security Officer wants to monitor a file share, but it contains a folder with a huge amount of objects, so s/he does not want Auditor to collect state-in-time data for this folder. |
| User Activity | Select to exclude actions performed by specific users on the selected file share. See the procedure below for details. NOTE: In this case, the product still collects stat-in-time data for this share. | A Security Officer wants to monitor a file share that contains a public folder for which s/he does not want to collect Read operations. |
Follow the steps to exclude specific user activity.
Step 1 – Specify what user accounts should be excluded:
- All Users — Select to exclude the activity of any user on the file share you specified.
- These users— Select to exclude specific users' activity. Provide user names as shown in the "Who" column in reports and Activity Summaries, e.g., MyDomain\user1. To enter multiple accounts, use comma as a separator.
Step 2 – Specify what actions should be excluded:
- All actions — Exclude all actions of the selected users
- These actions — Use the drop-down list to select the actions to exclude, e.g. Added and Moved.
Step 3 – After configuring all filters, click Add to save them and return to the item settings.
Qumulo
Complete the following fields:
| Option | Description |
|---|---|
| General | |
| Specify a file server | Provide UNC path to a file server. See the section below for special considerations. Do not specify a default file share mapped to a local drive (e.g., \Server\e$). |
| Specify the account for collecting data | Select the account that will be used to collect data for this item. If you want to use a specific account (other than the one you specified during monitoring plan creation), select Custom account and enter credentials. The credentials are case sensitive. A custom account must be granted the same permissions and access rights as the default account used for data collection. See the Data Collecting Account topic for additional information. |
| Event Collection | |
| Specify a host or network resource | Provide UNC path to a file server or an IP range of servers you want to get activity events from. You can select to collect event data from the same server or provide a custom server or IP range. |
| Specify port and protocol for incoming connections | Use Port and Protocol to provide the port required for incoming connections (default is UDP port 514). |
| Scope | |
| Specify monitoring restrictions | Specify restriction filters to narrow your monitoring scope (search results, reports and Activity Summaries). All filters are applied using AND logic. By default, Netwrix Auditor will monitor all shares stored in the specified location, except for hidden shares (both default and user-defined). If you want to monitor user-defined hidden shares, select the related option in the monitored item settings. Remember that administrative hidden shares like default system root or Windows directory (ADMIN$), default drive shares (D$, E$), etc. will not be monitored. See the topics on the monitored items for details. |
Synology
Complete the following fields:
| Option | Description |
|---|---|
| General | |
| Specify a file server | Provide UNC path to a file server. See the section below for special considerations. Do not specify a default file share mapped to a local drive (e.g., \Server\e$). |
| Specify the account for collecting data | Select the account that will be used to collect data for this item. If you want to use a specific account (other than the one you specified during monitoring plan creation), select Custom account and enter credentials. The credentials are case sensitive. A custom account must be granted the same permissions and access rights as the default account used for data collection. See the Data Collecting Account topic for additional information. |
| Event Collection | |
| Specify a host or network resource | Provide UNC path to a file server or an IP range of servers you want to get activity events from. You can select to collect event data from the same server or provide a custom server or IP range. |
| Specify port and protocol for incoming connections | Use Port and Protocol to provide the port required for incoming connections (default is UDP port 514). |
| Scope | |
| Specify monitoring restrictions | Specify restriction filters to narrow your monitoring scope (search results, reports and Activity Summaries). All filters are applied using AND logic. By default, Netwrix Auditor will monitor all shares stored in the specified location, except for hidden shares (both default and user-defined). If you want to monitor user-defined hidden shares, select the related option in the monitored item settings. Remember that administrative hidden shares like default system root or Windows directory (ADMIN$), default drive shares (D$, E$), etc. will not be monitored. See the topics on the monitored items for details. |
Windows File Share
Complete the following fields:
| Option | Description |
|---|---|
| General | |
| Specify Windows file share | Provide UNC path to a shared resource. See the section below for special considerations. Do not specify a default file share mapped to a local drive (e.g., \Server\e$). |
| Specify the account for collecting data | Select the account that will be used to collect data for this item. If you want to use a specific account (other than the one you specified during monitoring plan creation), select Custom account and enter credentials. The credentials are case sensitive. A custom account must be granted the same permissions and access rights as the default account used for data collection. See the Data Collecting Account topic for additional information. |
| Scope | |
| Specify monitoring restrictions | Specify restriction filters to narrow your monitoring scope (search results, reports and Activity Summaries). All filters are applied using AND logic. See the Configure Scope section below for additional information on how to narrow your monitoring scope. By default, Netwrix Auditor will monitor all shares stored in the specified location, except for hidden shares (both default and user-defined). If you want to monitor user-defined hidden shares, select the related option in the monitored item settings. Remember that administrative hidden shares like default system root or Windows directory (ADMIN$), default drive shares (D$, E$), etc. will not be monitored. See the topics on the monitored items for details. In addition to the restrictions for a monitoring plan, you can use the *.txt files to collect more granular audit data. Note that the new monitoring scope restrictions apply together with previous exclusion settings configured in the *.txt files. See the Monitoring Plans topic for additional information. |
Configure Scope
You can narrow your monitoring scope by adding exclusions.
Click Add Exclusion. Then, in the Specify Filters dialog, do the following:
Step 4 – Provide the path to the file share where you are going to exclude some audit data. Use the path format as it appears in the "What" column of reports and Activity Summaries — for example, \corpsrv\shared.
Step 5 – You can use a wildcard (*) only if you need to exclude user activity on this file share. For other data types (state-in-time or all data) wildcards are not supported. This refers to the specified shared folder, its subfolders and files.
Step 6 – Select what type of data you want to exclude:
| Option | Description | Example |
|---|---|---|
| All Data | Select if you want to completely exclude the specified file share from being audited. The product will not collect any user activity or state-in-time data. NOTE: In this case,Auditor does not adjust audit settings automatically for the selected folders. | A Security Officer wants to monitor a file share but s/he does not have access to a certain folder on this share. Thus, s/he configures the product not to monitor this folder at all. |
| State-in-Time | Select to configure Auditor to exclude data for the state-in-time reports from the monitoring scope. | A Security Officer wants to monitor a file share, but it contains a folder with a huge amount of objects, so s/he does not want Auditor to collect state-in-time data for this folder. |
| User Activity | Select to exclude actions performed by specific users on the selected file share. See the procedure below for details. NOTE: In this case, the product still collects stat-in-time data for this share. | A Security Officer wants to monitor a file share that contains a public folder for which s/he does not want to collect Read operations. |
Follow the steps to exclude specific user activity.
Step 1 – Specify what user accounts should be excluded:
- All Users — Select to exclude the activity of any user on the file share you specified.
- These users— Select to exclude specific users' activity. Provide user names as shown in the "Who" column in reports and Activity Summaries, e.g., MyDomain\user1. To enter multiple accounts, use comma as a separator.
Step 2 – Specify what actions should be excluded:
- All actions — Exclude all actions of the selected users
- These actions — Use the drop-down list to select the actions to exclude, e.g. Added and Moved.
Step 3 – After configuring all filters, click Add to save them and return to the item settings.
Working with DFS File Shares
Netwrix Auditor supports auditing of DFS and clustered file servers if Object Access Auditing is enabled on DFS file shares or on every cluster node.
- When adding a cluster file server for auditing, it is recommended to specify a server name of the Role server or a UNC path of the shared folder located on the Role server.
- When adding a DFS file share for auditing, specify a Windows file share item and provide the UNC
path of the whole namespace or UNC path of the DFS link (folder). For example:
- "\domain\dfsnamespace" (domain-based namespace) or "\server\dfsnamespace" (in case of stand-alone namespace);
- "\domain\dfsnamespace\link" (domain-based namespace) or "\server\dfsnamespace\link" (in case of stand-alone namespace).
- For recommendations on configuring DFS replication, refer to this Knowledge Base article.
Working with Mount Points
You can specify a mount point as a monitored item. However, consider the following:
- If a mount point represents a shared folder, then the objects in its root will be initially collected by Netwrix Auditor and appear as processed by System account. Wait for the next data collections - then all actions for these objects will be monitored in a normal way.
- To monitor the mount points targeted at the subfolder of a file share, provide network path to the target subfolder.
AD Container
Complete the following fields:
| Option | Description |
|---|---|
| General | |
| Specify AD container | Specify a whole AD domain, OU or container. Click Browse to select from the list of containers in your network. You can also: - Select a particular computer type to be audited within the chosen AD container: Domain controllers, Servers (excluding domain controllers), or Workstations. - Click Exclude to specify AD domains, OUs, and containers you do not want to audit. In the Exclude Containers dialog, click Add and specify an object. The list of containers does not include child domains of trusted domains. Use other options (Computer, IP range to specify the target computers. |
| Specify the account for collecting data | Select the account that will be used to collect data for this item. If you want to use a specific account (other than the one you specified during monitoring plan creation), select Custom account and enter credentials. The credentials are case sensitive. Starting with version 9.96, you can use group Managed Service Accounts (gMSA) as data collecting accounts. If using a group Managed Service Account, you can specify only the account name in the domain\account$ format. Password field can be empty. A custom account must be granted the same permissions and access rights as the default account used for data collection. See theData Collecting Account topic for additional information. |
| Containers and Computers | |
| Monitor hidden shares | By default, Auditor will monitor all shares stored in the specified location, except for hidden shares (both default and user-defined). Select Monitor user-defined hidden shares if necessary. Even when this option is selected, the product will not collect data from administrative hidden shares such as: default system root or Windows directory (ADMIN$), default drive shares (D$, E$, etc.), shares used by printers to enable remote administration (PRINT$), etc. |
| Specify monitoring restrictions | Specify restriction filters to narrow your monitoring scope (search results, reports and Activity Summaries). All filters are applied using AND logic. Depending on the type of the object you want to exclude, select one of the following: - Add AD Container – Browse for a container to be excluded from being audited. You can select a whole AD domain, OU or container. - Add Computer – Provide the name of the computer you want to exclude as shown in the "Where" column of reports and Activity Summaries. For example, backupsrv01.mydomain.local. Wildcards (*) are not supported. In addition to the restrictions for a monitoring plan, you can use the *.txt files to collect more granular audit data. Note that the new monitoring scope restrictions apply together with previous exclusion settings configured in the *.txt files. See the Monitoring Plans topic for additional information. |
IP Range
Complete the following fields:
| Option | Description |
|---|---|
| General | |
| Specify IP range | Specify an IP range for the audited computers. To exclude computers from within the specified range, click Exclude. Enter the IP subrange you want to exclude, and click Add. |
| Specify the account for collecting data | Select the account that will be used to collect data for this item. If you want to use a specific account (other than the one you specified during monitoring plan creation), select Custom account and enter credentials. The credentials are case sensitive. A custom account must be granted the same permissions and access rights as the default account used for data collection. See the Data Collecting Account topic for additional information. |
| Scope | |
| Monitor hidden shares | By default, Auditor will monitor all shares stored in the specified location, except for hidden shares (both default and user-defined). Select Monitor user-defined hidden shares if necessary. Even when this option is selected, the product will not collect data from administrative hidden shares such as: default system root or Windows directory (ADMIN$), default drive shares (D$, E$, etc.), shares used by printers to enable remote administration (PRINT$), etc. |
Computer
For evaluation purposes, Netwrix recommends selecting Computer as an item for a monitoring plan. Once the product is configured to collect data from the specified items, audit settings (including Core and Compression services installation) will be applied to all computers within AD Container or IP Range.
Complete the following fields:
| Option | Description |
|---|---|
| General | |
| Specify a computer | Provide a server name by entering its FQDN, NETBIOS or IPv4 address. You can click Browse to select a computer from the list of computers in your network. |
| Specify the account for collecting data | Select the account that will be used to collect data for this item. If you want to use a specific account (other than the one you specified during monitoring plan creation), select Custom account and enter credentials. The credentials are case sensitive. A custom account must be granted the same permissions and access rights as the default account used for data collection. See the Data Collecting Account topic for additional information. |
| Scope | |
| Monitor hidden shares | By default, Auditor will monitor all shares stored in the specified location, except for hidden shares (both default and user-defined). Select Monitor user-defined hidden shares if necessary. Even when this option is selected, the product will not collect data from administrative hidden shares such as: default system root or Windows directory (ADMIN$), default drive shares (D$, E$, etc.), shares used by printers to enable remote administration (PRINT$), etc. |
| Specify monitoring restrictions | Specify restriction filters to narrow your monitoring scope (search results, reports and Activity Summaries). All filters are applied using AND logic. |
Configure Scope
By default, both user activity and state-in-time data will be collected for the monitored item. However, you can narrow your monitoring scope by specifying certain locations, user accounts or actions to exclude .
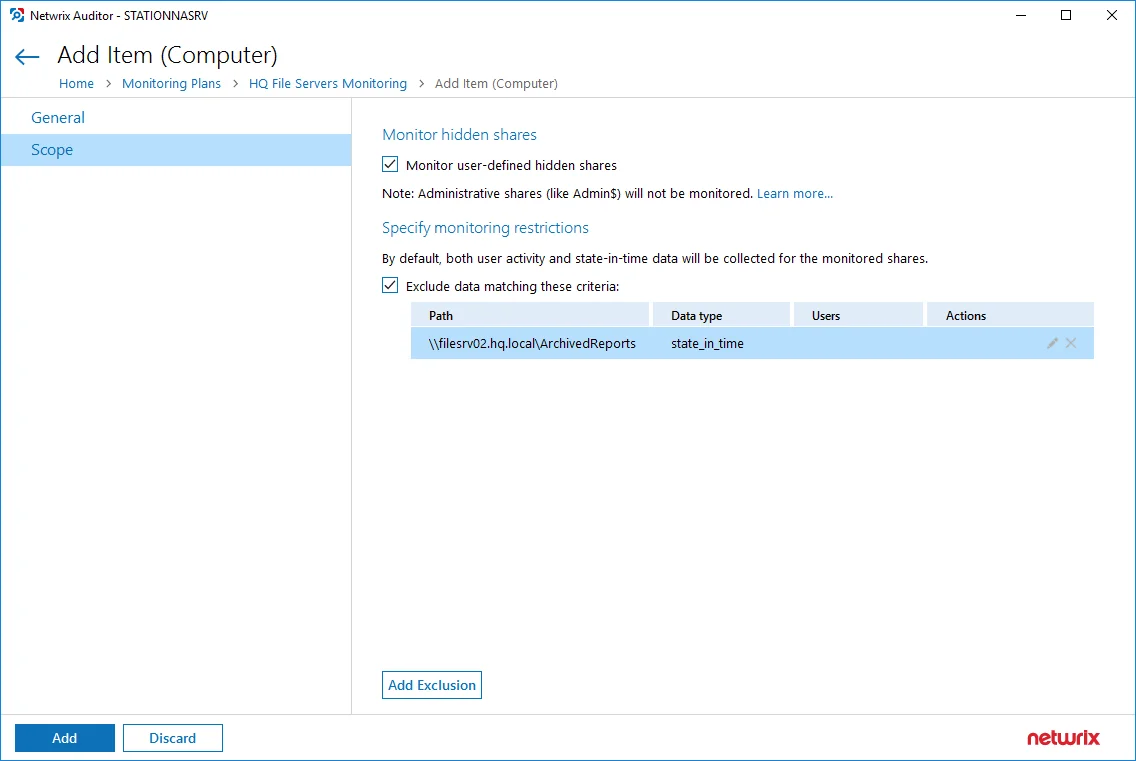
Click Add Exclusion, then follow the steps in the Specify Filters dialog:
Step 1 – Provide the path to the file share where you are going to exclude some audit data. Use the path format as it appears in the "What" column of reports and Activity Summaries — for example, \corpsrv\shared.
You can use a wildcard (*) only if you need to exclude user activity on this file share. For other data types (state-in-time or all data) wildcards are not supported. This refers to the specified shared folder, its subfolders and files.
Step 2 – Select what type of data you want to exclude:
| Option | Description | Example |
|---|---|---|
| All Data | Select if you want to completely exclude the specified file share from being audited. The product will not collect any user activity or state-in-time data. In this case,Netwrix Auditor does not adjust audit settings automatically for the selected folders. | A Security Officer wants to monitor a file share but s/he does not have access to a certain folder on this share. Thus, s/he configures the product not to monitor this folder at all. |
| State-in-Time | Select to configure Netwrix Auditor to exclude data for the state-in-time reports from the monitoring scope. | A Security Officer wants to monitor a file share, but it contains a folder with a huge amount of objects, so s/he does not want Netwrix Auditor to collect state-in-time data for this folder. |
| User Activity | Select to exclude actions performed by specific users on the selected file share. See the procedure below for details. In this case, the product still collects stat-in-time data for this share. | A Security Officer wants to monitor a file share that contains a public folder for which s/he does not want to collect Read operations. |
Follow the steps to exclude specific user activity.
Step 1 – Specify what user accounts should be excluded:
- All Users — Select to exclude the activity of any user on the file share you specified.
- These users — Select to exclude specific users' activity. Provide user names as shown in the "Who" column in reports and Activity Summaries, e.g., MyDomain\user1. To enter multiple accounts, use comma as a separator.
Step 2 – Specify what actions should be excluded:
- All actions — Exclude all actions of the selected users
- These actions — Use the drop-down list to select the actions to exclude, e.g. Added and Moved
After configuring all filters, click Add to save them and return to the item settings.
Group Policy
NOTE: Prior to configuring your monitoring plan, please read and complete the instructions in the following topics:
-
Protocols and Ports Required – To ensure successful data collection and activity monitoring configure necessary protocols and ports for inbound and outbound connections
-
Data Collecting Account – Configure data collecting accounts as required to audit your IT systems
-
Group Policy – Configure data source as required to be monitored
Complete the following fields:
| Option | Description |
|---|---|
| Monitor this data source and collect activity data | Enable monitoring of the selected data source and configure Auditor to collect and store audit data. |
| Prerequisites | Netwrix Auditor will automatically look up additional system components and prompt you to install those that are missing. In case all required components have been already installed, this section will be omitted. See the Other Components topic for additional information. |
| Detect additional details | Specify additional information to include in reports and activity summaries. Select Group membershipif you want to include Group membership of the account under which the change was made. |
| Specify data collection method | You can enable network traffic compression. If enabled, a Compression Service will be automatically launched on the audited computer, collecting and prefiltering data. This significantly improves data transfer and minimizes the impact on the target computer performance. |
| Configure audit settings | You can adjust audit settings automatically. Your current audit settings will be checked on each data collection and adjusted if necessary. This method is recommended for evaluation purposes in test environments. If any conflicts are detected with your current audit settings, automatic audit configuration will not be performed. Do not select the checkbox if you want to configure audit settings manually. See the Group Policy configuration topic for additional information about audit settings required to collect comprehensive audit data and the instructions on how to configure them. |
Review your data source settings and click Add to go back to your plan. The newly created data source will appear in the Data source list. As a next step, click Add item to specify an object for monitoring. See the Add Items for Monitoring topic for additional information.
Domain
Complete the following fields:
| Option | Description |
|---|---|
| Specify Active Directory domain | Specify the audited domain name in the FQDN format. For example, "company.local". |
| Specify the account for collecting data | Select the account that will be used to collect data for this item. If you want to use a specific account (other than the one you specified during monitoring plan creation), select Custom account and enter credentials. The credentials are case sensitive. You can also use group Managed Service Accounts (gMSA) as data collecting accounts. If using a Managed Service Account, you can specify only the account name in the domain\account$ format. Password field can be empty. A custom account must be granted the same permissions and access rights as the default account used for data collection. |
See the Permissions for Group Policy Auditing topic for additional information.
Logon Activity
NOTE: Prior to configuring your monitoring plan, please read and complete the instructions in the following topics:
-
Protocols and Ports Required – To ensure successful data collection and activity monitoring configure necessary protocols and ports for inbound and outbound connections
-
Data Collecting Account – Configure data collecting accounts as required to audit your IT systems
-
Logon Activity – Configure data source as required to be monitored
Complete the following fields:
| Option | Description |
|---|---|
| General | |
| Monitor this data source and collect activity data | Enable monitoring of the selected data source and configure Auditor to collect and store audit data. |
| Fine-tune logon activity monitoring | Specify interval for Netwrix Auditor to collect data on logon activity and add successful non-interactive logons to your auditing scope, if necessary. |
| Specify data collection method | You can enable network traffic compression. If enabled, a Compression Service will be automatically launched on the audited computer, collecting and prefiltering data. This significantly improves data transfer and minimizes the impact on the target computer performance. |
| Configure audit settings | You can adjust audit settings automatically. Your current audit settings will be checked on each data collection and adjusted if necessary. This method is recommended for evaluation purposes in test environments. If any conflicts are detected with your current audit settings, automatic audit configuration will not be performed. Do not select the checkbox if you want to configure audit settings manually. See the Logon Activity configuration topic for additional information about audit settings required to collect comprehensive audit data and the instructions on how to configure them. |
| Users | |
| Specify monitoring restrictions | Select the users to be excluded from search results, reports and Activity Summaries. To add users to the list, click Add. Then, provide the user name in the domain\user format. For example: mydomain\user1. Consider the following: - Use NetBIOS domain name format. - You can provide the "System" value to exclude events containing the “System” instead of an account name in the “Who” column. In addition to the restrictions for a monitoring plan, you can use the *.txt files to collect more granular audit data. Note that the new monitoring scope restrictions apply together with previous exclusion settings configured in the *.txt files. See the Monitoring Planstopic for additional information. |
Review your data source settings and click Add to go back to your plan. The newly created data source will appear in the Data source list. As a next step, click Add item to specify an object for monitoring. See the Add Items for Monitoring topic for additional information.
Domain
Complete the following fields:
| Option | Description |
|---|---|
| Specify Active Directory domain | Specify the audited domain name in the FQDN format. For example, "company.local". |
| Specify the account for collecting data | Select the account that will be used to collect data for this item. If you want to use a specific account (other than the one you specified during monitoring plan creation), select Custom account and enter credentials. The credentials are case sensitive. You can also use group Managed Service Accounts (gMSA) as data collecting accounts. If using a Managed Service Account, you can specify only the account name in the domain\account$ format. Password field can be empty. A custom account must be granted the same permissions and access rights as the default account used for data collection. |
See the Permissions for Logon Activity Auditing topic for additional information.
Microsoft Entra ID
NOTE: Prior to configuring your monitoring plan, please read and complete the instructions in the following topics:
-
Protocols and Ports Required – To ensure successful data collection and activity monitoring configure necessary protocols and ports for inbound and outbound connections
-
Data Collecting Account – Configure data collecting accounts as required to audit your IT systems
-
Microsoft Entra ID – Configure data source as required to be monitored
How to Add Office365 Item
This instruction shows how to collect audit data from the Office365 organization. See the Configuring Microsoft Entra ID App for Auditing Microsoft Entra ID topic for additional information on how to prepare Microsoft Entra ID app with required permissions. Make sure you have the following at hand:
- Tenant name
- Application (client) ID
- Application secret
Types of data that can be collected by Netwrix Auditor from the Office 365 organization depend on the authentication option you choose.
Follow the steps to configure Microsoft 365 tenant as a monitored item.
Step 1 – On the General page of the item properties, specify Tenant name:
-
If you are going to use Basic authentication, you can proceed to the next step – Tenant name will be filled in automatically after it.
-
NOTE: Basic authentication is no longer possible for Exchange Online. For the already existing tenants it is still possible to use basic authentication for SharePoint Online and Microsoft Entra ID monitoring.
-
If you are going to use Modern authentication, paste the obtained name. See the Using Modern Authentication with Microsoft Entra ID topic for additional information.
Step 2 – Select authentication method that will be used when accessing Microsoft 365 services:
-
Basic authentication:
- Selected, Microsoft 365 organization will be accessed on behalf of the user you specify.
- Enter User name and password; use any of the following formats: user@domain.com or user@domain.onmicrosoft.com.
- The Tenant name field then will be filled in automatically.
- Make sure this user account has sufficient access rights. See Using Basic Authentication with Microsoft Entra ID topic for additional information.
-
Modern authentication:
-
Selected, Microsoft 365 organization will be accessed using the Microsoft Entra ID (formerly Azure AD) app you prepared. Enter:
-
Application ID;
- Application secret.
-
-
See the Using Modern Authentication with Microsoft Entra ID for additional information.
-
Step 3 – Click the Add button.
You can use a single account to collect audit data for different Microsoft 365 services (Microsoft Entra ID, Exchange Online, SharePoint Online); however, Netwrixrecommends that you specify individual credentials for each of them.
If you plan to collect and report on the audit data for Exchange Online non-owner mailbox access, consider that the value shown in the “Who” field in reports and search results will be displayed in UPN format (unlike the earlier Netwrix Auditor versions). This refers to the following scenarios:
-
All new installations
-
Upgrade from the previous versions if:
-
Modern authentication is selected in the item settings after the upgrade.
OR
-
Modern authentication has ever been selected in the item settings and reverted back to Basic later
-
Step 4 – Complete the following fields:
| Option | Description |
|---|---|
| Monitor this data source and collect activity data | Enable monitoring of the selected data source and configure Auditor to collect and store audit data. |
| Monitor Microsoft Entra ID logon activity | Specify what types of logon events you want to monitor: successful or failed, performed through Windows and SQL authentication. - Failed SQL and Windows logons - Successful SQL logons - Logoffs - Successful Windows logons |
| Collect data for state-in-time reports | Configure Netwrix Auditor to store daily snapshots of your system configuration required for further state-in-time reports generation. See the State–In–Time Reports topic for additional information. |
Review your data source settings and click Add to go back to your plan. The newly created data source will appear in the Data source list. As a next step, click Add item to specify an object for monitoring. See the Add Items for Monitoring topic for additional information.
MS Teams
NOTE: Prior to configuring your monitoring plan, please read and complete the instructions in the following topics:
-
Protocols and Ports Required – To ensure successful data collection and activity monitoring configure necessary protocols and ports for inbound and outbound connections
-
Data Collecting Account – Configure data collecting accounts as required to audit your IT systems
-
MS Teams – Configure data source as required to be monitored
How to Add Microsoft 365 Item
This instruction shows how to collect audit data from the Office365 organization. See the Configuring Microsoft Entra ID App for Auditing Microsoft Entra ID topic for additional information on how to prepare Microsoft Entra ID app with required permissions. Make sure you have the following at hand:
- Tenant name
- Application (client) ID
- Application secret
Types of data that can be collected by Netwrix Auditor from the Office 365 organization depend on the authentication option you choose.
Follow the steps to configure Microsoft 365 tenant as a monitored item.
Step 1 – On the General page of the item properties, specify Tenant name:
-
If you are going to use Basic authentication, you can proceed to the next step – Tenant name will be filled in automatically after it.
-
NOTE: Basic authentication is no longer possible for Exchange Online. For the already existing tenants it is still possible to use basic authentication for SharePoint Online and Microsoft Entra ID monitoring.
-
If you are going to use Modern authentication, paste the obtained name. See the Using Modern Authentication with Microsoft Entra ID topic for additional information.
Step 2 – Select authentication method that will be used when accessing Microsoft 365 services:
-
Basic authentication:
- Selected, Microsoft 365 organization will be accessed on behalf of the user you specify.
- Enter User name and password; use any of the following formats: user@domain.com or user@domain.onmicrosoft.com.
- The Tenant name field then will be filled in automatically.
- Make sure this user account has sufficient access rights. See Using Basic Authentication with Microsoft Entra ID topic for additional information.
-
Modern authentication:
-
Selected, Microsoft 365 organization will be accessed using the Microsoft Entra ID (formerly Azure AD) app you prepared. Enter:
-
Application ID;
- Application secret.
-
-
See the Using Modern Authentication with Microsoft Entra ID for additional information.
-
Step 3 – Click the Add button.
You can use a single account to collect audit data for different Microsoft 365 services (Microsoft Entra ID, Exchange Online, SharePoint Online); however, Netwrixrecommends that you specify individual credentials for each of them.
If you plan to collect and report on the audit data for Exchange Online non-owner mailbox access, consider that the value shown in the “Who” field in reports and search results will be displayed in UPN format (unlike the earlier Netwrix Auditor versions). This refers to the following scenarios:
-
All new installations
-
Upgrade from the previous versions if:
-
Modern authentication is selected in the item settings after the upgrade.
OR
-
Modern authentication has ever been selected in the item settings and reverted back to Basic later
-
Step 4 – Complete the following fields:
| Option | Description |
|---|---|
| Monitor this data source and collect activity data | Enable monitoring of the selected data source and configure Auditor to collect and store audit data. |
| Collect data for state-in-time reports | Configure Netwrix Auditor to store daily snapshots of your system configuration required for further state-in-time reports generation. See the State–In–Time Reports topic for additional information. |
After that, you can use the Microsoft Entra ID management portal to revoke this privileged role and assign one of the non-privileged roles instead (for example, Security Reader).
Network Devices
NOTE: Prior to configuring your monitoring plan, please read and complete the instructions in the following topics:
-
Protocols and Ports Required – To ensure successful data collection and activity monitoring configure necessary protocols and ports for inbound and outbound connections
-
Data Collecting Account – Configure data collecting accounts as required to audit your IT systems
-
Network Devices – Configure data source as required to be monitored
Complete the following fields:
| Option | Description |
|---|---|
| Monitor this data source and collect activity data | Enable monitoring of the selected data source and configure Auditor to collect and store audit data. |
Cisco Meraki Dashboard
Complete the following fields:
| Option | Description |
|---|---|
| Specify credentials to connect to Cisco Meraki Dashboard | Provide a name of your organization or an account used to connect to Cisco Meraki dashboard. |
| Select authentication type | There are two authentication options available to collect data from Cisco Meraki devices: - Access through API. You can access Cisco Meraki dashboard using API secret key if one-time password (OTP) MFA is required in your organization. In this case, you need to provide your API secret key. See Cisco Meraki documentation for additional information about Cisco Meraki API: Meraki Dashboard API. - Basic authentication: access on behalf of a user. Provide the name and password of the service account configured to access Cisco Meraki Dashboard. See the Configure Cisco Meraki Dashboard Account topic for additional information on how to configure the account used to collect data. |
This monitoring plan also requires a management IP address. A management IP is an IP address that is used for management purposes. For example, the IP that is configured on a switch so that you can remotely access it through its IP address would be considered a management IP address.
Syslog Device
Complete the following fields:
| Option | Description |
|---|---|
| General | |
| Specify syslog host or network source | Select one of the following: - Host or network source name — Provide a server name by entering its FQDN, NETBIOS or IPv4 address. You can click Browse to select a computer from the list of computers in your network. - IP Range — Specify an IP range for the audited computers. To exclude computers from within the specified range, click Exclude. Enter the IP subrange you want to exclude, and click Add. |
| Specify port and protocol for incoming connections | Use Port and Protocol to provide the port required for incoming connections (default is UDP port 514). |
| Devices | |
| Configure monitoring rules for required network devices: - Cisco (ASA, IOS, FTD, Meraki) - Fortinet (FortiGate FortiOS) - Juniper (Junos OS) - Palo Alto (PAN-OS) - Sonic Wall (NS, SMA, WAF) - HPE (ArubaOS) - Pulse Secure |
Oracle Database
NOTE: Prior to configuring your monitoring plan, please read and complete the instructions in the following topics:
-
Protocols and Ports Required – To ensure successful data collection and activity monitoring configure necessary protocols and ports for inbound and outbound connections
-
Data Collecting Account – Configure data collecting accounts as required to audit your IT systems
-
Oracle Database – Configure data source as required to be monitored
Complete the following fields:
| Option | Description |
|---|---|
| General | |
| Monitor this data source and collect activity data | Enable monitoring of the selected data source and configure Auditor to collect and store audit data. |
| Monitor Oracle Database logon activity | Specify what types of logon events you want to monitor: successful or failed, performed through Windows and SQL authentication. - Failed SQL and Windows logons - Successful SQL logons - Logoffs - Successful Windows logons |
| Users | |
| Specify users to track their activity | Use controls in this section to populate the corresponding lists -click Add and specify user name and type (OS or database user). - Include—Add users to be included in the auditing scope. - Exclude—Add users to be excluded from the auditing scope by specifying their names and type (OS or database user). User names are case-sensitive. |
| Database Objects | |
| Data objects to monitor | Create rules for objects and actions that you want to audit: 1. Click Add Rule. 2. Specify a name of the Oracle database Object and Schema. 3. Select the necessary actions (successful or failed changes, successful or failed reads). 4. Click Add. Schema and object names are case sensitive. |
Review your data source settings and click Add to go back to your plan. The newly created data source will appear in the Data source list. As a next step, click Add item to specify an object for monitoring. See the Add Items for Monitoring topic for additional information.
Oracle Database Instance
Complete the following fields:
| Option | Description |
|---|---|
| Connection type | Select how the product connects to Oracle Database: - Oracle Database instance – select if you want to connect to a database by instance name. - Oracle Wallet – select if you want to use Oracle Wallet – password-protected container used to store authentication and signing credentials, including private keys, certificates, and trusted certificates needed by SSL. |
| Instance name | Provide connection details in the following format: host:port/service_name. Make sure audit settings are configured for your Oracle Database instance. |
| Wallet alias | Provide the alias you set while creating wallet. For example, "MyOracle". Alias name in Netwrix Auditor should exactly match the alias in the tnsnames.ora file. Configure Oracle Instant Client for HTTP Proxy Connections |
| Specify the account for collecting data For Oracle Database instance connection type only. | Select the account that will be used to collect data for this item. If you want to use a specific account (other than the one you specified during monitoring plan creation), select Custom account and enter credentials. The credentials are case sensitive. A custom account must be granted the same permissions and access rights as the default account used for data collection. See the Data Collecting Account topic for additional information. |
Data Collection from Oracle Database
On a high level, data collection process for Oracle databases works as follows:
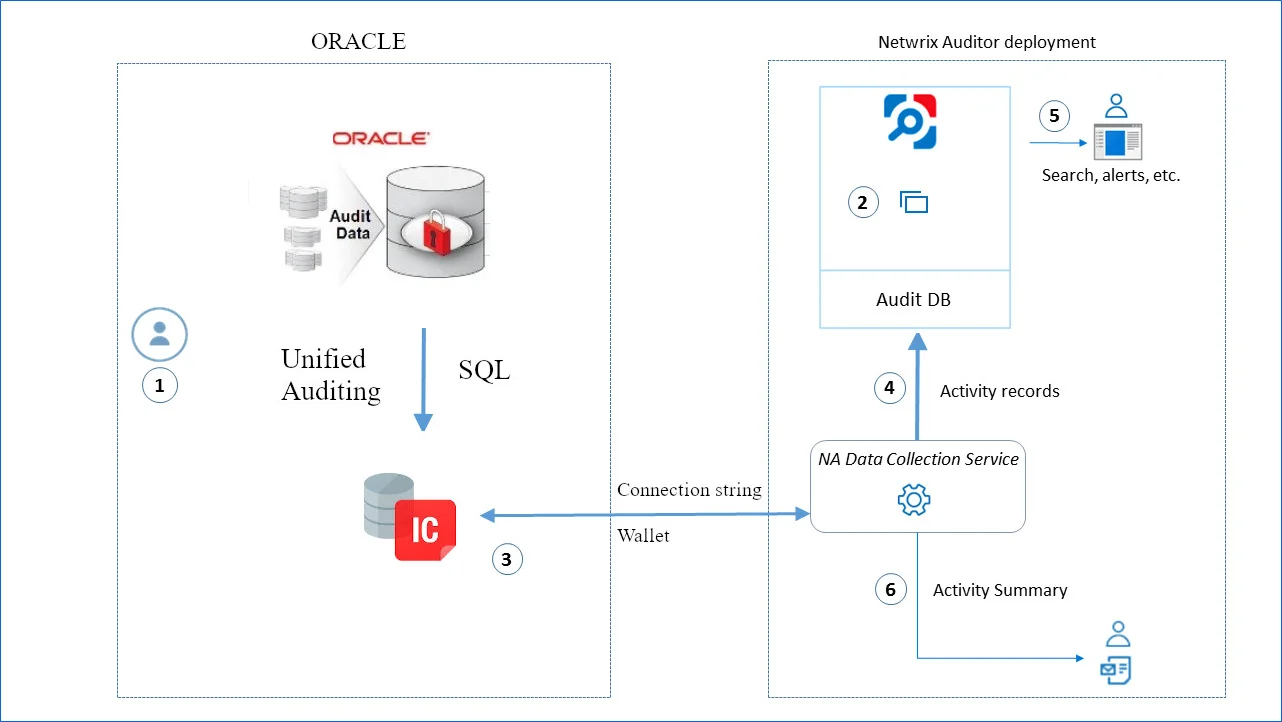
-
Oracle administrator prepares a dedicated service account with sufficient permissions to collect data from Oracle Database. See the Permissions for Oracle Database Auditing topic for additional information.
-
Netwrix administrator does the following:
- Creates a monitoring plan in Netwrix Auditor, specifying the service account (prepared at step 1) as a data collecting account in the Monitoring Plan wizard. Then s/he adds items to the monitoring plan – these are Oracle Databases to collect data from.
- Configures alerts related to Oracle data source. Current version does not include predefined alerts for that data source, so follow the Create Alerts section to create and configure the necessary alerts.
Remember to set the filter to “Data Sourceequals Oracle”.
-
Netwrix Auditor Data Collection Service starts periodic (every 10 min by default) data collection sessions. The results of each session include audit events that occurred since the previous data collection. Data is retrieved via Oracle Instant Client application. The product uses direct connection string or Oracle Wallet to connect to Oracle databases.
-
Netwrix Auditor Data Collection Service processes collected data into the proprietary format (Activity Records). Each Activity Record contains initiator’s account, time, action, and other details.
- To determine what has changed in the configuration, it compares a state snapshot from Oracle Server with the previously taken.
- To get ‘Who’ (initiator) and ‘When’ (date and time) information for the detected changes, the product uses Oracle events data.
Netwrix Auditor Serverthen writes the Activity Records to the audit database (default retention – 180 days) and long-term archive (default retention – 120 months).
-
Users can work with collected data in Netwrix Auditor client UI: run search, view reports, and so on. If you have configured alerting in Netwrix Auditor, then the activities that match the certain criteria will trigger the alerts. Recipients will be notified by email, and response actions will be taken, if configured.
-
Netwrix Auditor also generates an Activity Summary once a day (by default, at 3 AM) and sends it to the specified recipients. This email lists Oracle infrastructure changes and activities collected by Netwrix Auditor during the last 24 hours.
SharePoint
NOTE: Prior to configuring your monitoring plan, please read and complete the instructions in the following topics:
-
Protocols and Ports Required – To ensure successful data collection and activity monitoring configure necessary protocols and ports for inbound and outbound connections
-
Data Collecting Account – Configure data collecting accounts as required to audit your IT systems
-
SharePoint – Configure data source as required to be monitored
Complete the following fields:
| Option | Description |
|---|---|
| Monitor this data source and collect activity data | Enable monitoring of the selected data source and configure Auditor to collect and store audit data. |
| Detect additional details | Specify additional information to include in reports and activity summaries. Select Group membershipif you want to include Group membership of the account under which the change was made. |
| Configure audit settings | You can adjust audit settings automatically. Your current audit settings will be checked on each data collection and adjusted if necessary. This method is recommended for evaluation purposes in test environments. If any conflicts are detected with your current audit settings, automatic audit configuration will not be performed. Do not select the checkbox if you want to configure audit settings manually. See the SharePoint configuration topic for additional information about audit settings required to collect comprehensive audit data and the instructions on how to configure them. |
| Collect data for state-in-time reports | Configure Netwrix Auditor to store daily snapshots of your system configuration required for further state-in-time reports generation. See the State–In–Time Reports topic for additional information. In the Manage historical snapshots section, you can click Manage and select the snapshots that you want to import to the Audit Database to generate a report on the data source's state at the specific moment in the past. You must be assigned the Global administrator or the Global reviewer role to import snapshots. Move the selected snapshots to the Snapshots available for reporting list using the arrow button. The product updates the latest snapshot on the regular basis to keep users up to date on actual system state. Users can also configure Only the latest snapshot is available for reporting in Auditor . If you want to generate reports based on different snapshots, you must import snapshots to the Audit Database. |
Review your data source settings and click Add to go back to your plan. The newly created data source will appear in the Data source list. As a next step, click Add item to specify an object for monitoring. See the Add Items for Monitoring topic for additional information.
Troubleshoot SharePoint Auditing
| Problem | Description | KB article |
|---|---|---|
| The "Timeout Expired" error appears during the agent's deployment. | The agent failed to be deployed due to one of the following reasons: - One or several servers are unreachable - The SPAdminV4 service is not started on any of the servers. - The servers within the farm are located in different time zones. - Your SharePoint farm exceeds the recommended capacity limits. Increase DeployTimeout value in %ProgramData%\Netwrix\NetwrixAuditor for SharePoint\ Configuration\ <managed_object_name>\ Commonsettings.config and restart the agent service. | Refer to the Timeout Expired Error on SharePoint Core Service Deployment Knowledge Base article for the solution. |
SharePoint Farm
Complete the following fields:
| Option | Description |
|---|---|
| General | |
| Specify SharePoint farm for monitoring | Enter the SharePoint Central Administration website URL. |
| Specify the account for collecting data | Select the account that will be used to collect data for this item. If you want to use a specific account (other than the one you specified during monitoring plan creation), select Custom account and enter credentials. The credentials are case sensitive. A custom account must be granted the same permissions and access rights as the default account used for data collection. See the Data Collecting Account topic for additional information. |
| Core Service | |
| Deploy Netwrix Auditor for SharePoint Core Service | Select deployment method for the Core Service. Select one of the following: - Automatically—The installation will run under the account used to collect data on the SharePoint farm wizard completion. Prior to the Netwrix Auditor for SharePoint Core Service installation, review the following prerequisites and make sure that: - Netwrix Auditor for SharePoint Core Service is going to be installed on the computer that hosts SharePoint Central Administration in the audited SharePoint farm. - .Net Framework 3.5 SP1 is installed on the computer that hosts SharePoint Central Administration in the audited SharePoint farm. - The SharePoint Administration (SPAdminV4) service is started on the target computer. See SharePoint for more information. - The user that is going to run the Core Service installation: - Is a member of the local Administrators group on SharePoint server, where the Core Service will be deployed. - Is granted the SharePoint_Shell_Access role on SharePoint SQL Server configuration database. See Permissions for SharePoint Auditing topic for more information. - Manually—See the Netwrix Auditor Installation and Configuration Guide for more information. During the Netwrix Auditor for SharePoint Core Service installation / uninstallation your SharePoint sites may be unavailable. |
| Changes | |
| Audit SharePoint farm configuration changes | Configuration changes are always audited. |
| Audit SharePoint permissions and content changes | Select change types to be audited with Netwrix Auditor. Netwrix Auditor allows auditing the entire SharePoint farm. Alternatively, you can limit the auditing scope to separate web applications and site collections. To do it, select Specific SharePoint objects and do one of the following: - Click Add, provide the URL to web application or site collection and select object type (Web application or Site collection). - Click Import, select object type (Web application or Site collection), encoding type, and browse for a file that contains a list of web applications and sites. Netwrix Auditor ignores changes to system data (e.g., hidden and system lists or items are not audited). Netwrix Auditor also ignores the content changes to sites and objects on the site collections located on Central Administration web application, but the security changes that occurred there are tracked and reported anyway. |
| Activity | |
| Specify monitoring restrictions | Specify restriction filters to narrow your SharePoint monitoring scope (search results, reports and Activity Summaries). For example, you can exclude site collections document libraries and lists from being audited as they contain public non sensitive data. All filters are applied using AND logic. Click Add and complete the following fields: - User – provide the name of the user as shown in the "Who" column of reports and Activity Summaries. Example: mydomain\user1. - Object URL – provide URL of the objects as shown in the "What" column of reports and Activity Summaries. Example: http://sitecollection/list/document.docx. - Action Type – select what types of actions performed by selected users under the object you want to monitor. Available values: All, Changes, Reads. You can use a wildcard (*) to replace any number of characters in filters. In addition to the restrictions for a monitoring plan, you can use the *.txt files to collect more granular audit data. Note that the new monitoring scope restrictions apply together with previous exclusion settings configured in the *.txt files. See the Monitoring Planstopic for additional information. |
| Read Access | |
| Audit SharePoint read access | Configure Netwrix Auditor to track read access to lists and list items within your SharePoint farm except for Central Administration web sites. Select Sites only if you want to enable read access auditing on SharePoint sites only. Enable Sites and subsites to track read access on each subsite. Then, do one of the following: - Click Add and provide URL to a SharePoint site. - Click Import, select encoding type, and browse for a file that contains a list of sites. Read access auditing significantly increases the number of events generated on your SharePoint and the amount of data written to the AuditArchive. |
xml version="1.0" encoding="utf-8"?
SharePoint Online
- SharePoint Online –
How to Add Microsoft 365Office365 Item
| Option | Description |
|---|---|
| Monitor this data source and collect activity data | |
| Audit SharePoint Online configuration and content changes | Configuration and content changes are always audited. |
| Audit SharePoint Online read access | Configure to monitor SharePoint Online read access. |
| Collect data for state-in-time reports | Configure to store daily snapshots of your SharePoint Online configuration required for further state-in-time reports generation. See the State–In–Time Reports topic for additional information. The product updates the latest snapshot on the regular basis to keep users up-to-date on actual system state. Only the latest snapshot is available for reporting in . If you want to generate reports based on different snapshots, you must import snapshots to the Audit Database. For that, in the Manage historical snapshots section, click Manage and select the snapshots that you want to import. To import snapshots, you must be assigned the Global administrator or the Global reviewer role . Move the selected snapshots to the Snapshots available for reporting list using the arrow button. When finished, click OK. |
See the Permissions for SharePoint Online Auditing topic for additional information.
Add Item to the SQL Server
Perform the following steps to add an item to the SQL Server monitoring plan.
Step 1 – Create a monitoring plan for the SQL Server.
Step 2 – Double-click SQL Server monitoring plan.
Step 3 – Click Add Item.
Step 4 – Select one of the items from the drop-down list:
Step 5 – Click Add.
Item is added and SQL Server monitoring plan is ready to use.
SQL Server Instance
Complete the following fields:
| Option | Description |
|---|---|
| Specify SQL Server instance | Specify the name of the SQL Server instance. |
| Specify the account for collecting data | Select the account that will be used to collect data for this item. If you want to use a specific account (other than the one you specified during monitoring plan creation), select Custom account and enter credentials. The credentials are case sensitive. A custom account must be granted the same permissions and access rights as the default account used for data collection. See the Data Collecting Account topic for additional information. |
Use a combination of server role, environment, instance name (including "DEFAULT" for default instances), and a unique identifier.
Example:
- Production default instance: PROD-SQL-01
- Development named instance: DEV-SQL-01\DEVINSTANCE
- Test named instance on a specific port: TEST-SQL-01\TESTINSTANCE:1440
NOTE: When dealing with SQL Server instances, Always On Availability Group (AG) instances, and a mix of default and non-default instances along with specified ports, it's important to craft names that provide clear identification.
SQL Server Availability Group
Complete the following fields:
| Option | Description |
|---|---|
| Availability group listener | Provide a name of an availability group listener in FQDN or NetBIOS format. The listener is a virtual network name (VNN) that you can connect to in order to access a database in a primary or secondary replica of an Always On availability group. A listener allows you to connect to a replica without having to know the physical instance name of the SQL Server. Ensure that the requirements to the DNS name and Windows permissions requirements are met. See Configure a listener for an Always On availability group for additional information. |
| Availability group name | Enter a name of your SQL Server availability group. |
| Specify the account for collecting data | Select the account that will be used to collect data for this item. If you want to use a specific account (other than the one you specified during monitoring plan creation), select Custom account and enter credentials. The credentials are case sensitive. A custom account must be granted the same permissions and access rights as the default account used for data collection. See the Data Collecting Account topic for additional information. |
Extend the SQL Server instance name with a replica role (Primary/Secondary), AG identifier, and a unique identifier.
Example:
- For:
PROD-SQL-01-AG1
SQL Server
NOTE: Prior to configuring your monitoring plan, please read and complete the instructions in the following topics:
-
Protocols and Ports Required – To ensure successful data collection and activity monitoring configure necessary protocols and ports for inbound and outbound connections
-
Data Collecting Account – Configure data collecting accounts as required to audit your IT systems
-
SQL Server – Configure data source as required to be monitored
To configure SQL Server data source settings, use the following property tabs:
When finished, review your data source settings and click Add to go back to your plan. The newly created data source will appear in the Data source list.
As a next step, click Add item to specify an object for monitoring. See the Add Item to the SQL Server topic for additional information.
General settings
On the General tab, you can configure the following settings for SQL Server data source:
| Option | Description |
|---|---|
| General | |
| Monitor this data source and collect activity data | Enable monitoring of the selected data source and configure Auditor to collect and store audit data. |
| Monitor SQL Server configuration changes | Always enabled, as SQL Server configuration changes are always monitored. |
| Monitor SQL Server logon activity | Specify what types of logon events you want to monitor: successful or failed, performed through Windows and SQL authentication. - Failed SQL and Windows logons - Successful SQL logons - Logoffs - Successful Windows logons |
| Collect data for state-in-time reports | Configure Netwrix Auditor to store the snapshots of your SQL Server instance configuration — you will require them for state-in-time reports generation. See State–In–Time Reports for more information. CAUTION: The State-in-Time functionality is not available for SQL Server Availability Groups. The product updates the latest snapshot on the regular basis to keep users up-to-date on actual system state. Only the latest snapshot is available for reporting in Netwrix Auditor. If you want to generate reports based on different snapshots, you must import snapshots to the Audit Database. To import snapshots, you must be assigned the Global administrator or the Global reviewer role in Netwrix Auditor. 1. In the Manage historical snapshots section, click Manage and select the snapshots that you want to import. 2. Move the selected snapshots to the Snapshots available for reporting list using the arrow button. 3. When finished, click OK. See also Using historical data. |
Users
On the Users tab, you can configure the following settings for SQL Server data source:
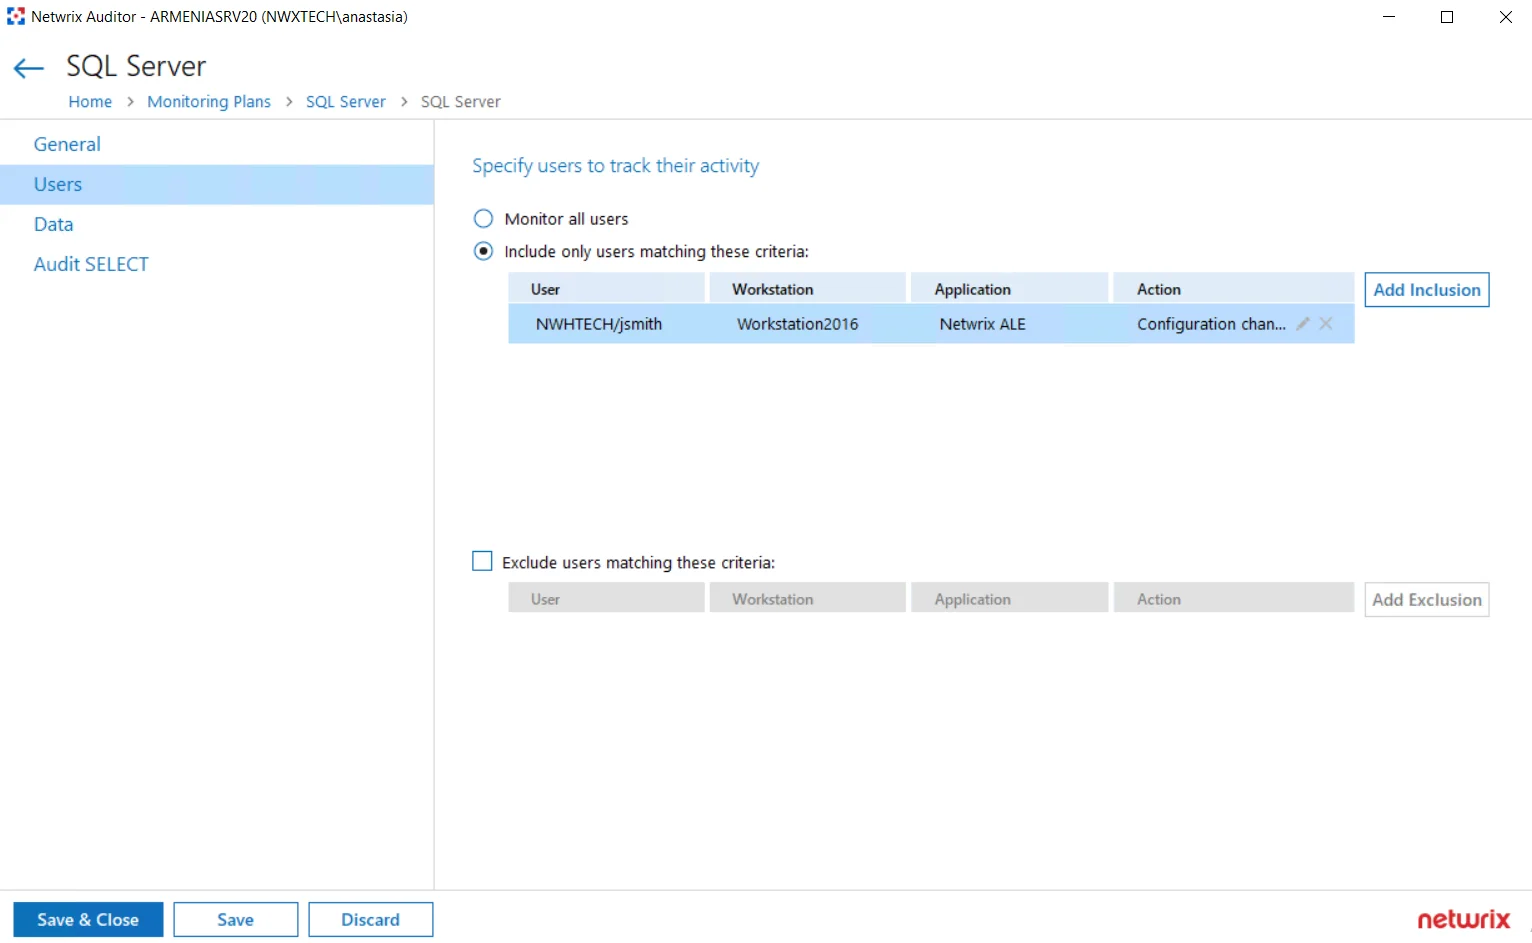
| Options | Description |
|---|---|
| Specify users to track their activity | Select the option you need to fine-tune your SQL Server monitoring scope. - Monitor all users - Include only users matching these criteria - Exclude users matching these criteria For example, you may need to track only actions performed by administrative accounts, or exclude the activity initiated by ordinary applications. If so, data should be filtered accordingly before it appears in search results, reports and Activity Summaries. You can create either inclusion or exclusion lists. All filters are applied using AND logic. To create a filter for user activity monitoring, select the related option and click the button on the right. Specify the following: - User — enter the initiator's account as it appears in the "Who" column of reports and Activity Summaries, for example: mydomain\user1. For events containing “System” in the “Who” column you can enter "System" . - Workstation where activity was initiated — enter the workstation name as it is shown in the "Workstation" column of reports and Activity Summaries, for example: StationWin2016. - Application that initiated the activity — enter the application name as shown next to "Application name" in details of reports and Activity Summaries. You can use a wildcard (*) to replace any number of characters in filters. In addition to the restrictions for a monitoring plan, you can use the *.txt files to collect more granular audit data. Note that the new monitoring scope restrictions apply together with previous exclusion settings configured in the *.txt files. See the Monitoring Planstopic for additional information. |
Data
On the Data tab, you can configure the following settings for SQL Server data source.
Remember, when auditing SQL Server availability on groups, the only supported data collection mode is the 'Do not use triggers' mode.
| Option | Description |
|---|---|
| --- | --- |
| --- | --- |
| Monitor changes to data in the database tables | Enable monitoring of changes to data stored in the database tables hosted on the SQL Server. If you plan to enable this option, make sure the account that runs the SQL Server service on the monitored instance has at least read permissions in the Active Directory domain (e.g., it does not run under a local user account). Otherwise, enabling this option may lead to issues when altering databases on the monitored SQL Server instances. |
| Data collection mode | |
| Do not use triggers | Default mode for a new installation of Netwrix Auditor. Data will be collected using the SQL Server traces. This mode allows you to get a sufficient level of detail in the reports and search results without producing additional load on your SQL Server instance. Thus, it is recommended for highly-transactional servers. When using this mode, consider that the "What" field of the Activity Record with "Object type" = "Data" may show incorrect data. The issues occur because the product applies data categories to an entire SQL Server table and not to rows. |
| Use triggers for detailed monitoring | However, if you require a very detailed reporting on the data changes, you can select this mode. It will be also selected by default if you are upgrading your Netwrix Auditor deployment. Data will be collected using a set of triggers. For more information on this technology, see https://kb.netwrix.com/728 . It is recommended to use this setting carefully, as collecting large amount of details from a highly-transactional server may affect its performance. Using this mode may lead to issues when altering databases on the monitored SQL Server instances. The issues occur only if the SQL Server service account does not have Read permissions in the Active Directory domain (e.g., a local user account). When using this mode, consider that the "What" field of the Activity Record with "Object type" = "Data" may show incorrect data. The issues occur because the product applies data categories to an entire SQL Server table and not to rows. Switching from the configured triggerless mode may lead to a data loss. The workaround is to force data collection right after enabling the triggers. |
| Changes (per transaction) to collect and report: | Specify how many changes per a database transaction you want to be collected. For example, you can limit this number to 10 changes per transaction, or collect all changes. It is recommended to adjust this setting carefully, as collecting large number of changes from a highly-transactional server may affect its performance. |
| Monitoring rules | To specify what data changes must be monitored, create at least one inclusion rule. Exclusion rules are optional. Click Add Rule and configure the following:  - Type — Select rule type: include or exclude. - Server — Specify a name of the monitored SQL Server instance where the required database resides. Use the server_name\instance_name format, for example, SQLsrv11\SQLExpress2016. NOTE: If you are going to configure monitoring rules for SQL Server Availability Groups, provide the name of your Availability Group item in this field. - Database — Specify the database whose data changes you want to monitor. - Table — Specify database table to monitor. - Column—Specify table column name. The following column types are currently not supported: - Type — Select rule type: include or exclude. - Server — Specify a name of the monitored SQL Server instance where the required database resides. Use the server_name\instance_name format, for example, SQLsrv11\SQLExpress2016. NOTE: If you are going to configure monitoring rules for SQL Server Availability Groups, provide the name of your Availability Group item in this field. - Database — Specify the database whose data changes you want to monitor. - Table — Specify database table to monitor. - Column—Specify table column name. The following column types are currently not supported: text, ntext, image, binary, varbinary, timestamp, sql_variant. These filters will be applied using AND logic. Wildcard (*) is supported and can be used to replace any number of characters. |
Audit SELECT
Use the settings in this section to configure how the successful SELECT statements should be audited.
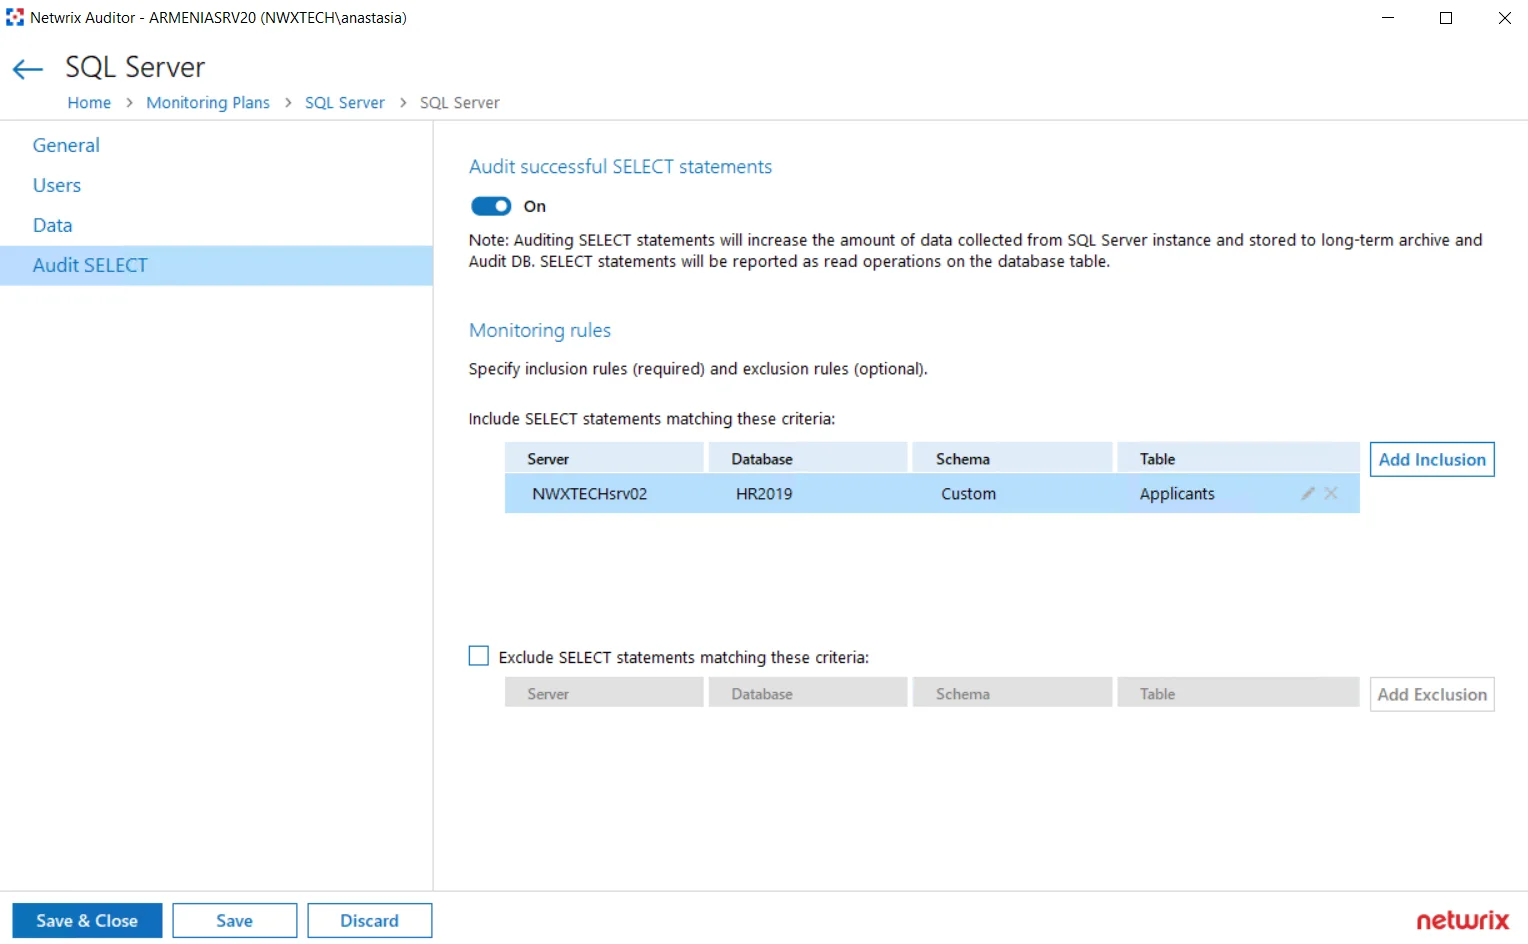
| Option | Description |
|---|---|
| --- | --- |
| --- | --- |
| Audit successful SELECT statements | Enable monitoring of successful SELECT statements for the database tables. Successful SELECT statement execution will be reported as Read operation on the database table. Auditing SELECT statements will increase the amount of data collected from the SQL Server instance and stored to long-term archive and audit database. Plan for your resources accordingly. |
| Monitoring rules | To specify what data changes will be monitored, you must create at least one inclusion rule. Exclusion rules are optional. Click Add Inclusion and specify the following: 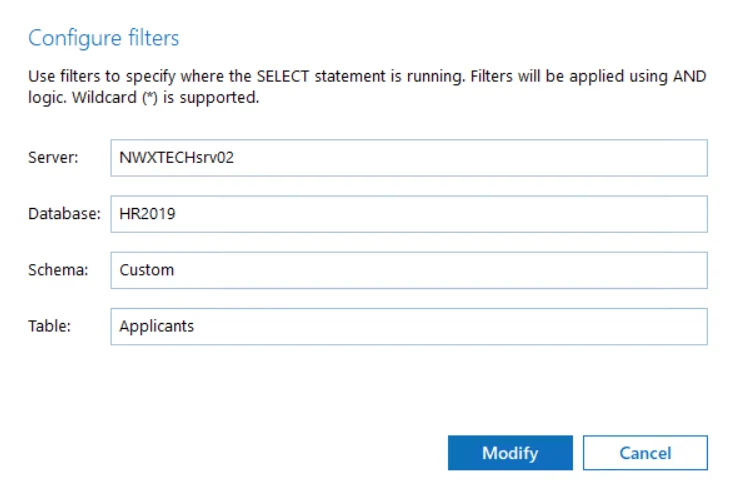 - Server — specify target SQL Server instance in the server\instance format. NOTE: If you are going to configure monitoring rules for SQL Server Availability Groups, provide the name of your Availability Group item in this field. - Database — specify target database - Schema — specify database schema - Table — specify database table you will monitor Wildcard (*) is supported and can be used to replace any number of characters. Filters will be applied using AND logic, that is, only SELECT statements matching all specified criteria will be monitored. So, in the example above, the program will track and report only the successful SELECT statements executed against the Applicants table of the HR2019 database with Custom schema, hosted on the SQLsrv02\TestInstance. When finished, click Add. If needed, configure the exclusion rules in a similar way. - Server — specify target SQL Server instance in the server\instance format. NOTE: If you are going to configure monitoring rules for SQL Server Availability Groups, provide the name of your Availability Group item in this field. - Database — specify target database - Schema — specify database schema - Table — specify database table you will monitor Wildcard (*) is supported and can be used to replace any number of characters. Filters will be applied using AND logic, that is, only SELECT statements matching all specified criteria will be monitored. So, in the example above, the program will track and report only the successful SELECT statements executed against the Applicants table of the HR2019 database with Custom schema, hosted on the SQLsrv02\TestInstance. When finished, click Add. If needed, configure the exclusion rules in a similar way. |
User Activity
NOTE: Prior to configuring your monitoring plan, please read and complete the instructions in the following topics:
-
Protocols and Ports Required – To ensure successful data collection and activity monitoring configure necessary protocols and ports for inbound and outbound connections
-
Data Collecting Account – Configure data collecting accounts as required to audit your IT systems
-
User Activity – Configure data source as required to be monitored
Complete the following fields:
| Option | Description |
|---|---|
| General | |
| Monitor this data source and collect activity data | Enable monitoring of the selected data source and configure Auditor to collect and store audit data. |
| Notify users about activity monitoring | You can enable the message that will be displayed when a user logs in and specify the message text. |
| Record video of user activity within sessions | - If disabled, only user session events will be collected (regardless of whether the user is idle or not). - If enabled, the product will both collect user session events and record video of user activity. By default, this option is disabled. |
| Video Recording For these settings to become effective, enable video recording on the General tab. | |
| Adjust video quality | Optimize video file by adjusting the following: - File size and video quality - Save video in grayscale - CPU load and Video smoothness. |
| Adjust video duration | Limit video file length by adjusting the following: - Recording lasts for <...> minutes—Video recording will be stopped after the selected time period. - User has been idle for <...> minutes—Video recording will be stopped if a user is considered inactive during the selected time period. If the Record video of user activity within sessions option is enabled, the User Sessions report shows active time calculated without including user idle period. Mind that a computer is considered to be idle by Windows if there has not been user interaction via the mouse or keyboard for a given time and if the hard drives and processors have been idle more than 90% of that time. - Free disk space is less than <...> MB—Video recording will be stopped when upon reaching selected disk space limit. - Consider user activity — Select one of the following: - Stop if user has been idle for <...> minutes. Select if you want video recording for a user to be stopped after the specified time period. - Continue video recording regardless of the user idle state. When selected, Netwrix Auditor continues video recording for idle users. |
| Set a retention period to clear stale videos | When the selected retention period is over, Netwrix Auditor deletes your video recordings. |
| Users | |
| Specify users to track their activity | Select the users whose activity should be recorded. You can select All users or create a list of Specific users or user groups. Certain users can also be added to Exceptions list. |
| Applications | |
| Specify applications you want to track | Select the applications that you want to monitor. You can select All applications or create a list of Specific applications. Certain applications can also be added to Exceptions list. |
| Monitored Computers | |
| For a newly created monitoring plan for User Activity, the list of monitored computers is empty. Add items to your monitoring plan and wait until Netwrix Auditor retrieves all computers within these items. See Add Items for Monitoringfor more information. The list contains computer name, its current status and last activity time. |
Review your data source settings and click Add to go back to your plan. The newly created data source will appear in the Data source list. As a next step, click Add item to specify an object for monitoring. See the Add Items for Monitoring topic for additional information.
How to Include/Exclude Applications
To create a list of application to include in / exclude from monitoring, you will need to provide:
-
Title — application title as shown on top of the application window, for example, MonthlyReport.docx - Word.
- Title can also be found in the "What" column of related Netwrix Auditor reports and search results, for example, in the User Sessions report.
-
Description — as shown in the Description column on theDetails tab of Windows Task Manager.
- Using Description can help to filter out several components of a single application — for example, all executables having TeamViewer 14 description belong to the same app (see the screenshot above).
To create a list of inclusions / exclusions for applications:
Step 1 – Click Add on the right of the list.
Step 2 – Enter application title and description you have identified.
Wildcards (*?) are supported and applied as follows:
- * - Notepad (the "Title" filter) will exclude all Notepad windows.
- colo?r * (the "Title" filter) will exclude all application window titles containing "color" or "colour".
Same logic applies to the inclusion rules.
Example
To exclude the Notepad application window with "Document1" open, add the following filter values:
-
In the Title filter enter "Document1.txt - Notepad":

-
In the Description filter, enter the corresponding value, here it will be "Notepad".
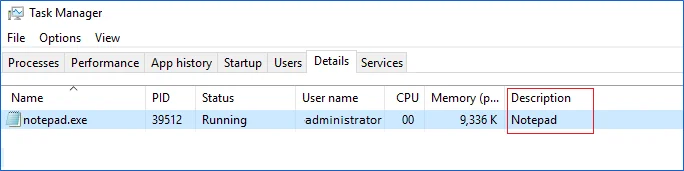
Computer
For evaluation purposes, Netwrix recommends selecting Computer as an item for a monitoring plan. Once the product is configured to collect data from the specified items, audit settings (including Core and Compression services installation) will be applied to all computers within AD Container or IP Range.
Complete the following fields:
| Option | Description |
|---|---|
| General | |
| Specify a computer | Provide a server name by entering its FQDN, NETBIOS or IPv4 address. You can click Browse to select a computer from the list of computers in your network. |
| Specify the account for collecting data | Select the account that will be used to collect data for this item. If you want to use a specific account (other than the one you specified during monitoring plan creation), select account type you want to use and enter credentials. The following choices are available: - User/password. The account must be granted the same permissions and access rights as the default account used for data collection. See the Data Collecting Account topic for additional information. - Group Managed Service Account (gMSA). You should specify only the account name in the domain\account$ format. See the Use Group Managed Service Account (gMSA) topic for additional information. |
IP Range
Complete the following fields:
| Option | Description |
|---|---|
| General | |
| Specify IP range | Specify an IP range for the audited computers. To exclude computers from within the specified range, click Exclude. Enter the IP subrange you want to exclude, and click Add. |
| Specify the account for collecting data | Select the account that will be used to collect data for this item. If you want to use a specific account (other than the one you specified during monitoring plan creation), select Custom account and enter credentials. The credentials are case sensitive. A custom account must be granted the same permissions and access rights as the default account used for data collection. See the Data Collecting Account topic for additional information. |
AD Container
Complete the following fields:
| Option | Description |
|---|---|
| General | |
| Specify AD container | Specify a whole AD domain, OU or container. Click Browse to select from the list of containers in your network. You can also: - Select a particular computer type to be audited within the chosen AD container: Domain controllers, Servers (excluding domain controllers), or Workstations. - Click Exclude to specify AD domains, OUs, and containers you do not want to audit. In the Exclude Containers dialog, click Add and specify an object. The list of containers does not include child domains of trusted domains. Use other options (Computer, IP range to specify the target computers. |
| Specify the account for collecting data | Select the account that will be used to collect data for this item. If you want to use a specific account (other than the one you specified during monitoring plan creation), select Custom account and enter credentials. The credentials are case sensitive. If using a group Managed Service Account (gMSA), you can specify only the account name in the domain\account$ format. Password field can be empty. A custom account must be granted the same permissions and access rights as the default account used for data collection. See theData Collecting Account topic for additional information. |
VMware
NOTE: Prior to configuring your monitoring plan, please read and complete the instructions in the following topics:
-
Protocols and Ports Required – To ensure successful data collection and activity monitoring configure necessary protocols and ports for inbound and outbound connections
-
Data Collecting Account – Configure data collecting accounts as required to audit your IT systems
-
VMware – Configure data source as required to be monitored
For this data source, specify the options you need:
| Option | Description |
|---|---|
| Monitor this data source and collect activity data | Enable monitoring of the selected data source and configure Auditor to collect and store audit data. |
| Monitor VMware configuration changes | Configuration changes are always monitored for VMware data source. See the Data Collection from VMware Servers topic for additional information. |
| Monitor VMware logon activity | Specify what types of logon events you want to monitor for VMware infrastructure. |
| Monitor SSO users/groups on vCenter and Local users on ESXi sever | Select Enable monitoring if you want to audit the following users and groups: - vCenter Single Sign-On (SSO) Users. The product collects data from vCenter. - Localos users. For these users, the product collects data from ESXi and vCenter. - VMware groups. The product collects data from vCenter. To audit users and groups, vCenter 6.5 and above required. Check that your data collecting account has all required rights and permissions. See the Permissions for VMware Server Auditing topic for additional information. |
| Collect data for state-in-time reports | Configure Auditor to store daily snapshots of your VMware system configuration required for further state-in-time reports generation. The product updates the latest snapshot on the regular basis to keep users up-to-date on actual system state. Only the latest snapshot is available for reporting in Auditor. If you want to generate reports based on different snapshots, you must import snapshots to the Audit Database. To import snapshots, you must be assigned the Global administrator or the Global reviewer role . Follow the steps to import snapshots. Step 1 – In the Manage historical snapshots section, click Manage. Step 2 – Select the snapshots that you want to import. Step 3 – Move the selected snapshots to the Snapshots available for reporting list using the arrow button. Step 4 – When finished, click OK. |
Review your data source settings and click Add to go back to your plan. The newly created data source will appear in the Data source list. As a next step, click Add item to specify an object for monitoring. See the Add Items for Monitoring topic for additional information.
Data Collection from VMware Servers
On a high level, data collection process for VMware servers works as follows:
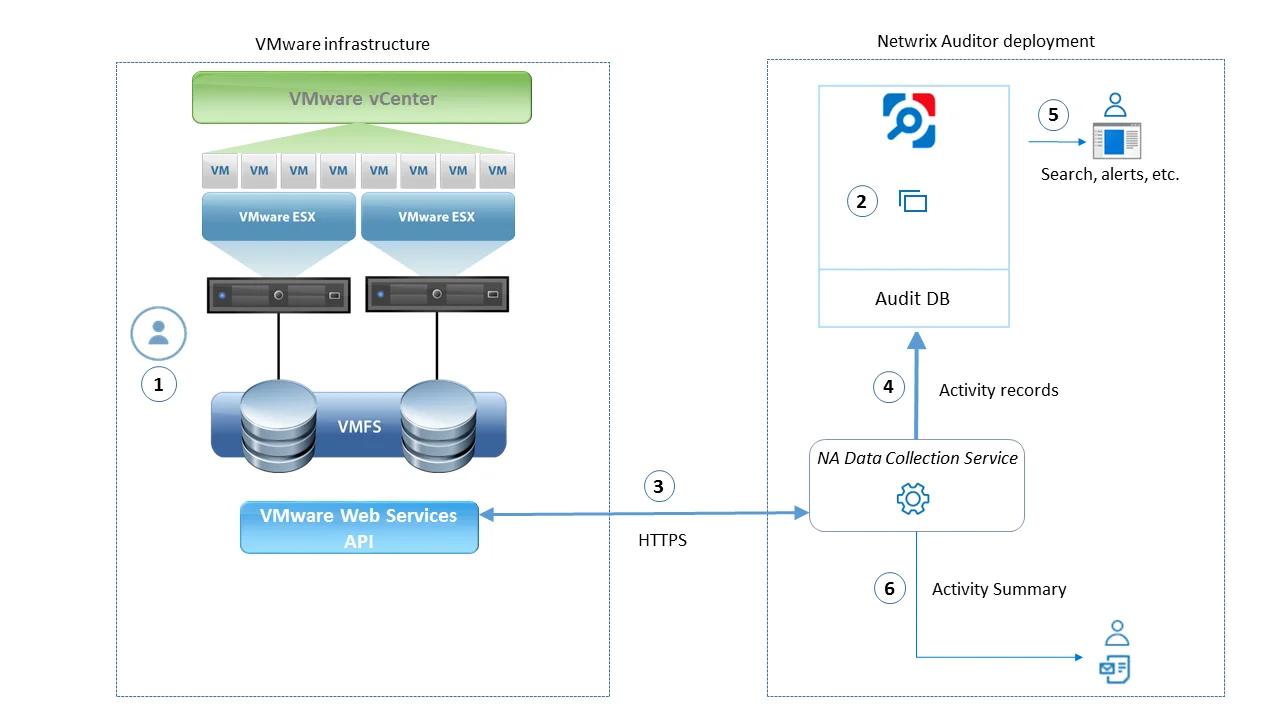
VMware administrator prepares a dedicated service account with sufficient permissions to collect data from VMware servers. This account must have at least Read Only role on those servers. For more information on VMware vSphere roles and permissions assignment, refer to this VMware article.
Netwrix administrator does the following:
-
Creates a monitoring plan in Netwrix Auditor, specifying the service account (prepared at step 1) as a data collecting account in the Monitoring Plan wizard. Then s/he adds items to the monitoring plan – these are VMware servers to collect data from.
-
Configures alerts related to VMware data source. Current version does not include predefined alerts for that data source, so follow the Create Alerts to create and configure the necessary alerts.
- Remember to set the filter to “Data Source_equals**_VMware**”.
-
Netwrix Auditor Data Collection Servicestarts periodic (every 15 min) data collection sessions. The results of each session include:
- VMware infrastructure snapshot collected from the monitored items, i.e. VMware vCenter or ESX(i) host
- VMware events that occurred since the previous data collection. Data is retrieved via VMware web services API using HTTPS protocol.
-
Netwrix Auditor Data Collection Service processes collected data into the proprietary format (Activity Records). Each Activity Record contains initiator’s account, time, action, and other details.
- To determine what has changed in the configuration, it compares a state snapshot from VMware server with the previously taken.
- To get ‘Who’ (initiator) and ‘When’ (date and time) information for the detected changes, the product uses VMware events data.
-
Netwrix Auditor Server then writes the Activity Records to the audit database (default retention – 180 days) and long-term archive (default retention – 120 months).
-
Users can work with collected data in Netwrix Auditor client UI: run search, view reports, and so on. If you have configured alerting in Netwrix Auditor, then the activities that match the certain criteria will trigger the alerts. Recipients will be notified by email, and response actions will be taken, if configured.
Netwrix Auditor also generates an Activity Summary once a day (by default, at 3 AM) and sends it to the specified recipients. This email lists VMware infrastructure changes and activities collected by Netwrix Auditor during the last 24 hours.
VMware ESX/ESXi/vCenter
Complete the following fields:
| Option | Description |
|---|---|
| General | |
| Specify VMware ESX, ESXi, or vCenter for monitoring | Specify the ESX or ESXi host URL, or vCenter Server URL. |
| Specify the account for collecting data | Select the account that will be used to collect data for this item. If you want to use a specific account (other than the one you specified during monitoring plan creation), select Custom account and enter credentials. The credentials are case sensitive. A custom account must be granted the same permissions and access rights as the default account used for data collection. See Permissions for VMware Server Auditing topic for more information. |
| Virtual Machines | |
| Specify monitoring restrictions | Select the virtual machines to be excluded from search results, reports and Activity Summaries. To add VMs to the list, click Add. Then provide the full path of the machine to exclude. Consider the following: - To exclude a single VM, provide its full path as shown in the "What" column of reports and Activity Summary, for example: Vcenters\VCenterServer021\VMs\vm01. - To exclude several VMs, you can define a mask using a wildcard, for example: - *\TestVM* — exclude VMs with names starting with TestVM (e.g., TestVM01, TestVM_new), located anywhere. - *TestVM* — exclude VMs with names containing TestVM (e.g., MyTestVM02). In addition to the restrictions for a monitoring plan, you can use the *.txt files to collect more granular audit data. Note that the new monitoring scope restrictions apply together with previous exclusion settings configured in the *.txt files. See the Monitoring Planstopic for additional information. |
Windows Server
NOTE: Prior to configuring your monitoring plan, please read and complete the instructions in the following topics:
-
Protocols and Ports Required – To ensure successful data collection and activity monitoring configure necessary protocols and ports for inbound and outbound connections
-
Data Collecting Account – Configure data collecting accounts as required to audit your IT systems
-
Windows Server – Configure data source as required to be monitored
Complete the following fields:
| Option | Description |
|---|---|
| General | |
| Monitor this data source and collect activity data | Enable monitoring of the selected data source and configure Auditor to collect and store audit data. |
| Monitor changes to system components | Select the system components that you want to audit for changes. Review the following for additional information: - General computer settings—Enables auditing of general computer settings. For example, computer name or workgroup changes. - Hardware—Enables auditing of hardware devices configuration. For example, your network adapter configuration changes. - Add/Remove programs—Enables auditing of installed and removed programs. For example, Microsoft Office package has been removed from the audited Windows Server. - Services—Enables auditing of started/stopped services. For example, the Windows Firewall service stopped. - Audit policies—Enables auditing of local advanced audit policies configuration. For example, the Audit User Account Management advanced audit policy is set to "Failure". - DHCP configuration—Enables auditing of DHCP configuration changes. - Scheduled tasks—Enables auditing of enabled / disabled / modified scheduled tasks. For example, the GoogleUpdateTaskMachineUA scheduled task trigger changes. - Local users and groups—Enables auditing of local users and groups. For example, an unknown user was added to the Administrators group. - DNS configuration—Enables auditing of your DNS configuration changes. For example, your DNS security parameters' changes. - DNS resource records—Enables auditing of all types of DNS resource records. For example, A-type resource records (Address record) changes. - File shares—Enables auditing of created / removed / modified file shares and their properties. For example, a new file share was created on the audited Windows Server. - Removable media—Enables auditing of USB thumb drives insertion. |
| Specify data collection method | You can enable network traffic compression. If enabled, a Compression Service will be automatically launched on the audited computer, collecting and prefiltering data. This significantly improves data transfer and minimizes the impact on the target computer performance. |
| Configure audit settings | You can adjust audit settings automatically. Your current audit settings will be checked on each data collection and adjusted if necessary. This method is recommended for evaluation purposes in test environments. If any conflicts are detected with your current audit settings, automatic audit configuration will not be performed. Do not select the checkbox if you want to configure audit settings manually. See the Windows Server configuration topic for additional information about audit settings required to collect comprehensive audit data and the instructions on how to configure them. |
| Collect data for state-in-time reports | Configure Auditor to store daily snapshots of your system configuration required for further state-in-time reports generation. See the State–In–Time Reports topic for additional information. When auditing file servers, changes to effective access permissions can be tracked in addition to audit permissions. By default, Combination of file and share permissions is tracked. File permissions define who has access to local files and folders. Share permissions provide or deny access to the same resources over the network. The combination of both determines the final access permissions for a shared folder—the more restrictive permissions are applied. Upon selecting Combination of file and share permissions only the resultant set will be written to the Audit Database. Select File permissions option too if you want to see difference between permissions applied locally and the effective file and share permissions set. To disable auditing of effective access, unselect all checkboxes under Include details on effective permissions. In the Schedule state-in-time data collection section, you can select a custom weekly interval for snapshots collection. Click Modify and select day(s) of week you want your snapshot to be collected. In the Manage historical snapshots section, you can click Manage and select the snapshots that you want to import to the Audit Database to generate a report on the data source's state at the specific moment in the past. You must be assigned the Global administrator or the Global reviewer role to import snapshots. Move the selected snapshots to the Snapshots available for reporting list using the arrow button. The product updates the latest snapshot on the regular basis to keep users up to date on actual system state. Users can also configure Only the latest snapshot is available for reporting in Auditor. If you want to generate reports based on different snapshots, you must import snapshots to the Audit Database. |
| Activity | |
| Specify monitoring restrictions | Specify restriction filters to narrow your Windows Server monitoring scope (search results, reports and Activity Summaries). For example, you can exclude system activity on a particular objects on all computers. All filters are applied using AND logic. Click Add and complete the following fields: - User who initiated the change: – provide the name of the user whose changes you want to ignore as shown in the "Who" column of reports and Activity Summaries. Example: mydomain\user1. You can provide the "System" value to exclude events containing the “System” instead of an account name in the “Who” column. - Windows Server which setting was changed: – provide the name of the server in your IT infrastructure whose changes you want to ignore as shown in the "What" column of reports and Activity Summaries. Example: winsrv2016-01.mydomain.local. - Setting changed: – provide the name for unwanted settings as shown in the "What" column in reports and Activity Summaries. Example: System Properties*. You can use a wildcard (*) to replace any number of characters in filters. In addition to the restrictions for a monitoring plan, you can use the *.txt files to collect more granular audit data. Note that the new monitoring scope restrictions apply together with previous exclusion settings configured in the *.txt files. See the Monitoring Planstopic for additional information. |
Review your data source settings and click Add to go back to your plan. The newly created data source will appear in the Data source list. As a next step, click Add item to specify an object for monitoring. See the Add Items for Monitoring topic for additional information.
Computer
Select the account that will be used to collect data for this item. If you want to use a specific account (other than the one you specified during monitoring plan creation), select account type you want to use and enter credentials. The following choices are available:
- User/password. The account must be granted the same permissions and access rights as the default account used for data collection. See the Data Collecting Account topic for additional information.
- Group Managed Service Account (gMSA). You should specify only the account name in the domain\account$ format. See the Use Group Managed Service Account (gMSA) topic for additional information.
IP Range
Complete the following fields:
| Option | Description |
|---|---|
| General | |
| Specify IP range | Specify an IP range for the audited computers. To exclude computers from within the specified range, click Exclude. Enter the IP subrange you want to exclude, and click Add. |
| Specify the account for collecting data | Select the account that will be used to collect data for this item. If you want to use a specific account (other than the one you specified during monitoring plan creation), select Custom account and enter credentials. The credentials are case sensitive. A custom account must be granted the same permissions and access rights as the default account used for data collection. See the Data Collecting Account topic for additional information. |
AD Container
Complete the following fields:
| Option | Description |
|---|---|
| General | |
| Specify AD container | Specify a whole AD domain, OU or container. Click Browse to select from the list of containers in your network. You can also: - Select a particular computer type to be audited within the chosen AD container: Domain controllers, Servers (excluding domain controllers), or Workstations. - Click Exclude to specify AD domains, OUs, and containers you do not want to audit. In the Exclude Containers dialog, click Add and specify an object. The list of containers does not include child domains of trusted domains. Use other options (Computer, IP range to specify the target computers. |
| Specify the account for collecting data | Select the account that will be used to collect data for this item. If you want to use a specific account (other than the one you specified during monitoring plan creation), select Custom account and enter credentials. The credentials are case sensitive. Starting with version 9.96, you can use group Managed Service Accounts (gMSA) as data collecting accounts. If using a group Managed Service Account, you can specify only the account name in the domain\account$ format. Password field can be empty. A custom account must be granted the same permissions and access rights as the default account used for data collection. See theData Collecting Account topic for additional information. |
| Containers and Computers | |
| Monitor hidden shares | By default, Auditor will monitor all shares stored in the specified location, except for hidden shares (both default and user-defined). Select Monitor user-defined hidden shares if necessary. Even when this option is selected, the product will not collect data from administrative hidden shares such as: default system root or Windows directory (ADMIN$), default drive shares (D$, E$, etc.), shares used by printers to enable remote administration (PRINT$), etc. |
| Specify monitoring restrictions | Specify restriction filters to narrow your monitoring scope (search results, reports and Activity Summaries). All filters are applied using AND logic. Depending on the type of the object you want to exclude, select one of the following: - Add AD Container – Browse for a container to be excluded from being audited. You can select a whole AD domain, OU or container. - Add Computer – Provide the name of the computer you want to exclude as shown in the "Where" column of reports and Activity Summaries. For example, backupsrv01.mydomain.local. Wildcards (*) are not supported. In addition to the restrictions for a monitoring plan, you can use the *.txt files to collect more granular audit data. Note that the new monitoring scope restrictions apply together with previous exclusion settings configured in the *.txt files. See the Monitoring Planstopic for additional information. |
For evaluation purposes, Netwrix recommends selecting Computer as an item for a monitoring plan. Once the product is configured to collect data from the specified items, audit settings (including Core and Compression services installation) will be applied to all computers within AD Container or IP Range.
Complete the following fields:
| Option | Description |
|---|---|
| General | |
| Specify a computer | Provide a server name by entering its FQDN, NETBIOS or IPv4 address. You can click Browse to select a computer from the list of computers in your network. |
| Specify the account for collecting data | Select the account that will be used to collect data for this item. If you want to use a specific account (other than the one you specified during monitoring plan creation), select Custom account and enter credentials. The credentials are case sensitive. A custom account must be granted the same permissions and access rights as the default account used for data collection. See the Data Collecting Account topic for additional information. |
| Scope | |
| Monitor hidden shares | By default, Auditor will monitor all shares stored in the specified location, except for hidden shares (both default and user-defined). Select Monitor user-defined hidden shares if necessary. Even when this option is selected, the product will not collect data from administrative hidden shares such as: default system root or Windows directory (ADMIN$), default drive shares (D$, E$, etc.), shares used by printers to enable remote administration (PRINT$), etc. |
| Specify monitoring restrictions | Specify restriction filters to narrow your monitoring scope (search results, reports and Activity Summaries). All filters are applied using AND logic. |