VMware
Read and complete the instructions in the following topics before configuring your monitoring plan:
-
Protocols and Ports Required – To ensure successful data collection and activity monitoring configure necessary protocols and ports for inbound and outbound connections
-
Data Collecting Account – Configure data collecting accounts as required to audit your IT systems
-
VMware – Configure the data source as required for monitoring
For this data source, specify the options you need:
| Option | Description |
|---|---|
| Monitor this data source and collect activity data | Enable monitoring of the selected data source and configure Auditor to collect and store audit data. |
| Monitor VMware configuration changes | Auditor always monitors configuration changes for the VMware data source. See the Data Collection from VMware Servers topic for additional information. |
| Monitor VMware logon activity | Specify what types of logon events you want to monitor for VMware infrastructure. |
| Monitor SSO users/groups on vCenter and Localos users on ESXi server | Select Enable monitoring if you want to audit the following users and groups:
|
| Collect data for state-in-time reports | Configure Auditor to store daily snapshots of your VMware system configuration needed to generate state-in-time reports. The product updates the latest snapshot regularly to keep users up to date on the actual system state. Only the latest snapshot is available for reporting in Auditor. |
| Manage historical snapshots | If you want to generate reports based on different snapshots, you must import snapshots to the Audit Database. See the Import Historical Snapshots procedure. |
Review your data source settings and click Add to go back to your plan. The newly created data source will appear in the Data source list. As a next step, click Add item to specify an object for monitoring. See the Add Items for Monitoring topic for additional information.
Import Historical Snapshots
To import snapshots and generate reports based on snapshots other than the latest one:
Step 1 – In the Manage historical snapshots section, click Manage.
Step 2 – Select the snapshots that you want to import.
Step 3 – Move the selected snapshots to the Snapshots available for reporting list using the arrow button.
Step 4 – When finished, click OK.
Data Collection from VMware Servers
In general, the data collection process for VMware servers works as follows:
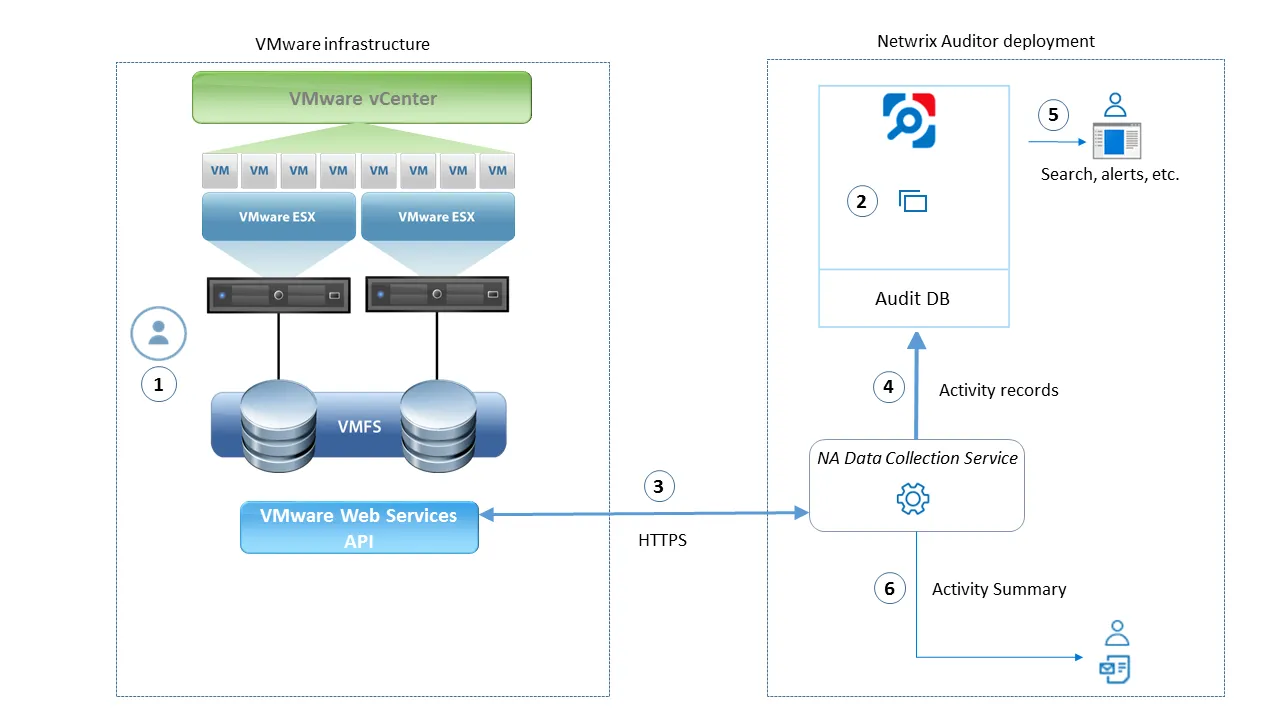
VMware administrator prepares a dedicated service account with sufficient permissions to collect data from VMware servers. This account must have at least Read-only role on those servers. Collecting state-in-time data and auditing users and groups requires additional permissions. See the Permissions for VMware Server Auditing topic for additional information.
Netwrix administrator does the following:
-
Creates a monitoring plan in Netwrix Auditor, specifying the service account (prepared at step 1) as a data collecting account in the Monitoring Plan wizard. Then they add items to the monitoring plan – these are VMware servers to collect data from.
-
Configures alerts related to VMware data source. Netwrix Auditor includes one predefined alert for this data source, Multiple failed logons to VMware. To create additional alerts, follow the Create Alerts topic.
- Remember to set the filter to “Data Source equals VMware”.
-
Netwrix Auditor Data Collection Service starts periodic (every 15 min) data collection sessions. The results of each session include:
- VMware infrastructure snapshot collected from the monitored items, i.e. VMware vCenter or ESX(i) host
- VMware events that occurred since the previous data collection. The service retrieves data via the VMware web services API using the HTTPS protocol.
-
Netwrix Auditor Data Collection Service processes collected data into the proprietary format (Activity Records). Each Activity Record contains initiator’s account, time, action, and other details.
- To determine what has changed in the configuration, it compares a state snapshot from VMware server with the previously taken.
- To get ‘Who’ (initiator) and ‘When’ (date and time) information for the detected changes, the product uses VMware events data.
-
Netwrix Auditor Server then writes the Activity Records to the audit database (default retention – 180 days) and long-term archive (default retention – 120 months).
-
Users can work with collected data in Netwrix Auditor client UI: run search, view reports, and so on. If you have configured alerting in Netwrix Auditor, activities that match your criteria trigger the alerts. Netwrix Auditor notifies recipients by email and performs response actions, if configured.
Netwrix Auditor also generates an Activity Summary once a day (by default, at 3 AM) and sends it to the specified recipients. This email lists the VMware infrastructure changes and activities that Netwrix Auditor collected during the last 24 hours.
VMware ESX/ESXi/vCenter
Complete the following fields:
| Option | Description |
|---|---|
| General | |
| Specify VMware ESX, ESXi, or vCenter for monitoring | Specify the ESX or ESXi host URL, or vCenter Server URL. |
| Specify the account for collecting data | Select the account to use for collecting data for this item. If you want to use a specific account (other than the one you specified during monitoring plan creation), select Custom account and enter credentials. The credentials are case sensitive. A custom account must have the same permissions and access rights as the default account used for data collection. See Permissions for VMware Server Auditing topic for more information. |
| Virtual Machines | |
| Specify monitoring restrictions | Select the virtual machines to exclude from search results, reports, and Activity Summaries. To add VMs to the list, click Add. Then provide the full path of the machine to exclude. Consider the following:
|