Navigation
Starting with version 10, the home screen in Netwrix Auditor is customizable so you can instantly get access to the information that is most relevant to you. This section covers the tiles are available and how you can use them to create the home screen that works best for you. It also illustrates the customization process with several common scenarios.
Home Screen Tiles
Home Screen Tiles in the Netwrix Auditor provide an interface that allows users to access main information. The following tiles are displayed on the initially configured Home Screen:
- Welcome to Netwrix Auditor Tile
- Audit Intelligence Tiles
- Configuration Tile
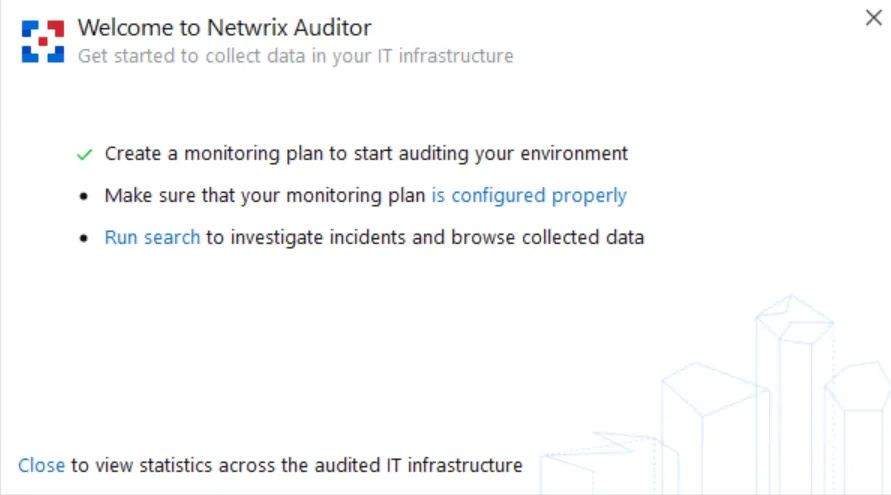
Welcome to Netwrix Auditor Tile
The Welcome to Netwrix Auditor Tile tile provides a checklist you can use to get started collecting and viewing data about your IT ecosystem.
-
The "Create a monitoring plan" link prompts you to create a monitoring plan for at least one data source (such as Active Directory, Exchange Online or network devices). For detailed instructions on how to create a monitoring plan, see the Monitoring Plans topic for additional information. Wait until the initial data collection completes.
-
Clicking the second link opens a dashboard that lists all the monitoring plans you’ve created, along with the status and last activity time for each. Review this list and address any errors or warnings. See the Monitoring Overview topic for additional information.
-
Once have created a monitoring plan and verified that it is properly configured, run one or more searches to get insights into your IT infrastructure. See the View and Search Collected Data topic for additional information.
When you have completed these three steps, you can close this tile by clicking the "Close" link at the bottom. The checklist will be replaced by statistics across your audited systems. See the Customize Home Screen topic for additional information.
Audit Intelligence Tiles
This section contains four tiles for getting security intelligence about your IT infrastructure:

| Tile | Description |
|---|---|
| NEW MONITORING PLAN | Create a new monitoring plan for a particular data source. See the Create a New Monitoring Plan topic for additional information. |
| SEARCH ACTIVITY RECORDS | Investigate incidents by running interactive searches using data collected across the entire IT infrastructure. See the View and Search Collected Data topic for additional information. |
| REPORTS | Access the predefined reports for each data source and create custom reports. See the Reports topic for additional information. |
| BEHAVIOR ANOMALIES | Detect and investigate unusual behavior in your IT environment. See the Behavior Anomalies topic for additional information. |
Configuration Tile
This tile helps you set up and fine-tune auditing of your IT infrastructure. It includes the following links:
| Option | Description |
|---|---|
| Monitoring plans | Opens the Monitoring plans wizard, where you can add, edit and delete monitoring plans, as well as group them into folders. See the Monitoring Plans topic for additional information. |
| Subscriptions | Opens the Subscriptions wizard, which enables you to subscribe to Auditor reports and searches, so you can easily stay informed about what is going on in your infrastructure. See the Subscriptions topic for additional information. |
| Alert settings | Opens the All Alerts wizard, where you can create, edit, and enable or disable alerts on critical events in your environment. See the Alertstopic for additional information. |
Risk Assessment, Compliance Mapping, Live News, and Health Tiles
| Tile | Description |
|---|---|
| RISK ASSESSMENT | Opens the Risk Assessment Overview dashboard, which identifies possible configuration issues in your environment that could impact security. See the IT Risk Assessment Overview topic for additional information. |
| COMPLIANCE MAPPING | Enables you to review how Auditor can help you comply common standards and regulations. See the Compliance Mappings topic for additional information. |
| LIVE NEWS | Shows the latest Netwrix news, including product updates. |
| HEALTH STATUS | Opens the Health Status dashboard, which provides at-a-glance insight into product health, data collection, storage and more. See the Health Status Dashboard topic for additional information. |
| ALERTS HISTORY | Clicking this tile opens the Alerts History dashboard, which provides detailed information about the latest alerts triggered in your IT infrastructure, enriched with actionable charts and timelines. See the Alerts Overview Dashboard topic for additional information. |
Favorite Reports
Initially, the Favorite Reports tile lists the reports that our customers use most frequently. You can add and remove reports to reflect your needs and interests. If you have more favorite reports than can fit in the tile, simply click View all to see the complete list. See the Customizing Favorite Reports topic for additional information.
Other
 | Opens the Alerts Overview dashboard, which lists the latest alerts triggered in your IT infrastructure, enriched with actionable charts and timelines. See the Alerts Overview Dashboard topic for additional information. |
 | This tile shows the current number of users, groups, and files and folders in your IT infrastructure in one place. Clicking the link opens the corresponding report: - Users — User Accounts state-in-time report for Active Directory - Groups — Groups state-in-time report for Active Directory - Files and Folders — Folder Tree View state-in-time report for File Servers Click Recalculate to update values. |
 | Clicking the tile opens the Monitoring Overview dashboard, which shows the current status of each of your monitoring plans. See the Monitoring Overview topic for additional information. |
 | Clicking the tile opens the Activity Record Statistics dashboard which shows the number of activity records that were collected from your data sources during the last 7 days. See the Activity Records Statistics topic for additional information. |
 | Opens the listed Auditor report. See the Custom Search-Based Reports topic for additional information. |
 | Opens the listed Auditor report. See the Predefined Reports topic for additional information. |
 | Opens the list of the configuration recommendations provided by Netwrix industry experts to take advantage of the Auditor functionality. See the Recommendations topic for additional information. |