Work with Collected Data
To leverage data collected with the add-on, you can do the following in Auditor:
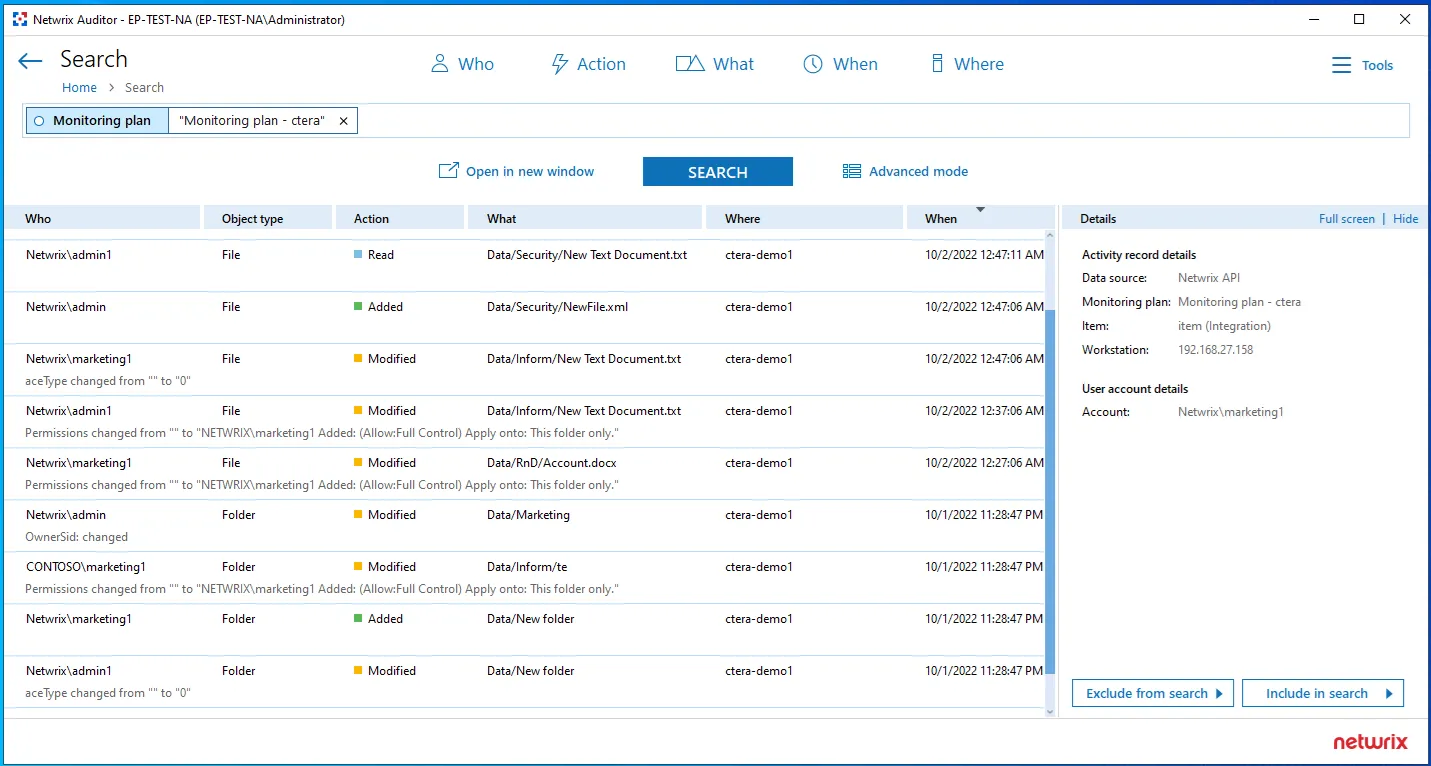
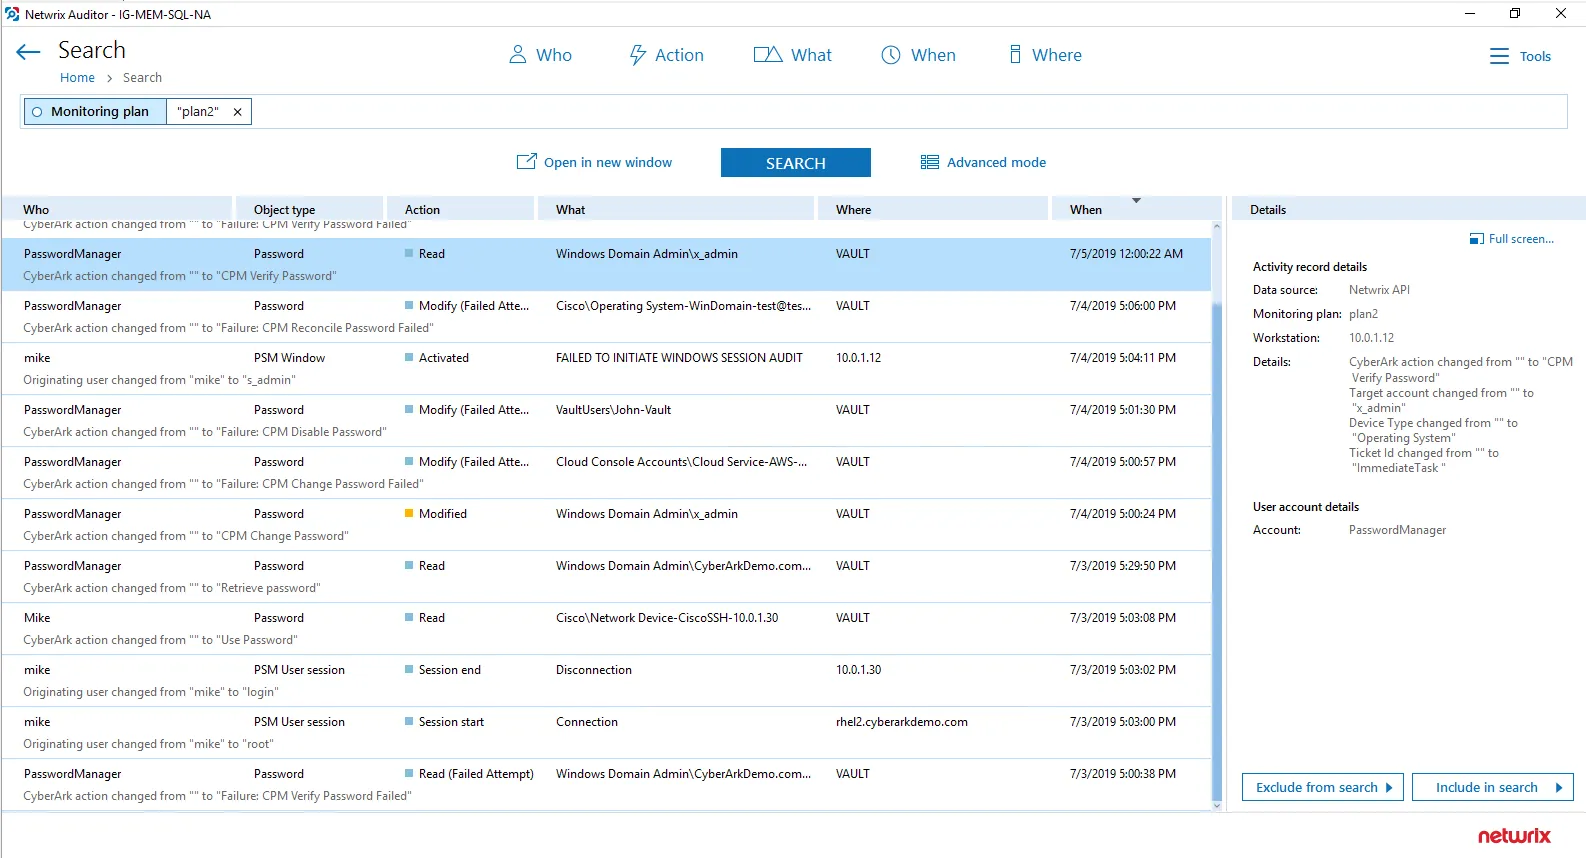
- Search for required data. For that, start Auditor client and navigate to Search. After specifying the criteria you need, click Search. You will get a list of activity records with detailed information on who did what in the reported time period.
You can apply a filter to narrow down your search results to the Netwrix API data source only.
- Also, you can click Tools in the upper-right corner and select the command you need. For
example:
- If you want to periodically receive the report on the results of search with the specified criteria, click Subscribe. Then specify how you want the report to be delivered – as an email or as a file stored to the file share.
- To create an alert on the specific occurrences, click Create alert.
- To export filtered data to PDF or CSV, click Export data.
- You can also configure and receive alerts on the events you are interested in.
See the following topics for additional information:
To leverage data collected with the add-on, you can do the following in Auditor:
- Search for required data. For that, start Auditor client and navigate to Search. After specifying the criteria you need, click Search. You will get a list of activity records with detailed information on who did what in the reported time period.
You can apply a filter to narrow down your search results to the Netwrix API data source only.
- Also, you can click Tools in the upper-right corner and select the command you need. For
example:
- If you want to periodically receive the report on the results of search with the specified criteria, click Subscribe. Then specify how you want the report to be delivered – as an email or as a file stored to the file share.
- To create an alert on the specific occurrences, click Create alert.
- To export filtered data to PDF or CSV, click Export data.
- You can also configure and receive alerts on the events you are interested in.
See the following topics for additional information:
Install Add-On
Follow the steps to install the Add-On:
Step 1 – Navigate to your add-on package.
Step 2 – Unzip the Add-On to a desired folder.
Step 3 – Run the installation package.
Step 4 – Accept the license agreement and follow the instructions of the setup wizard.
Step 5 – On the Destination Folder step, specify the installation folder (C:\Program Files (x86)\Netwrix Add-ons<Add-on name> by default).
Step 6 – Click Install.
Step 7 – When done, click Finish.
Ctera
The add-on works in collaboration with Netwrix Auditor, supplying data about activity on your Ctera-based devices. Aggregating data into a single audit trail simplifies analysis, makes activity monitoring more cost effective, and helps you keep tabs on your IT infrastructure.
Implemented as a service, this add-on facilitates the data transition from Ctera-based systems to Netwrix Auditor. All you have to do is provide connection details and specify parsing rules.
On a high level, the add-on works as follows:
- The add-on listens to the specified UDP ports and captures designated Syslog messages.
- The add-on processes these events into Netwrix Auditor-compatible format (Activity Records). Each Activity Record contains the user account, action, time, and other details.
- Using the Integration API, the add-on sends the activity records to the Netwrix Auditor Server, which writes them to the Long-Term Archive and the Audit Database.
See the Integration API topic for additional information on the structure of the Activity Record and the capabilities of the Integration API.
Prerequisites
Before running the add-on, ensure that all the necessary components and policies are configured as follows:
| On... | Ensure that... |
|---|---|
| The Auditor Server side | - The Audit Database settings are configured in Auditor Server. See the Prerequisites and Audit Database topics for additional information. - The TCP 9699 port (default Integration API port) is open for inbound connections. - The user writing data to the Audit Database is granted the Contributor role in Auditor. See the Role-Based Access and Delegation topic for additional information. Alternatively, you can grant the Global administrator role or add the user to the Netwrix Auditor Administrators group. In this case, this user will have the most extended permissions in the product. |
| The computer where the add-on will be installed | - The UDP 514 port is open for inbound connections. - .Net Framework 4.7.2 and above is installed. Review the following Microsoft technical article for additional information on how to install .Net Framework 4.7.2: Microsoft .NET Framework 4.7.2 offline installer for Windows. |
Configure Logging for CTERA Edge Filer
Prior to start using the Add-On, configure syslog logging settings on your CTERA Edge Filers. See the Configuring Syslog Settings article on the CTERA product documentation portal for detailed instructions.
Accounts and Rights
By default, the add-on will run under the Local System account. The add-on and Auditor must be installed on the same server.
Considerations and Limitations
- The Add-On must be deployed in the same subnet as CTERA Edge Filer and Auditor.
- If the monitoring plan name in the
<NetwrixAuditorPlan>add-on configuration parameter is specified incorrectly, this may lead to temp files generation and, therefore, to inefficient disk space usage. - If you are using Netwrix Auditor for Network Devices, the 514 UDP port may be already in use, and you should specify another port when configuring the add-on settings (see the Install Add-On and Define Parameters topics for additional information). Another option is to install the add-on and Auditor Server on different machines.
Compatibility Notice
Make sure to check your product version, and then review and update your add-ons and scripts leveraging Netwrix Auditor Integration API. Download the latest add-on version in the Add-on Store.
Define Parameters
The configuration wizard opens in the default web browser:
Click Proceed and complete the following fields:
| Option | Description |
|---|---|
| Specify General Settings | |
| Listed UDP port | Specify UDP port for listening incoming events. (514 by default). |
| Auditor Endpoint | Auditor Server IP address and port number followed by endpoint for posting Activity Records. Assumes that the add-on runs on the computer hostingAuditor Server and uses default port 9699. If you want to run the add-on on another machine, provide a name of the computer where Auditor Server resides (e.g., 172.28.6.15, EnterpriseNAServer, WKS.enterprise.local). To specify a non-default port, provide a server name followed by the port number (e.g., WKS.ent erprise.local:9999). Do not modify the endpoint part (/ netwrix/ api ) |
| Certificate Thumbprint | Netwrix Auditor Certificate Thumbprint Property. Possible values: - Empty—Check Auditor certificate via Windows Certificate Store. - AB:BB:CC—Check Auditor Server certificate thumbprint identifier. - NOCHECK—Do not check Auditor certificate. Make sure to select this parameter if you plan to specify servers by their IP. |
| Specify Active Directory credentials | |
| Username | Provide the name of the account under which the service runs. Unless specified, the service runs under the account currently logged on. |
| Password | Provide the password for the selected account. |
| Auditor Monitoring Plan settings | |
| Auditor Plan | Unless specified, data is written to Netwrix_Auditor_API database and is not associated with a specific monitoring plan. Specify a name of associated monitoring plan in Auditor. In this case, data will be written to a database linked to this plan. If you select a plan name in the add- on, make sure a dedicated plan is created in Auditor, the Netwrix API data source is added to the plan and enabled for monitoring. Otherwise, the add- on will not be able to write data to the Audit Database. |
| Auditor Plan Item | Unless specified, data is not associated with a specific plan and, thus, cannot be filtered by item name. Specify an item name. Make sure to create a dedicated item inAuditor in advance. |
| Accept List | |
| Address | Specify a list of IP addresses of syslog events sources. The service will collect and process events from these sources only. Events collected from any other source will be ignored. |
Click Run to start collecting data with the Add-On.