Work with Collected Data
To leverage data collected with the add-on, you can do the following in Auditor:
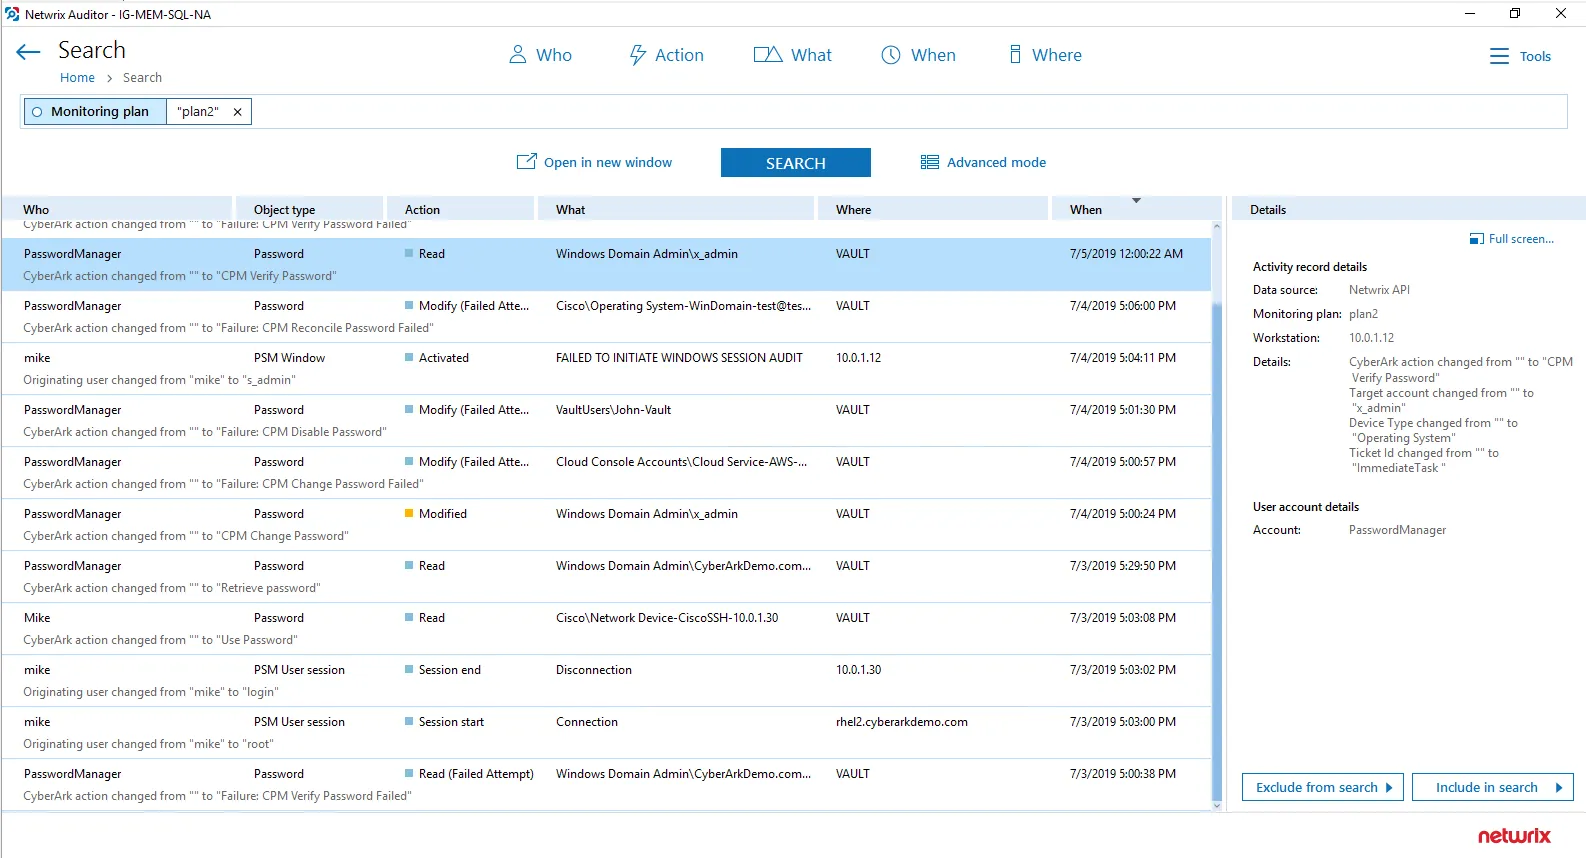
- Search for required data. For that, start Auditor client and navigate to Search. After specifying the criteria you need, click Search. You will get a list of activity records with detailed information on who did what in the reported time period.
You can apply a filter to narrow down your search results to the Netwrix API data source only.
- Also, you can click Tools in the upper-right corner and select the command you need. For
example:
- If you want to periodically receive the report on the results of search with the specified criteria, click Subscribe. Then specify how you want the report to be delivered – as an email or as a file stored to the file share.
- To create an alert on the specific occurrences, click Create alert.
- To export filtered data to PDF or CSV, click Export data.
- You can also configure and receive alerts on the events you are interested in.
See the following topics for additional information:
Deploy the Add-On
Follow the steps to deploy the Add-On:
Step 1 – Prepare Auditorfor data processing.
Step 2 – Configure Syslog message forwarding in CyberArk.
Step 3 – Download the Add-On.
Step 4 – Install Add-on.
Step 5 – Configure Add-on parameters
Prepare Auditor for Data Processing
In Auditor client, go to the Integrations section and verify Integration API settings:
- Make sure the Leverage Integration API is switched to ON.
- Check the TCP communication port number – default is 9699.
See the Prerequisites topic for additional information.
By default, activity records are written to Netwrix_Auditor_API database which is not associated with a specific monitoring plan.
Optionally, you can create a dedicated monitoring plan in Auditor. In this case, data will be written to a database linked to this plan. Target it at Netwrix API data source and enable for monitoring. Add a dedicated item of Integration type to the plan for data to be filtered by item name. See the Integration API topic for additional information.
In such scenario, you will need to specify this monitoring plan in the naplan and naplanitem
attributes of the <AcceptList> ® <Address> configuration parameters. See the
Add-On Parameters topic for additional information.
Configure Syslog Message Forwarding in CyberArk
On the CyberArk side, you need to specify the server that will receive Syslog messages from CyberArk, process them and forward to Auditor Server. This will be the add-on installation server (the machine where SyslogService.exe runs).
Follow the steps to configure Syslog message forwarding in CyberArk.
Step 1 – Log in to your CyberArk system.
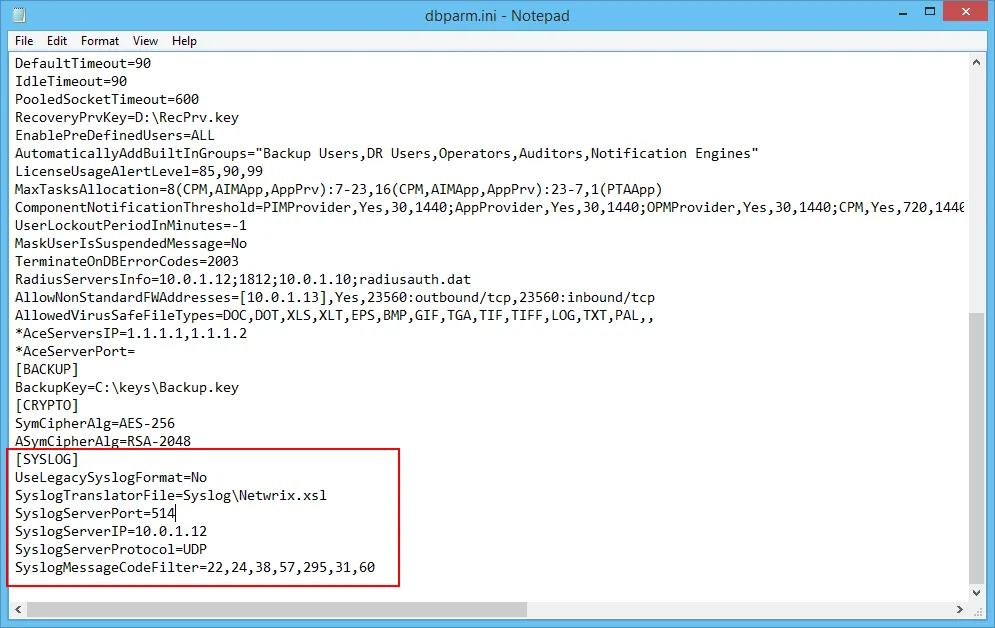
Step 2 – On the CyberArk server, locate the %Program Files (x86)%\PrivateArk\Server\Conf folder and open the dbparam.ini file for editing.
Step 3 – Go to the [SYSLOG] section and configure the following parameters:
- SyslogTranslatorFile – relative path to Netwrix.xsl file. You will need to create this
file manually and copy the content of SyslogTranslator.sample.xsl file into it. This sample
file is provided by CyberArk. By default, it is located in the %Program Files (x86)
%\PrivateArk\Server\Syslog folder.
Place the Netwrix.xsl file there, too, so that default relative path should be \Server\Syslog. - SyslogServerPort – communication port of the syslog server (i.e. add-on installation server). Default is 514. Note that if you are using Netwrix Auditor for Network Devices, this port may be already in use, and you should provide another one.
- SyslogServerIP - IP address of the add-on installation server.
- SyslogServerProtocol – communication protocol for data transfer between CyberArk system and the add-on. Specify UDP protocol.
- SyslogMessageCodeFilter - IDs of events to forward. The add-on will only collect and process events you specify in this parameter. For the full list of supported events, see Monitored Events. Use comma as a separator.
Step 4 – Save the dbparam.ini file.
Download the Add-On
Step 1 – Download the distribution package Netwrix_Auditor_Add-on_for_CyberArk_PAS.zip.
Step 2 – Unpack it to a folder on the computer where you plan to deploy the add-on.
Remember, deploy the add-on on the same machine with the Auditor Server.
Install Add-On
Follow the steps to install the Add-On:
Step 3 – Navigate to your add-on package.
Step 4 – Unzip the Add-On to a desired folder.
Step 5 – Run the installation package.
Step 6 – Accept the license agreement and follow the instructions of the setup wizard.
Step 7 – On the Destination Folder step, specify the installation folder (C:\Program Files (x86)\Netwrix Add-ons<Add-on name> by default).
Step 8 – Click Install.
Step 9 – When done, click Finish.
Configure Add-on Parameters
The configuration wizard opens in the default web browser:
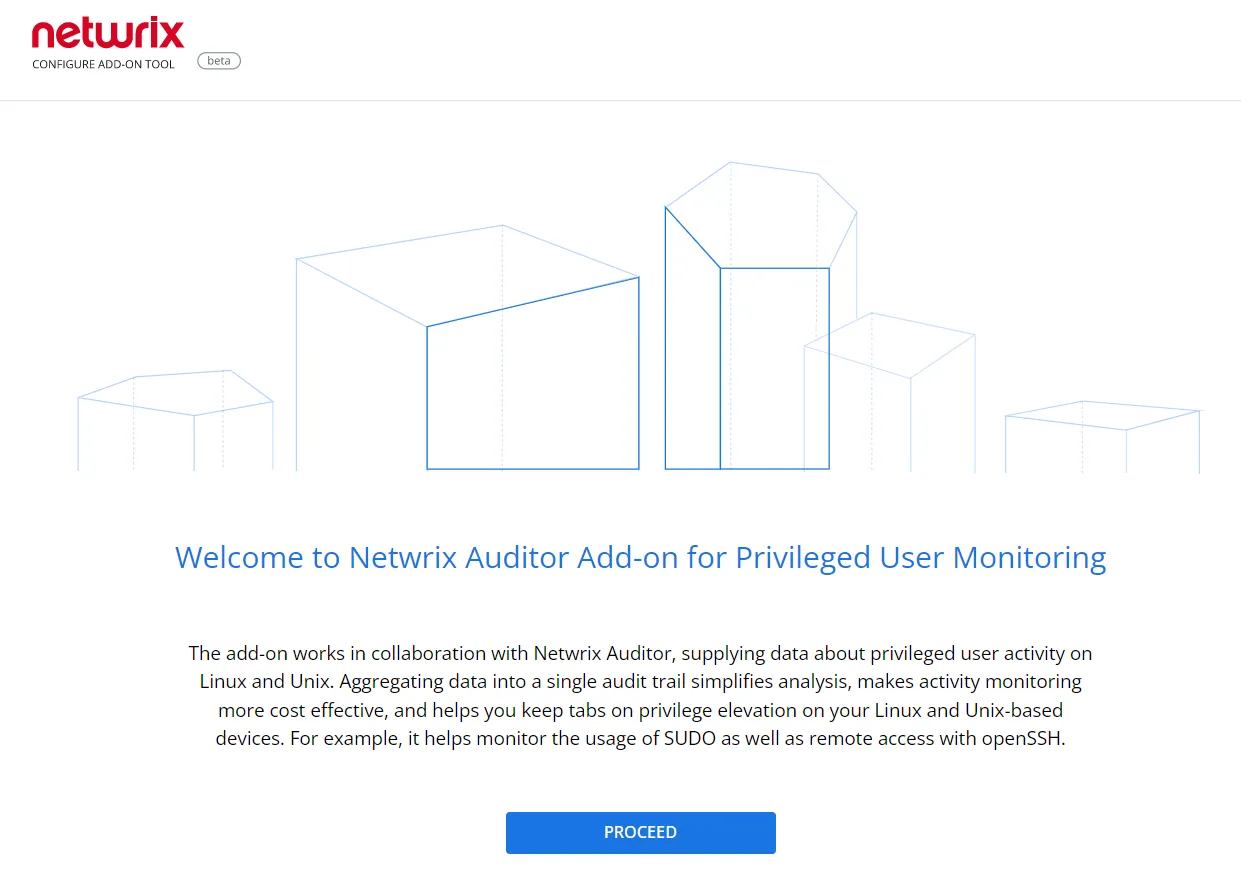
Click Proceed and complete the following fields:
| Option | Description |
|---|---|
| Specify General Settings | |
| Listed UDP port | Specify UDP port for listening incoming events. (514 by default). |
| Auditor Endpoint | Auditor Server IP address and port number followed by endpoint for posting Activity Records. Assumes that the add-on runs on the computer hostingAuditor Server and uses default port 9699. If you want to run the add-on on another machine, provide a name of the computer where Auditor Server resides (e.g., 172.28.6.15, EnterpriseNAServer, WKS.enterprise.local). To specify a non-default port, provide a server name followed by the port number (e.g., WKS.ent erprise.local:9999). Do not modify the endpoint part (/ netwrix/ api ) |
| Certificate Thumbprint | Netwrix Auditor Certificate Thumbprint Property. Possible values: - Empty—Check Auditor certificate via Windows Certificate Store. - AB:BB:CC—Check Auditor Server certificate thumbprint identifier. - NOCHECK—Do not check Auditor certificate. Make sure to select this parameter if you plan to specify servers by their IP. |
| Specify Active Directory credentials | |
| Username | Provide the name of the account under which the service runs. Unless specified, the service runs under the account currently logged on. |
| Password | Provide the password for the selected account. |
| Auditor Monitoring Plan settings | |
| Auditor Plan | Unless specified, data is written to Netwrix_Auditor_API database and is not associated with a specific monitoring plan. Specify a name of associated monitoring plan in Auditor. In this case, data will be written to a database linked to this plan. If you select a plan name in the add- on, make sure a dedicated plan is created in Auditor, the Netwrix API data source is added to the plan and enabled for monitoring. Otherwise, the add- on will not be able to write data to the Audit Database. |
| Auditor Plan Item | Unless specified, data is not associated with a specific plan and, thus, cannot be filtered by item name. Specify an item name. Make sure to create a dedicated item inAuditor in advance. |
| Accept List | |
| Address | Specify a list of IP addresses of syslog events sources. The service will collect and process events from these sources only. Events collected from any other source will be ignored. |
Click Run to start collecting data with the Add-On.
Monitored Events
The Add-On supports monitoring of the following syslog events from CyberArk PAS:
| Event ID | Description |
|---|---|
| 22 | Password verification by Central Policy Manager (success) |
| 24 | Password stored in EPV changed by Central Policy Manager (success) |
| 31 | Password reconciliation by Central Policy Manager (success) |
| 38 | Password verification by Central Policy Manager (failure) |
| 57 | Password stored in Enterprise Password Vault changed by Central Policy Manager (failure) |
| 60 | Password reconciliation by Central Policy Manager (failure) |
| 130 | Password stored in Enterprise Password Vault disabled by Central Policy Manager |
| 295 | User retrieved a password stored in Enterprise Password Vault |
| 300 | User session started in Privileged Session Manager |
| 302 | User session ended in Privileged Session Manager |
| 308 | User used a password stored in Enterprise Password Vault |
| 411 | A window was activated by user in Privileged Session Manager |
CyberArk Privileged Access Security
Netwrix Auditor is a visibility platform for user behavior analysis and risk mitigation that enables control over changes, configurations and access in hybrid IT environments to protect data regardless of its location. The platform provides security analytics to detect anomalies in user behavior and investigate threat patterns before a data breach occurs.
CyberArk offers its Privileged Access Security (PAS) solution for managing the privileged accounts and SSH Keys. It enables organizations to manage and monitor all activities associated with the privileged identities, for example, Windows server administrator, root on a UNIX server, etc. A featured set of the Privileged Access Security tools includes, in particular:
- Privileged Session Manager - a tool that enables users to securely connect to remote targets with a standard remote desktop client application, providing isolated sessions.
- Enterprise Password Vault – a tool for storage and centralized management of the privileged accounts; it supports automated changes and logging of the activities associated with all types of privileged passwords and SSH Keys. This tool also includes Central Policy Manager service.
Major benefit of the integrated solution implemented with the Add-On is the increased visibility into actions related to CyberArk tools, in particular:
- Visibility into the user account behind the respective isolated session controlled by Privileged Session Manager
- Visibility into the password-related activities, e.g. password retrieval and further actions made to target application or system, and automatic password update for managed accounts in Enterprise Password Vault and Central Policy Manager.
How It Works
The add-on is implemented as a syslog service that collects activity data from CyberArk system (PAS) and sends it to Auditor using the Integration API.
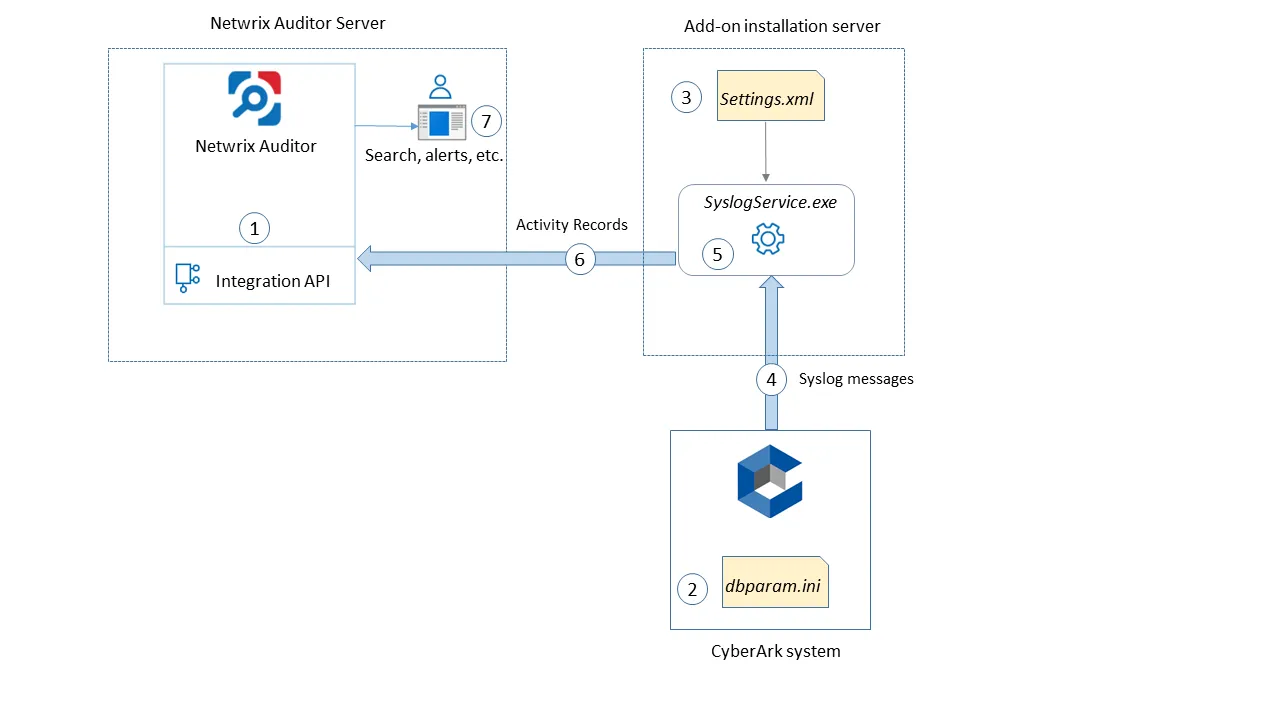
The add-on operates as a syslog listener for the CyberArk system. On a high level, the solution works as follows:
-
An IT administrator configures Integration API settings to enable data collection and storage to the Audit Databasefor further reporting, search, etc.
It is recommended to create a dedicated monitoring plan in Auditor and add a dedicated item of Integration type to it — then you will be able to filter data in reports and search results by monitoring plan/item name.
-
On the CyberArk server, the administrator opens the dbparam.ini file and specifies the parameters for syslog message forwarding, including add-on installation server settings, the IDs of events to be monitored, etc.
See the Monitored Events topic for additional information on the events supported for monitoring out of the box.
-
On the add-on installation server, the administrator runs the installation file and configures the Add-On parameters in the configuration wizard.
-
The add-on starts collecting and forwarding activity data: it listens to the specified UDP port and captures designated syslog messages (CyberArk events).
-
The add-on processes these events into Auditor-compatible format – activity records. Each activity record contains the Who-What-When-Where-Action information (that is, user account, time, action, and other details).
-
Using the Integration API, the add-on sends the activity records to Auditor Server that writes them to the Audit Database and Long-Term Archive. Data is sent periodically, by default every 5 seconds.
See the Integration API topic for additional information on the structure of the activity record and the capabilities of the Integration API.
- Users open Auditor Client to work with collected data:
- Search for file changes using certain criteria
- Export data to PDF or CSV files
- Save search results as reports
- Subscribe to search results
- Configure and receive alerts
Prerequisites
Before running the add-on, ensure that all the necessary components and policies are configured as follows:
| Where | Prerequisite to check |
|---|---|
| The Auditor Server side | - The Integration API and Audit Database settings are configured in Auditor Server settings. See the Prerequisites and Audit Database topics for additional information. - The TCP 9699 port must be open on Windows firewall for inbound connections. - User account under which data will be written to the Audit Database requires the Contributor role in Auditor. See the Role-Based Access and Delegation for additional information. Alternatively, you can grant it the Global administrator role, or add that account to the Netwrix Auditor Administrators group. |
| The machine where the Add-On will be installed (Auditor Server is recommended) | - The UDP 514 port must be open on Windows firewall for inbound connections. If you are using Netwrix Auditor for Network Devices, this port may be already in use, and you should provide another one. Another option is to install the add-on and Auditor Server on different machines. - .Net Framework 4.7.2 and above is installed. Review the following Microsoft technical article for additional information on how to install .Net Framework 4.7.2: Microsoft .NET Framework 4.7.2 offline installer for Windows. |
| CyperArk PAS | Version 10.10. |
Accounts and Rights
By default, the add-on will run under the Local System account. So, if the add-on and Auditor will be running on different machines, the corresponding computer account will require at least the Contributor role in Auditor. See the Role-Based Access and Delegation topic for additional information.
In case the add-on and Auditor are installed on the same server, no special settings are needed.
Considerations and Limitations
- The Add-On must be deployed in the same subnet as CyberArk PAS and Auditor.
- If the monitoring plan name in the
<NetwrixAuditorPlan>add-on configuration parameter is specified incorrectly, this may lead to temp files generation and, therefore, to inefficient disk space usage. - If you are using Netwrix Auditor for Network Devices, the 514 UDP port may be already in use, and you should specify another port when configuring the add-on settings (see Deploy the Add-On and Add-On Parameters topics for additional information). Another option is to install the add-on and Auditor Server on different machines.
Compatibility Notice
Netwrix Auditor add-on for CyberArk is compatible with CyberArk Privileged Access Security (PAS) 10.10 and with Netwrix Auditor 9.8 and later.
Add-On Parameters
To configure the add-on parameters, you need to edit the Settings.xml file in the add-on folder. You must define connection details: Auditor Server host, endpoint, etc.
Most parameters are optional; you can skip or define parameters depending on your execution scenario and security policies.
The service uses the default values unless parameters are explicitly defined
(<parameter>\*\*\_value_\*\*</parameter>).
Parameters in Settings.xml can be grouped as follows:
- General parameters that affect add- on execution. They are listed in the table below.
- Settings for a certain event source (within the Source section) that can override general settings.
- Internal parameters that should not be modified in most cases. They are listed in the topic.
| Parameter | Default value | Description |
|---|---|---|
| General parameters | ||
| ListenUdpPort | 514 | Specify UDP port for listening to the incoming syslog events. |
| NetwrixAuditorEndpoint | https://localhost: 9699/netwrix/api/ v1/activity_records | Auditor Server IP address and port number followed by endpoint for posting Activity Records. Assumes that the add-on runs on the computer hosting Auditor Server and uses default port 9699. If you want to run the add-on on another machine, provide a name of the computer where Auditor Server resides (e.g., 172.28.6.15, EnterpriseNAServer, WKS.enterprise.local). To specify a non-default port, provide a server name followed by the port number (e.g., WKS.enterprise.local:9999). Do not modify the endpoint part (/netwrix/api . . . . ) |
| NetwrixAuditor CertificateThumbprint | NOCHECK | Netwrix Auditor Certificate Thumbprint Property. Possible values: - Empty—Check the certificate via Windows Certificate Store. - AB:BB:CC.—Check the certificate thumbprint identifier. - NOCHECK—Do not check the certificate. Make sure to select this parameter if you plan to specify servers by their IP. |
| NetwrixAuditorPlan | — | Unless specified, data is written to Netwrix_Auditor_API database and is not associated with a specific monitoring plan. Specify a name of associated monitoring plan in Auditor. In this case, data will be written to a database linked to this plan. If you select a plan name in the add-on, make sure a dedicated plan is created in Auditor, the Netwrix API data source is added to the plan and enabled for monitoring. Otherwise, the add-on will not be able to write data to the Audit Database. |
| NetwrixAuditorPlanItem | — | Unless specified, data is not associated with a specific monitoring plan and thus cannot be filtered by item name. Specify an item name here. Make sure to create a dedicated item in Auditor in advance. |
| EventStorePath | — | Select where to store temporary files of syslog messages before the add-on sends them to Auditor Server. Netwrix recommends to store these files in the same directory with the add-on (SyslogService.exe). |
| LogLevel | warning | Specify logging level: - none - info - warning (used by default) - error - debug |
| WriteCriticalIssues ToEventLog | 0 | Instructs the add-on to write important events (like service start or critical issue) not only to its own log but also to Netwrix event log. - 1=yes - 0=no (default) |
| Parameters within SourceList You can specify parsing rules for each specific event source and define parameters to override general settings, such as time zone, default plan name, etc. | ||
| NetwrixAuditorPlan | — | When specified, overrides the general settings. |
| NetwrixAuditorPlanItem | — | When specified, overrides the general settings. |
| AppNameRegExp | — | Custom regular expression pattern that will be used to retrieve the application name from your syslog messages. The add-on will match the application name and the files with syslog parsing rules to be applied. The pattern you provide here must match the application name in your custom rule file. Unless specified, RFC 3164/5424 format is used. |
| AppNameGroupID | — | Define application name value by Group ID only if messages are not formatted in accordance with RFC 3164/5424. Otherwise, leave the default value. |
| RuleFileList PathFile | cyberark-v2.xml | Specify paths to XML file(s) with regular expression parsing rules. You can create a custom file or use rules provided out of the box. Currently, the cyberark-v2.xml rule file is shipped with this add-on. You can specify several rule files. The service will check if the AppName parameter in the first rule file matches the AppNameRegExp and AppNameGroupID regular expression in this file. If not, the service will proceed to the next rule file. |
| AcceptList Address | — | Specify a list of IP addresses of syslog events sources. The service will collect and process events from these sources only. Events collected from any other source will be ignored. The Address parameter may be followed by optional attributes that override parameters specified above: - naplan—A name of associated monitoring plan - naplanitem—A name of associated item For example: <Address naplan="NFSmonitoring" naplanitem="NFS">172.28.3.15 </Address> |
Remember to save Settings.xml after editing is complete.
After you modify parameters in the Settings.xml file, remember to save the changes and then restart the add-on main service (SyslogService.exe) for them to take effect.
Add-on Internal Parameters
Internal parameters listed in the table below are intended for performance tuning. In most cases the default values should be used.
| Parameter | Default value | Description |
|---|---|---|
| EventsFromMemoryFirst | 1 | Instructs the add-on to save events to temporary storage only if there is no free space in queues: - 1=yes - 0=no |
| ConcurrentSend | -1 | Specifies the number of threads for concurrent forwarding of events to Auditor. Default value is -1 (switch off concurrent forwarding). |
| SenderSleepTime | 30 | Specifies the retry interval in seconds to send messages to Auditor (30 - 3600 seconds). |
| TaskLimit | 8 | Specifies the number of threads and queues for concurrent handling of events. |
| QueueSizeLimit | 100 | Specifies the maximum number of events to keep in queue before saving to temporary storage or sending to Netwrix API. |
| QueueTimeLimit | 5 | Specifies the length of timeout before events from queue (not full) are saved to temporary storage or sent to Netwrix API: - From 5 to 300 – timeout in seconds. - -1 – disable timeout. |
Maintenance and Troubleshooting
The Add-On operations are logged into the SyslogService.txt file. This file is located in the same folder as SyslogService.exe.
To change the add-on logging level, use the LogLevel parameter in the Settings.xml file.
- It is recommended that before the first run you set this parameter to
debug. This will facilitate operations tracking and possible problem solving. - After that it is strongly recommended to re-set this parameter to
errorto prevent the uncontrolled log growth.
If you cannot see collected data in Auditor, check the following:
- In Auditor settings, go to the Integrations section and make sure the Leverage Integration API is switched to ON. Check the communication port number – default is 9699.
- If you configured a dedicated monitoring plan, make sure data source monitoring is enabled.
- Verify the parameters you provided in Settings.xml and dbparam.ini.