Monitoring Overview
The Monitoring overview widget provides aggregated statistics on the monitoring plans. It displays current statuses of all monitoring plans:
- Ready (green indicator)—The monitoring plans (one or several) successfully processed the data sources with all their items and are ready for the next run.
- Pay attention (yellow indicator)—The monitoring plans (one or several) require your attention, as some items weren't processed completely but only partially. This status applies to the monitoring plans targeted at Logon Activity and Windows File Server. See the following table for details.
- Take action (red indicator)—Any data source or item in the monitoring plan (one or several) was processed with errors.
After you click View details, Auditor displays the Monitoring Overview window.
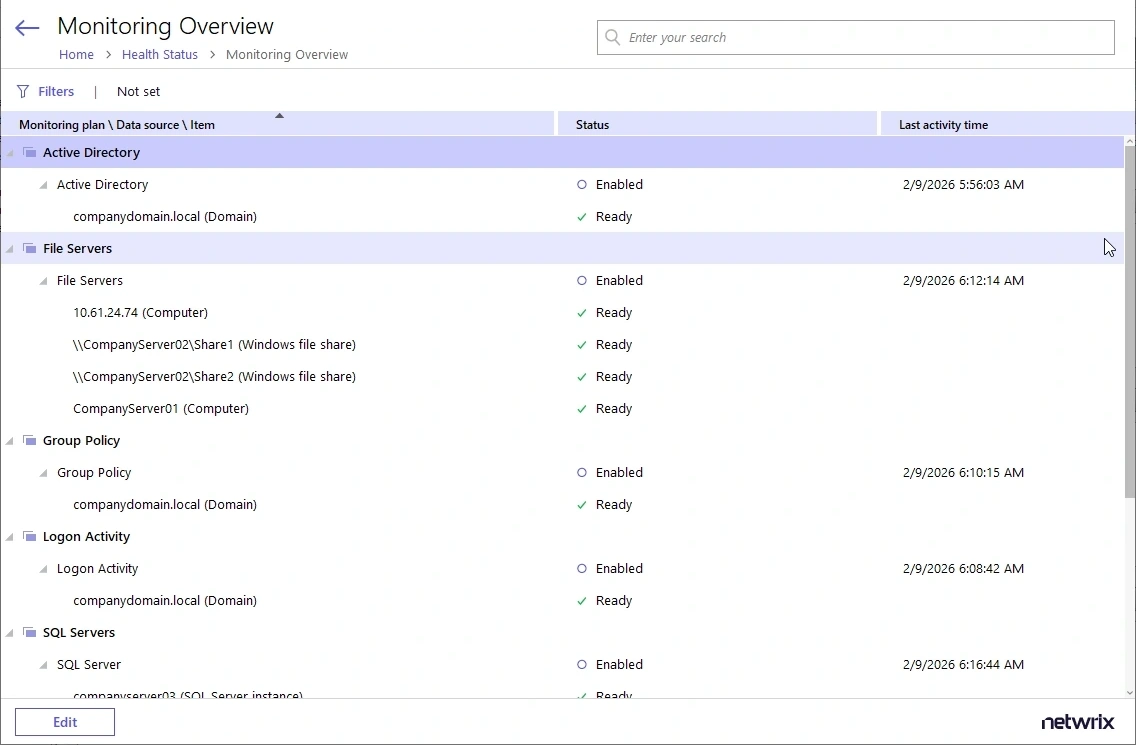
It provides the hierarchical list of monitoring plans, processed data sources and corresponding items with their current status and date/time of the last data processing session. For data sources and items their current status is depicted as follows:
| Entity | Status | Description |
|---|---|---|
| Data source | Disabled | A data source can be disabled manually via its settings (by switching Monitor this data source and collect activity data to OFF), or automatically, if the license isn't valid any more (for example, the count of licensed objects was exceeded, or the trial period has expired). |
| Empty | No items have been added to this data source yet. | |
| Enabled | Monitor this data source and collect activity data is set to ON in the data source settings. | |
| Not available | The monitoring plan is corrupted and can't process its data sources, so Netwrix recommends removing it and creating a new one. | |
| Not responding | Data collector for this data source isn't responding. Auditor doesn't display the underlying items for this data source. | |
| Working | The data source is being processed at the moment. | |
| (not displayed) | The data source status is unknown. | |
| Item | Pay attention | The item was processed with some issues (non-critical). This status applies to the monitoring plans targeted at Logon Activity and Windows File Server. It means that data collection from at least one entity completed with errors. For example, a MyFileServer item included in the File Server monitoring plan contains all CIFS shares hosted on the MyFileServer computer. If any of these shares was processed with errors while others were processed successfully, Auditor considers the processing of the whole MyFileServer item partially completed and gives the monitoring plan a yellow indicator, requiring your attention. Click the Details link to examine the product log. |
| Ready | The item was processed successfully and is ready for the next run of data collection. | |
| Take action | Critical errors occurred while processing this item. Click the Details link to examine the product log. | |
| Working | The item is being processed at the moment. |
You can use the Search field, or apply a filter to display the information you need. For example, in the Apply Filters dialog you can select the Show only plans with issues to display only the monitoring plans that require attention and corrective actions.
This information helps you troubleshoot product operation; detect and eliminate the root cause of monitoring errors; and maintain auditing continuity and compliance.