Monitored Computers
The Monitored Computers tab in a Windows Server monitoring plan gives you a detailed, per-host view of every computer being monitored. Instead of a single summary status for the entire plan, you can see the health of each individual computer, identify issues quickly, and drill into diagnostic details without leaving the interface.
To access the Monitored Computers tab:
Step 1 – In the main Netwrix Auditor menu, select Monitoring Plans.
Step 2 – Select your Windows Server monitoring plan and click Edit.
Step 3 – Click Edit Data Source in the right pane, then select Monitored Computers.
Overview
When you add computers to a monitoring plan using an IP range or an AD container, Netwrix Auditor resolves and tracks each host individually. The Monitored Computers tab lists all resolved computers with their current health status, so you can immediately see which hosts are collecting data normally and which ones require your attention.
NOTE: Computers excluded from monitoring via the Exclude these objects setting in the item settings are not displayed in the Monitored Computers tab.
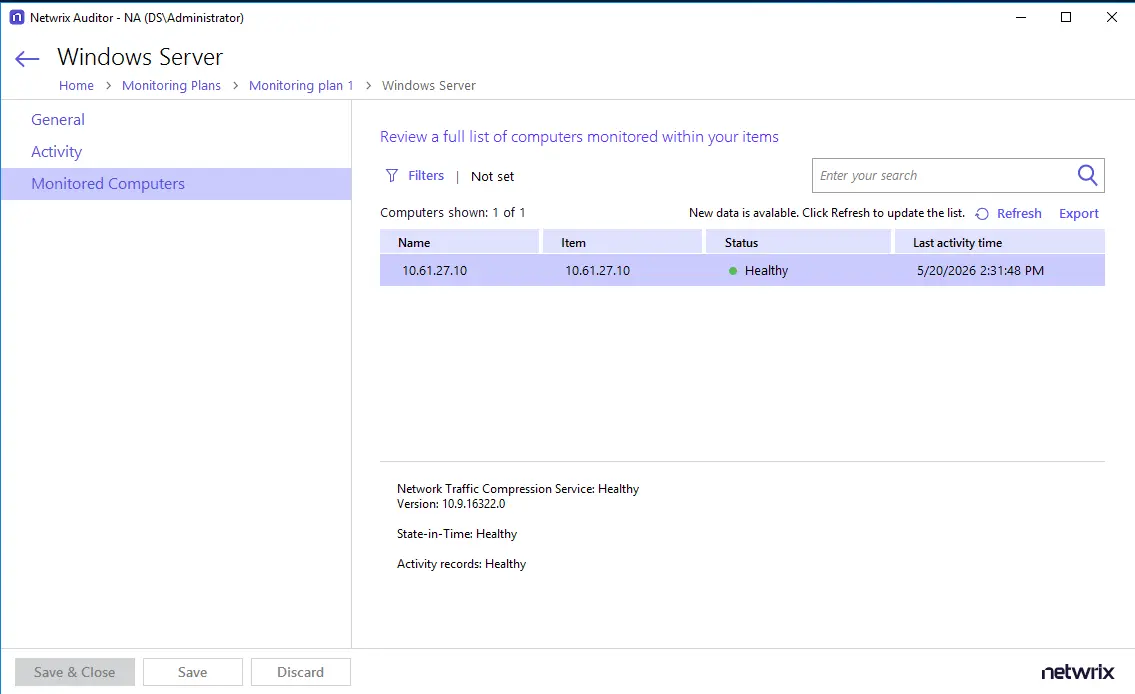
Monitored Computers Grid
The grid displays the following columns for each computer:
| Column | Description |
|---|---|
| Name | The hostname or IP address of the monitored computer. |
| Item | The source that included this computer in the plan — for example, an IP address, an IP range, or an AD container (OU). |
| Status | A consolidated health indicator for the computer. See Status Values below. |
| Last Activity Time | The timestamp of the most recent data collection event for this computer. |
Status Values
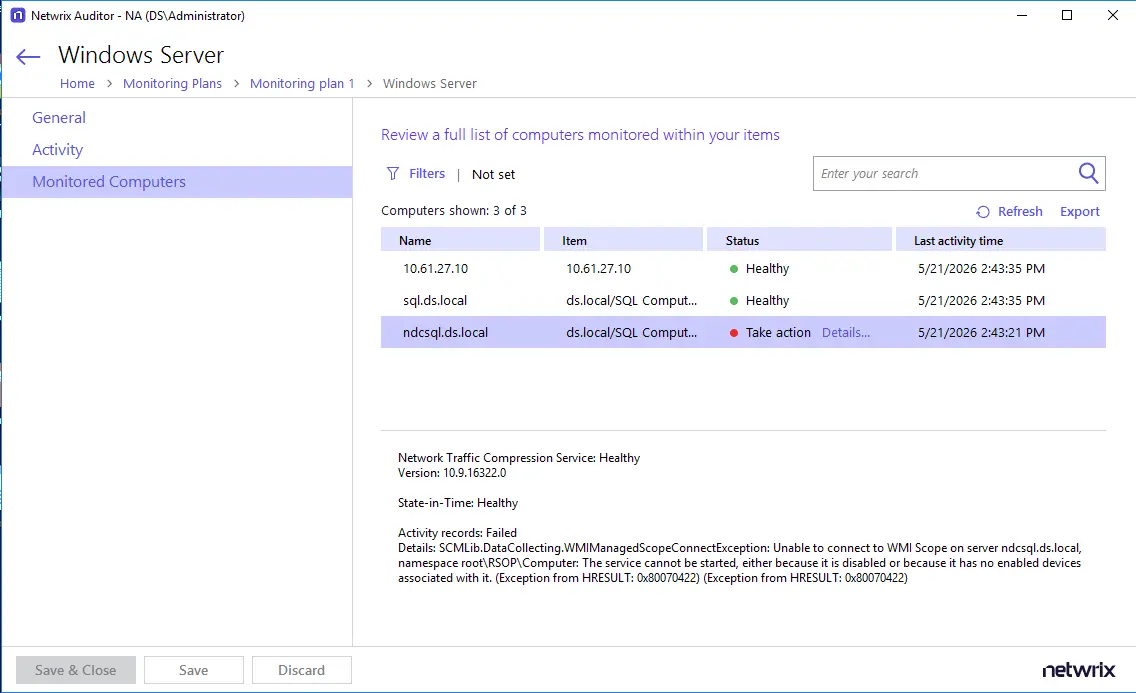
Each computer displays one of two statuses:
- Healthy — All monitored components (Activity Records, State-in-Time, Network Traffic Compression Service) are operating normally.
- Take action — One or more components have reported an error. Click Details… next to the status to open a dialog with a link to the Health Log, where you can view the corresponding event and investigate the issue further.
Details Panel
When you select a computer in the grid, the Details panel at the bottom of the screen shows the health breakdown for each individual component:
- State-in-Time — Status and error message if collection has failed. This entry is only shown if State-in-Time is enabled on the General tab.
- Activity records — Status and error message if collection has failed.
- Network Traffic Compression — Status and version number. This entry is only shown if Enable network traffic compression is enabled on the General tab.
Filtering and Search
Search field — Type in the search box at the top right to filter computers by name or item. Search is case-insensitive and supports partial matches (for example, typing srv will match srv-db01). Results update when you apply the filter.
Filters — Click Filters to open the Apply Filters dialog, where you can filter by:
- Status — Show only computers with a Healthy status, only those requiring Take action, or both.
- Name — Enter a partial or full computer name.
- Items — Select one or more items (IP ranges, OUs, or individual computers) from the dropdown list.
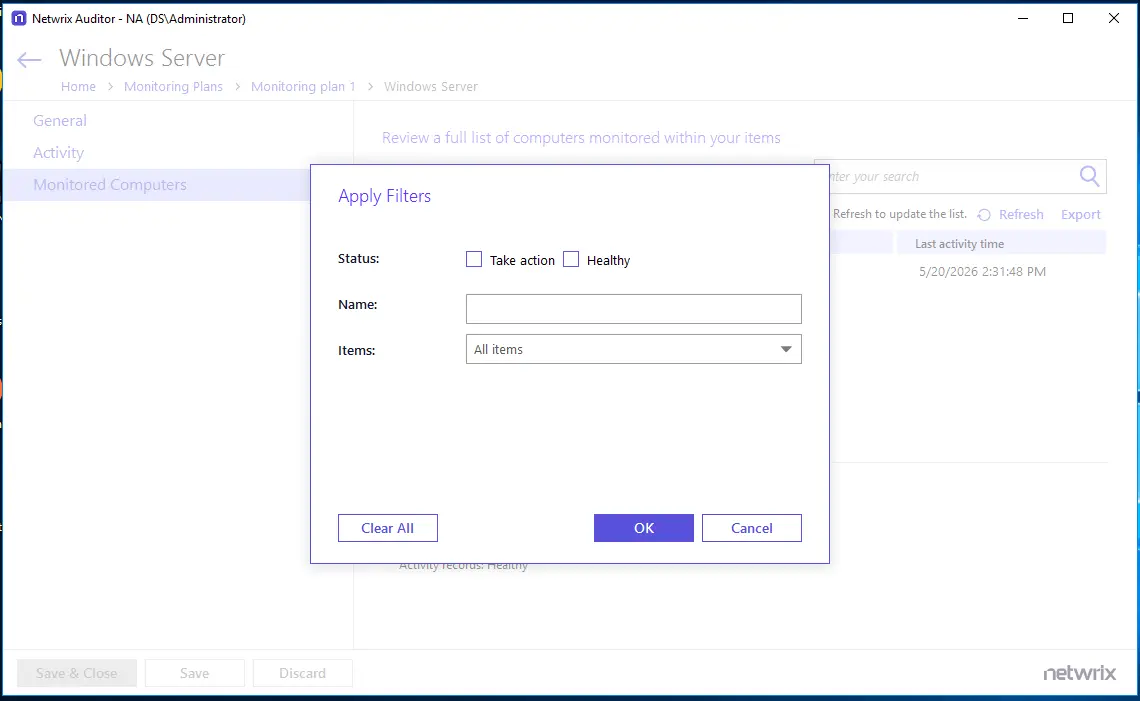
Search and filters can be combined. To remove all active filters at once, click Clear All in the Filters dialog.
Refreshing the List
The grid does not update automatically. When new data becomes available, a notification bar appears above the grid:
New data is available. Click Refresh to update the list.
Click Refresh in the toolbar to reload the grid with the latest data. You can also press F5 to refresh the page.