Splunk
Splunk stores logs from devices, databases, and applications. Capturing changes to device configuration, from logs in Splunk, provides a form of agentless monitoring that can monitor devices Change Tracker doesn't support. This means Change Tracker can monitor anything that can reliably log its configuration changes to Splunk, including custom applications.
A fully customizable Search Processing Language (SPL) query, executed via the Splunk API, returns specific logs that Change Tracker converts to change events. From this point on, these change events behave as if a traditional agent produced them.
You can find the permissions required for Splunk in the Authentication and Authorization section of the Splunk Documentation page. See Splunk's REST API User Manual article for additional information on permissions.
Configure Credentials
Step 1 – From the Settings menu select Credentials and scroll to the Splunk Credentials section.

Step 2 – Click the Add button and enter the details of the Splunk instance to connect to.
Step 3 – Click Update.
Change Tracker updates the Splunk credentials.
Policy Templates
Use policy templates to configure what to monitor on the target devices. Splunk requires a policy template that defines an SPL query. Splunk's SPL query language is similar to Structured Query Language (SQL): it's flexible in defining the data to query, how to filter it, and what transformations to apply, such as column aliases.
Create an SPL Query
Develop and test the SPL query in Splunk's Search page.
The query must return fields with the following aliases:
- device
- whomadethechange
- eventdate
- eventinfo
Format the value in the eventdate field as YYYY-mm-ddTHH:MM:SS. Use the strftime function to format date-time fields accordingly: strftime(MyDateTimeField,"%Y-%m-%dT%H:%M:%S.%Q").
Any further fields added appear in the body of the events when they reach Change Tracker. Sourcetype is an example of such a field in the following test query.
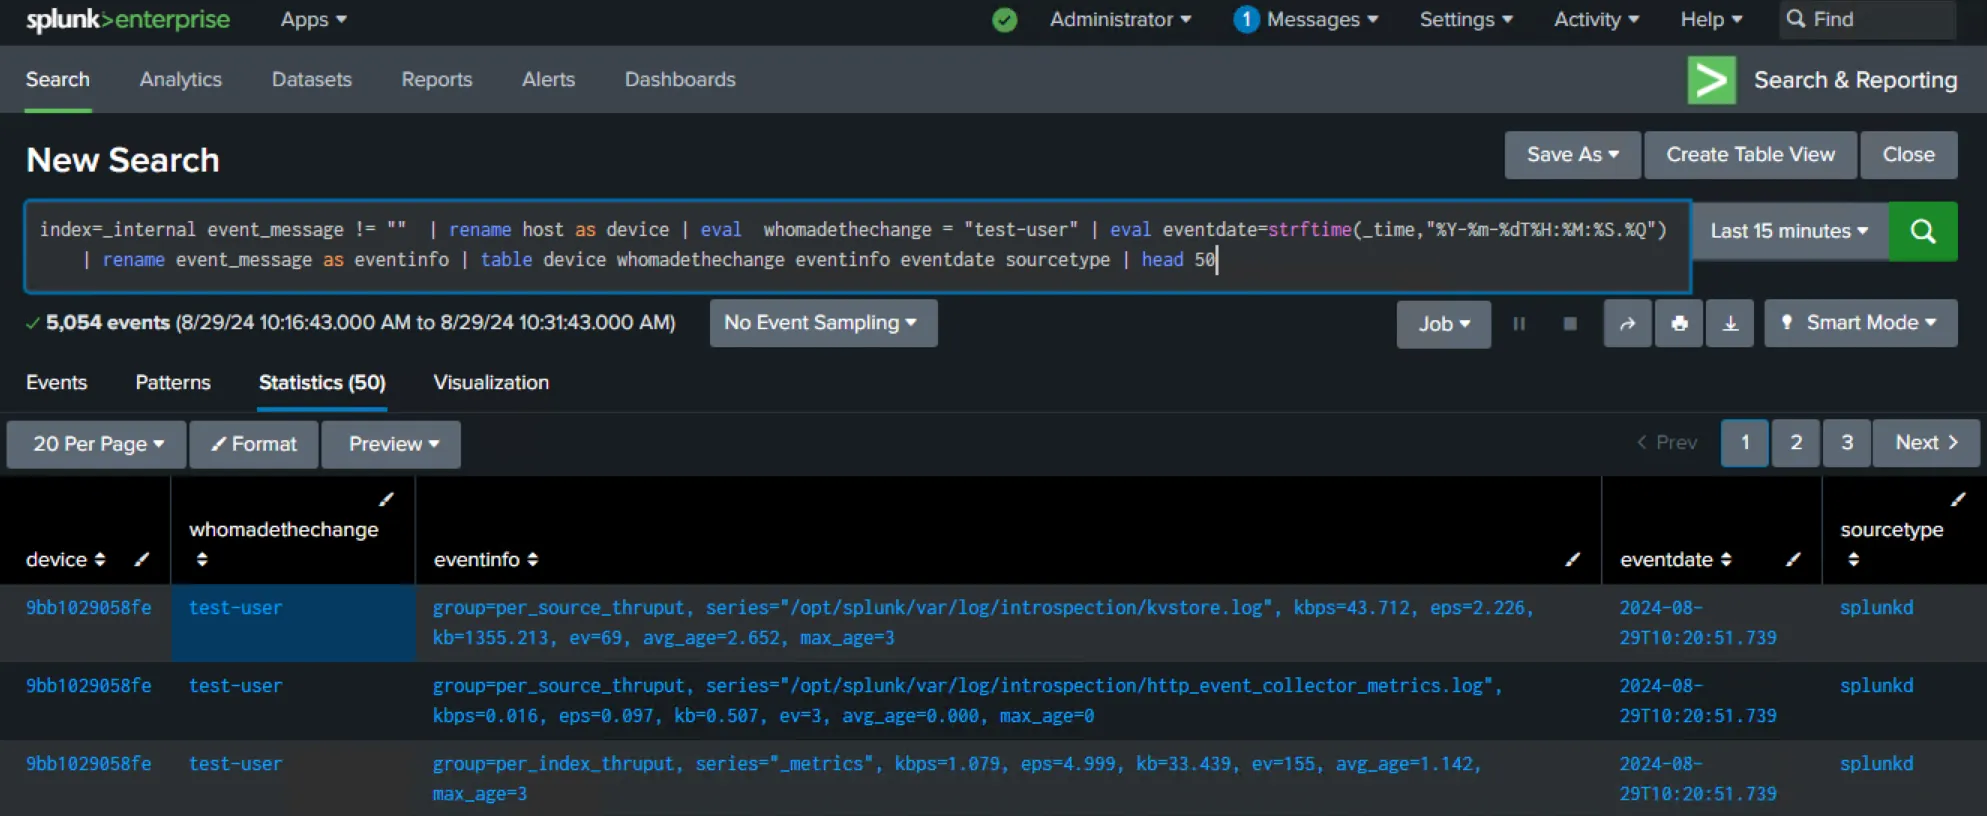
This document uses the following test query. This query pulls internal Splunk data that any instance will have while meeting Change Tracker's requirements. The "head 50" clause at the end of the statement ensures that the query returns only 50 rows.
search index=_internal event_message != "" | rename host as device | eval whomadethechange = "test-user" | eval eventdate=strftime(_time,"%Y-%m-%dT%H:%M:%S.%Q") | rename event_message as eventinfo | table device whomadethechange eventinfo eventdate sourcetype | head 50
Create the Policy Template
Step 1 – From the Settings menu, select Policy Templates.
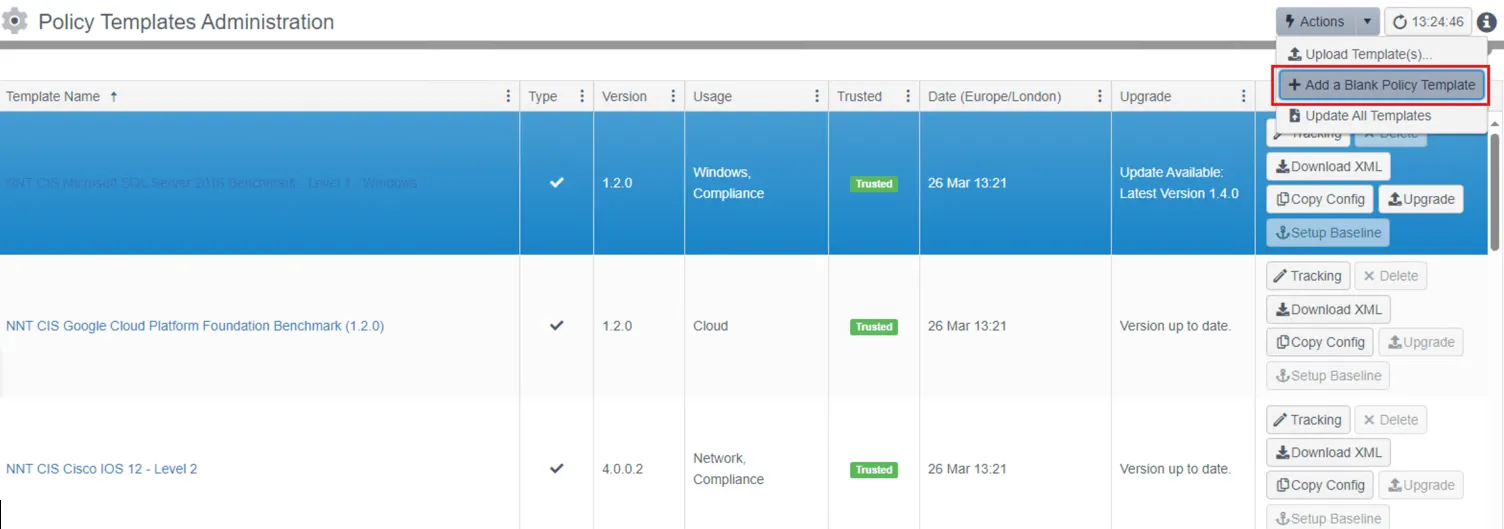
Step 2 – Click Actions and Add a Blank Policy Template.
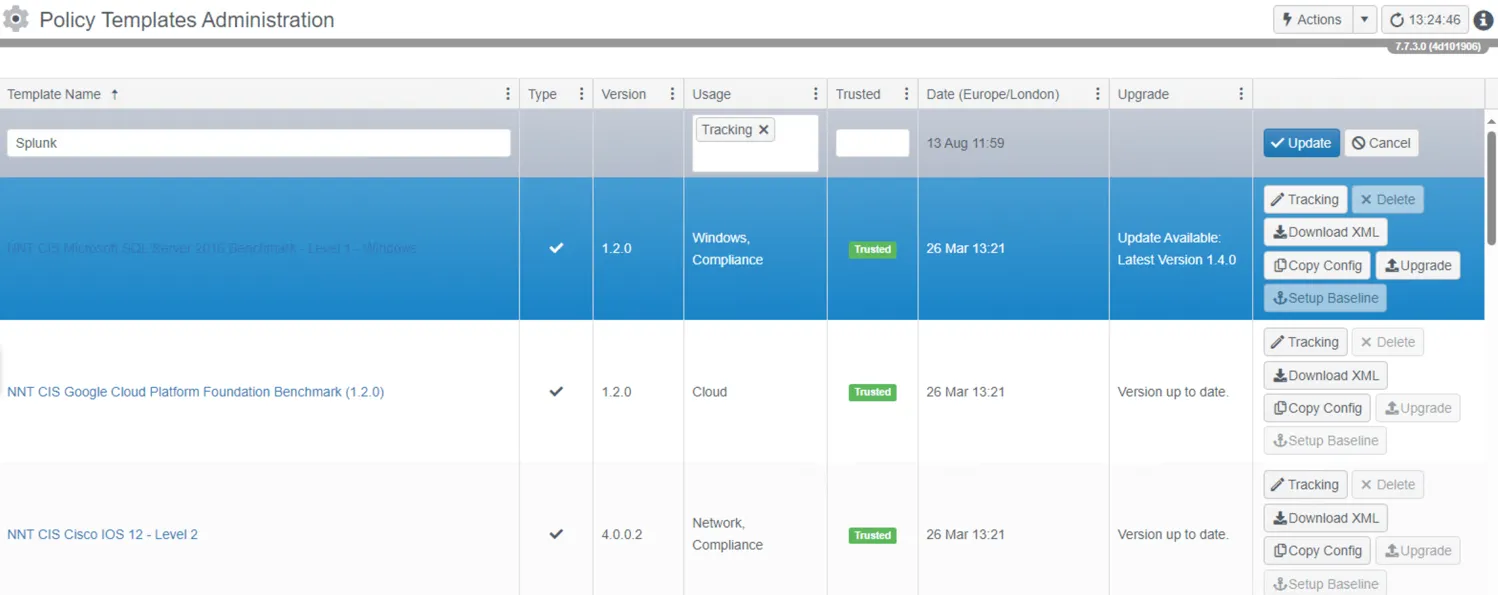
Step 3 – Name it Splunk, set the Usage column to Tracking, and click update.
Step 4 – Click the tracking button on the new Splunk policy and then scroll right to the Splunk Search Queries tab.
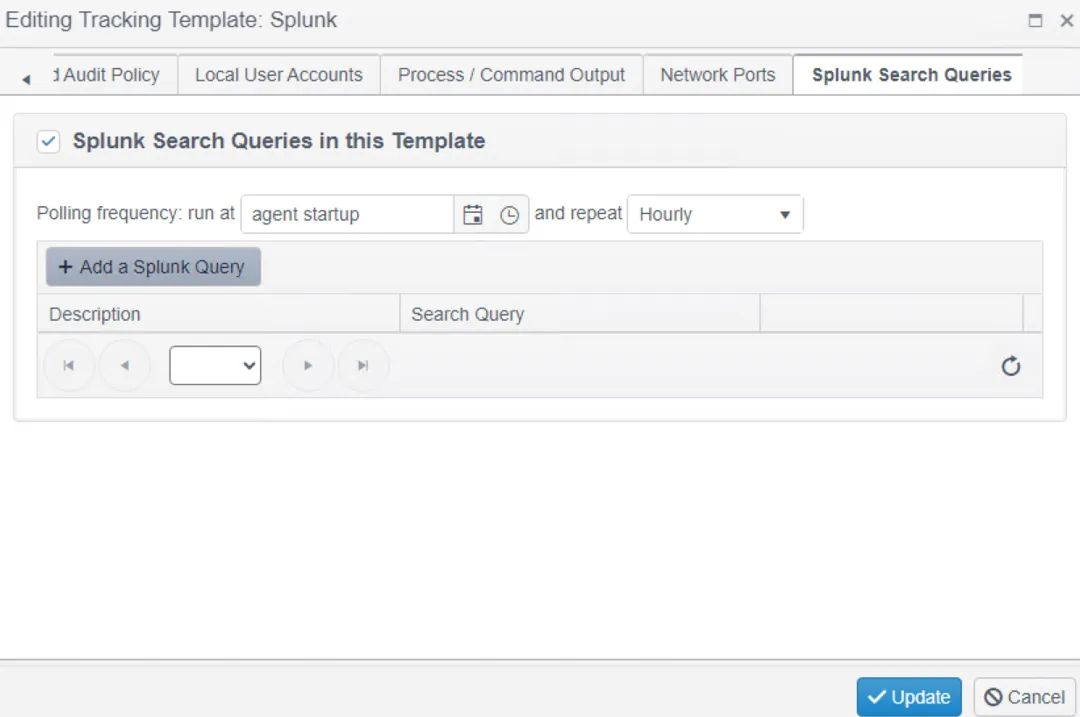
Step 5 – Click the tick box to add a query and then click Add a Splunk Query.
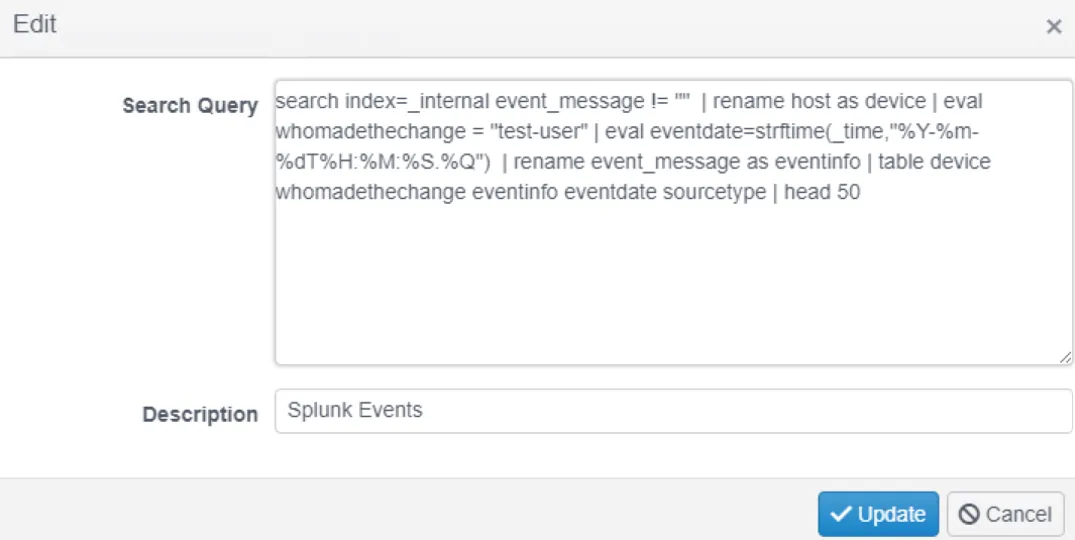
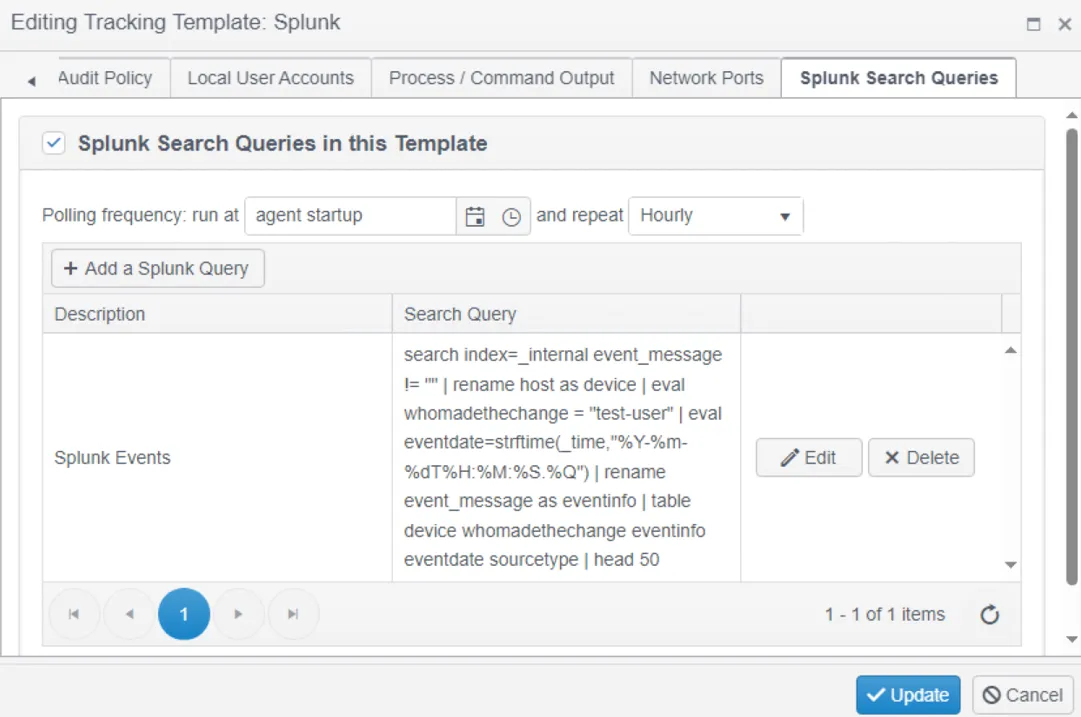
Paste the query, give it a description, and click Update. The query now appears in the policy.
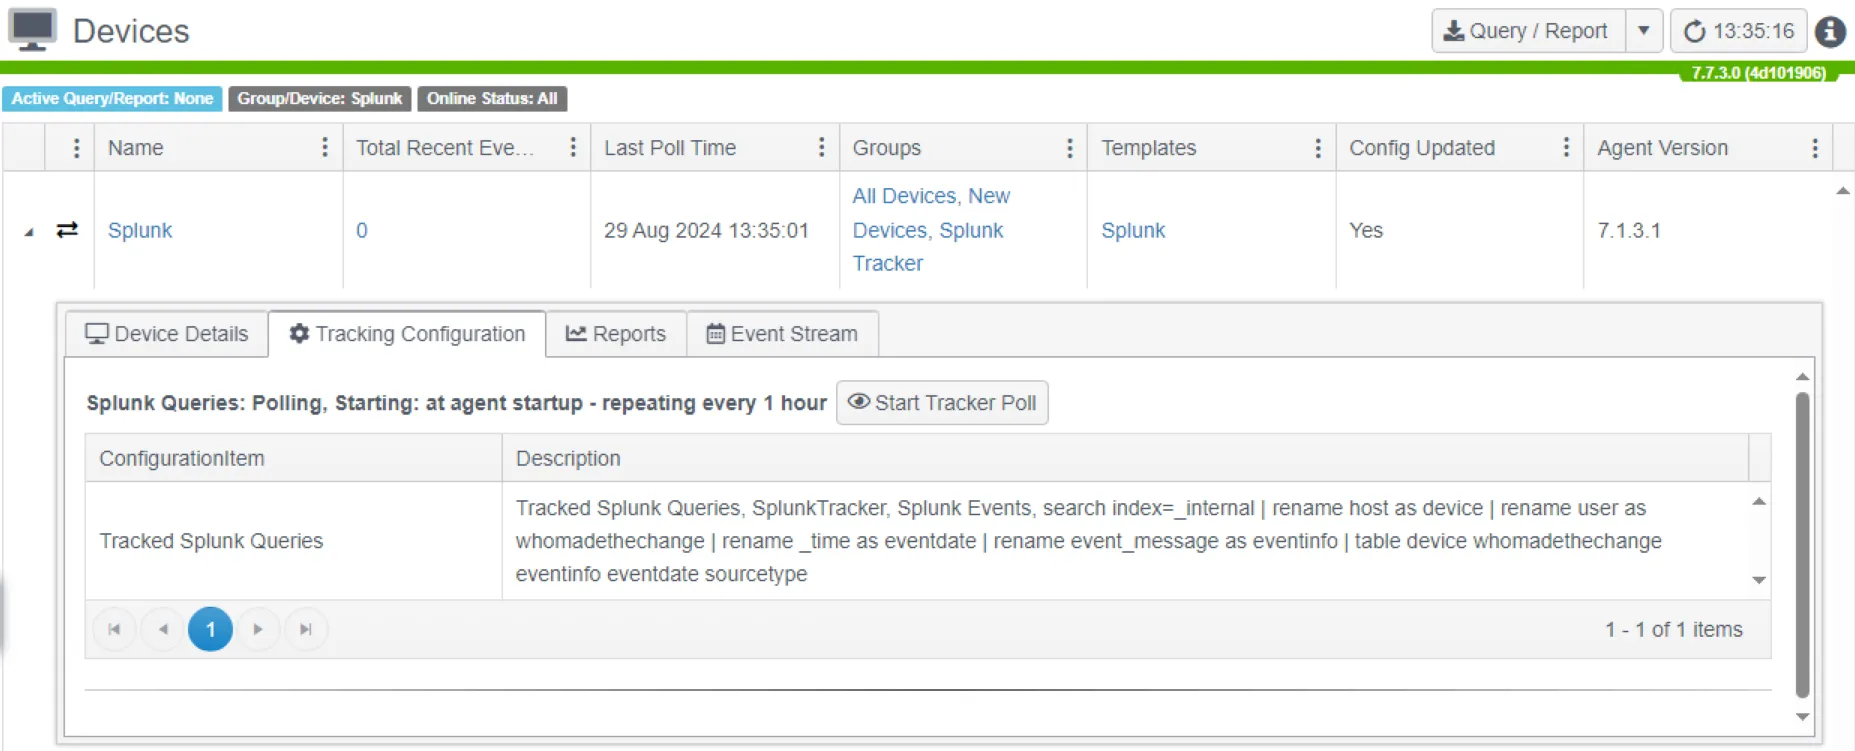
Set the polling frequency you want.
Devices and Groups
Step 1 – From the Settings menu, select Groups and click Add to add a new group called Splunk Tracker.
Step 2 – Select Splunk Tracker in the group tree; then click the Policy Templates tab and click Add an Existing Template.
Step 3 – Add the Splunk policy template to the Splunk Tracker group.
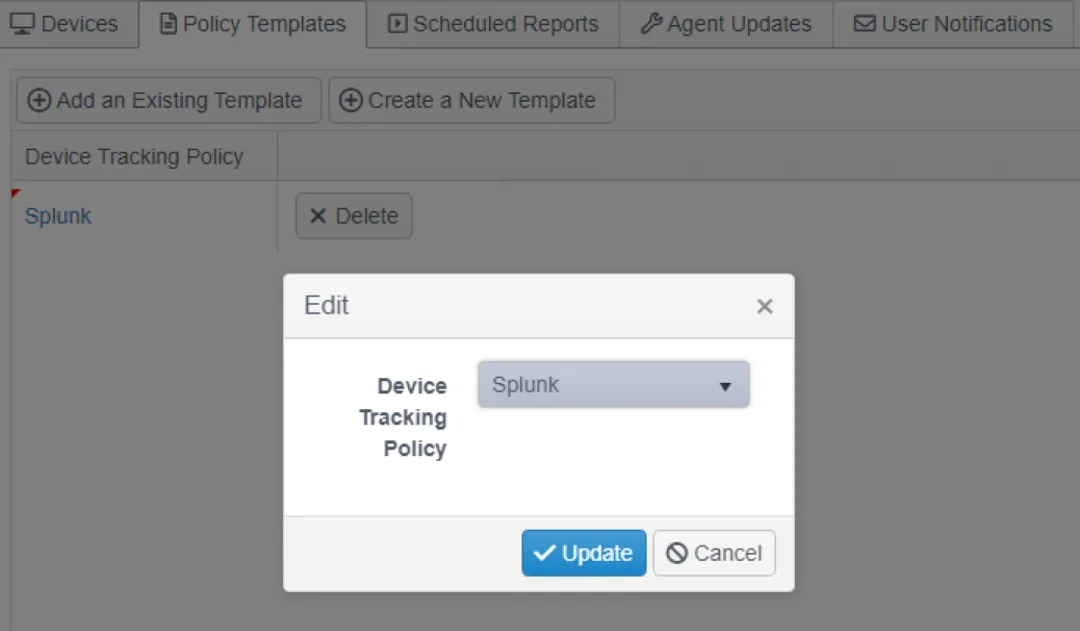
Any device of the type Splunk in this group will execute the Splunk tracking policy created earlier.
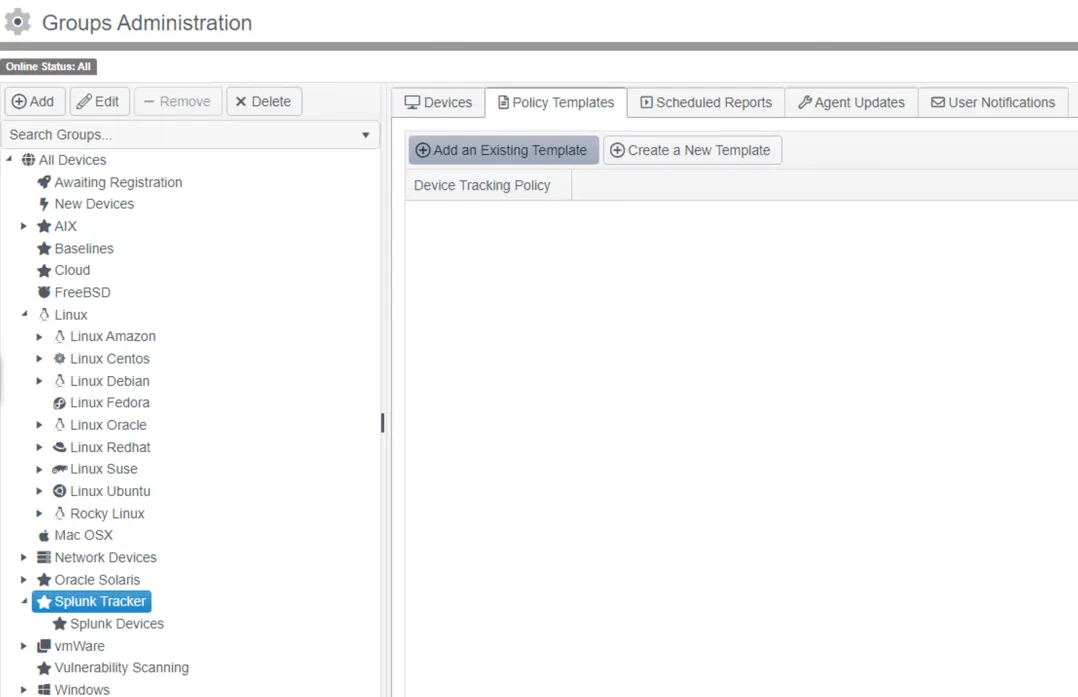
Step 4 – Select the Splunk Tracker group and click Add to add a sub group to the Splunk Tracker group named Splunk devices. This group holds the proxied devices that Change Tracker matches Splunk events to.
Devices
To direct the SPL query in the Splunk tracking policy to the target instance of Splunk, you must create a proxied device with the connection details.

Step 1 – Select a device to be a proxy device and click Add Proxied Device. The agent on the same machine as the Hub is often a good choice for the proxy if it can communicate with the Splunk instance.
Step 2 – Name the proxy device Splunk.
Step 3 – Enter the URL for the Splunk instance in the Host field.
Step 4 – Set the device type to Splunk.
Step 5 – Select the Splunk credentials.
Step 6 – Add the Splunk Tracker group to the Groups field.
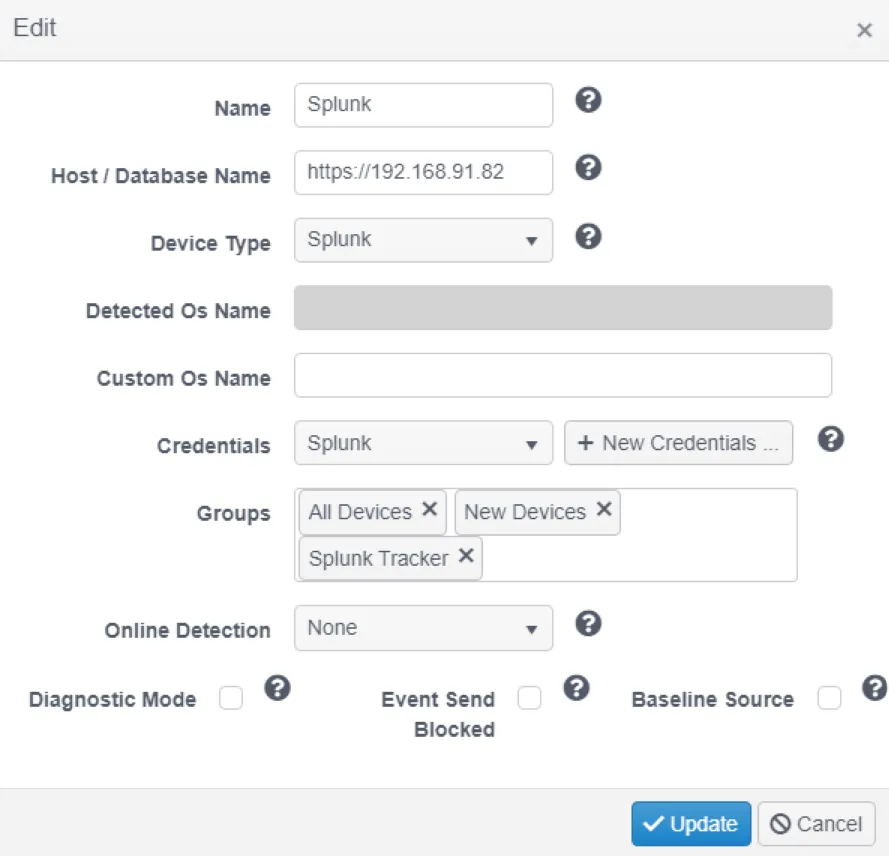
Change events coming into Change Tracker (from Splunk or any agentless monitoring) must match a device in Change Tracker. Change Tracker ignores events without a matching device.
This isn't a problem with agent based monitoring as the agent registers it's device on first contact with the Hub. All types of agentless monitoring require you to create devices in Change Tracker.
You can create devices manually or via device discovery. Device discovery is only available when you configure the Sync Service to integrate with ServiceNow. Both will result in proxied devices registered to a proxy device with an agent.
To discover devices to match change events from Splunk, see the Configure Device Discovery section in Sync Service Administration topic for additional information.
To manually create proxied devices, select a device to be a proxy device (the Hub's agent is often a good choice here) and click Add Proxied Device. Add the new devices to the Splunk Devices group.
If the logs collected are from a custom application, you may want to treat the application as a device in Change Tracker instead of its individual servers. This way change events would belong to the application and not to individual servers. To do this, manually create a proxied device named after the application, then ensure the SPL query uses the same application name for its Device column.
Events
If you've configured everything correctly and communication with the Splunk instance is possible, Splunk logs should start arriving as events.
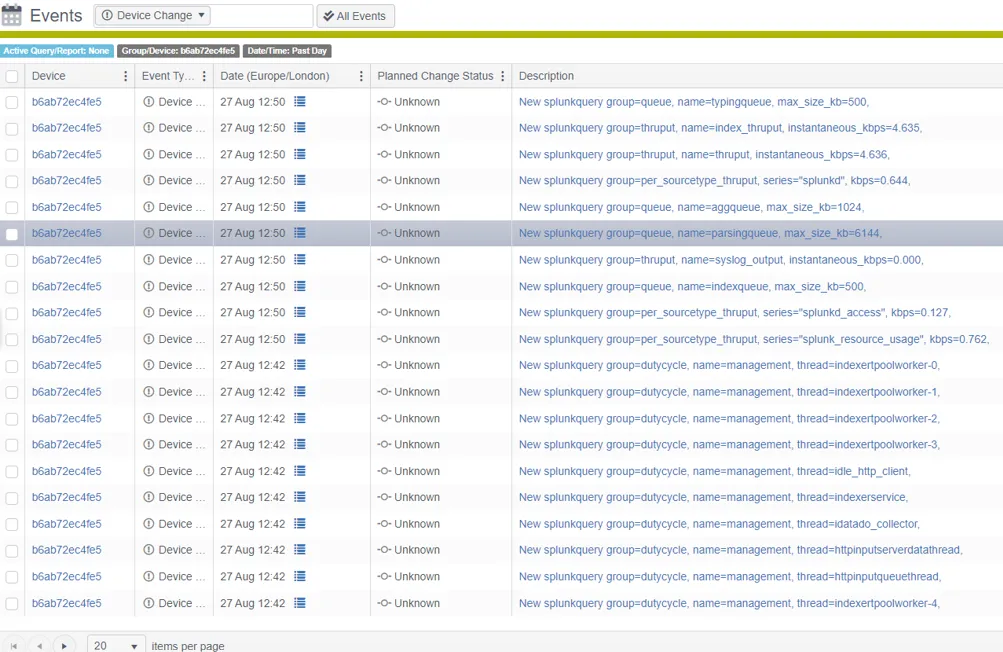
The body of a Splunk event shows the required fields from the SPL query. Change Tracker adds any field in the results other than the required fields to the additional info section at the bottom of the event body. This flexible field can list multiple non-required fields from the SPL query. This gives you full control over what Change Tracker logs into the events.
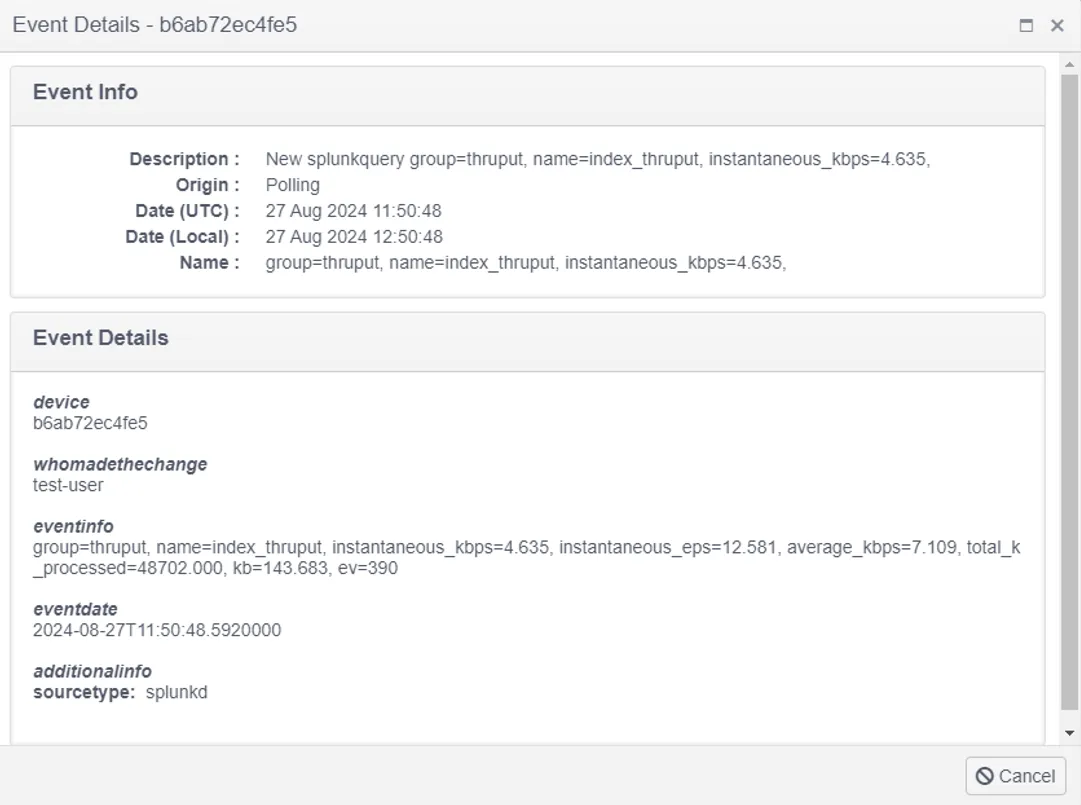
You can run the tracking policy manually from the Splunk device by clicking Start Tracker Poll.