Operations and Health Dashboards
The Dashboard administration area provides a selection of tools to review application health.
Dashboard view
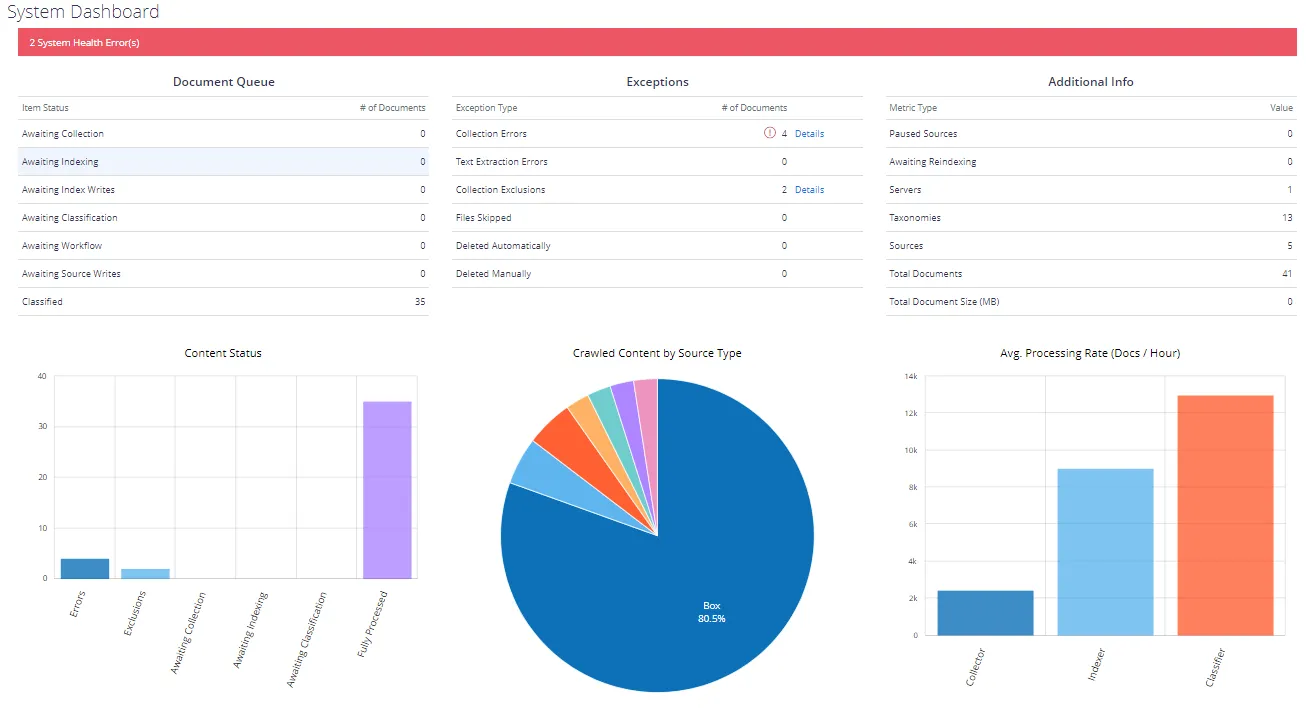
The default screen shows a high-level overview of Netwrix Data Classification statistics, displaying the last active times of each service (with inactive services shown in red). Select the "i" icon next to each date to view the name of the active server as well as batch processing statistics. You can also view the average processing throughput.
If you have the Distributed Query Server functionality enabled, any instances missing their copy of the NDC encryption key also appear here. See Recovering the Encryption Key in Secondary NDC Instances for instructions on remediating missing encryption keys.
The following statistics are available for each thread type:
- Processing Time—The weighted average time for each thread (total batch time / number of documents processed)
- Real Execution Time—The actual execution time of each thread (an average of each thread's run time)
The Collector service caches and regularly updates the statistics shown on the Dashboard screen. If the values aren't updating, ensure that the Collector service is running.
New content appears as Awaiting Collection, and progresses through to Fully Processed.
The "Exceptions" section indicates content that failed to process fully, with the following meanings:
- Collection Errors—Items that failed to process during collection (typically due to an error from the source system)
- Text Extraction Errors—Items that failed text extraction (either partially or fully)—this typically means that the full text for the affected documents isn't available
- Collection Exclusions—Items that the product excluded due to a configured Collection Exclusion
- Files Skipped—File share items that the product ignored due to the "Files Included" or "Files Excluded" configuration
- Deleted Automatically—Items that the product detected as removed from the source system
- Deleted Manually—Items removed manually by an end-user via the administration console
The product retains deleted documents as a safeguard against accidental deletion. Click the Expunge option located on the Deleted Automatically and Deleted Manually rows to fully remove those documents from the system. You can enable automatic expunging via the Administration configuration settings. The Expunge option appears only if there are documents to expunge.
System Health
The health service provides a traffic light based reporting system. Colour-coded traffic lights appear in the top menu bar when the service detects issues. The traffic lights provide a quick link to this page to display more detailed information.
A list of reported issues appears, with the ability to view a detailed description of the problem and suggested resolution steps.
You can also configure notifications of system issues, along with daily reports of outstanding system issues.
-
Click Dismiss at the bottom.
-
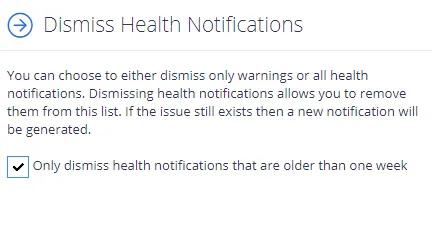
Select Only dismiss health notifications that are older than one week, if you don't want notifications about outdated issues.
-
Select what you want to dismiss – warnings and all security notifications.
Netwrix Data Classification Service Viewer
The Netwrix Data Classification Service Viewer displays a live stream of the current work that the NDC services are processing. As the services progress each document, the display changes. Once all work is complete, "Idle..." appears.
This functionality may not work in older browsers. In this case, use the "on-server" application Netwrix Data Classification Service Viewer.