I see many instances of the Endpoint Policy Manager Watcher (ppWatcher) service running on my clients, is that normal? And how can I check memory usage?
Depending on the client machine architecture (32 or 64 bit) and the number of users logged in to that client (either locally or via TS/RDS), the number of instances of each service will vary.
x86
| Service –> | PP Core Client | PP Watcher Service x64 | PP Watcher Service x86 |
|---|---|---|---|
| System instance | X | X | |
| Per user instance (Local/TS/RDS) | X |
x64
| Service –> | PP Core Client | PP Watcher Service x64 | PP Watcher Service x86 |
|---|---|---|---|
| System instance | X | X | X |
| Per user instance (Local/TS/RDS) | X | X |
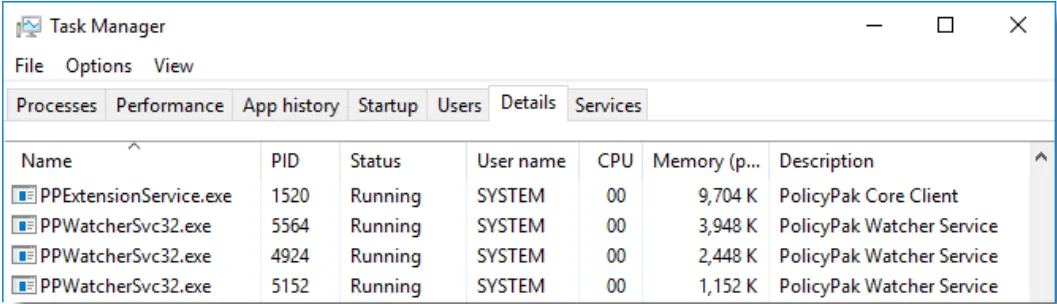
For example, an x64 machine with a single user logged in would have 5 instances.
If another user logged in, it would add another pair of PPWatcherSvc (32/64) instances for a total of 7 processes.
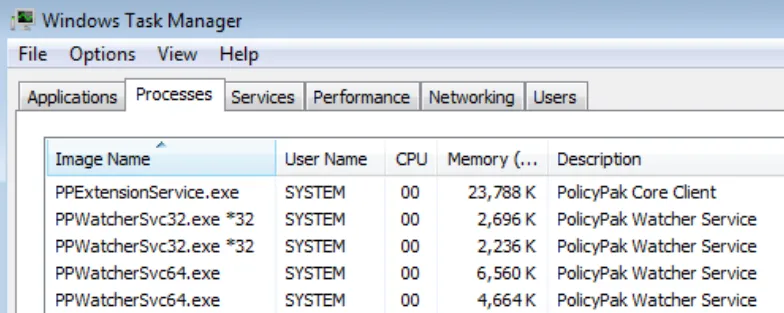
An x86 system with TWO users logged in would look like this.
As for memory usage, you can expect there to be around 5MB per session; split between the 32bit and 64bit processes.
So for instance, if you have 100 users / sessions on a 64-bit RDS or multi-session Windows device, you can expect the memory footprint to only be 500MB.
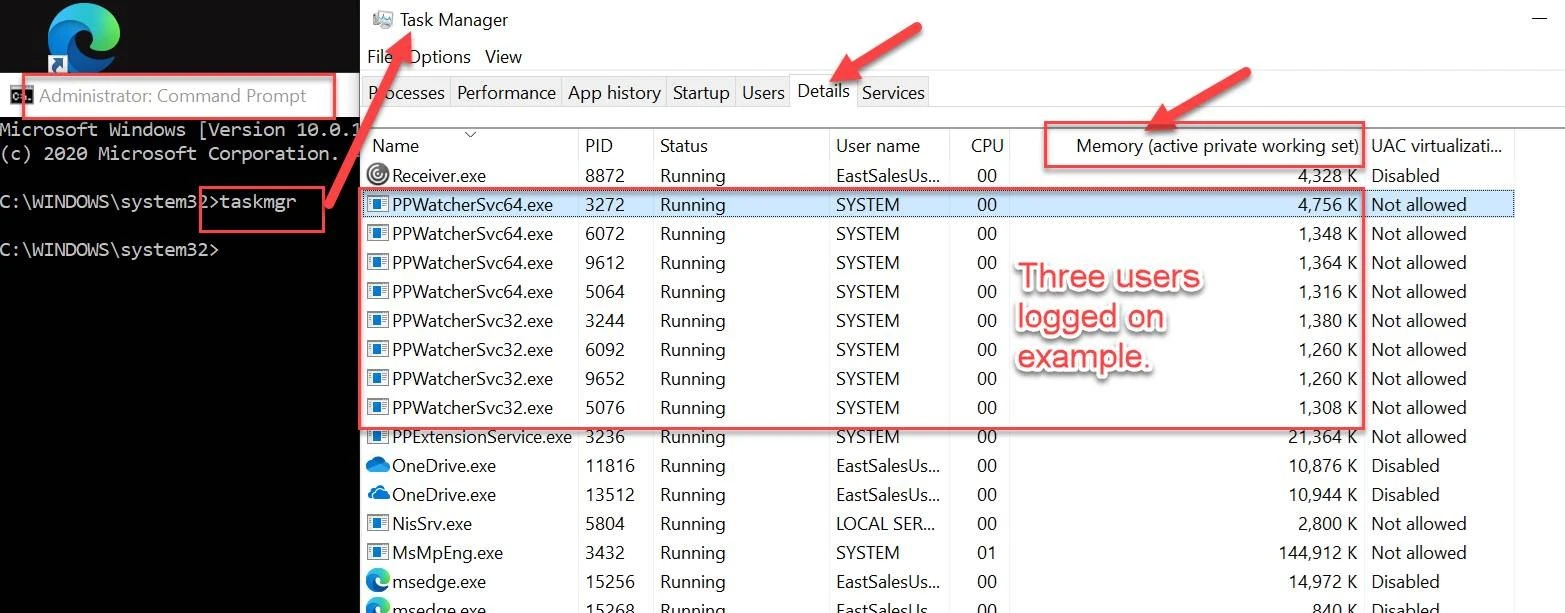
You can manually add up the actual usage by running TaskManager (taskmgr) as a local admin, then ensure that the COLUMN labeled "Memory (active private working set)" is specified and shown in the
Details column, like what's seen here.
Then you can add up the RAM used. For this example with three logged on users the total PPWatcherSvc memory is 13.92 MB.