Reports and Analysis
This section provides an overview of the system logs, Device Control logs and shadows, Content Aware logs and shadows, eDiscovery logs, admin actions, statistics, and other helpful information.
eDiscovery scan results are accessible both from this section and from the dedicated eDiscovery > Scan Results and Actions section. You can view Enforced Encryption details in the Enforced Encryption section.
As an additional security measure, the Super Administrator can protect this section with an additional password from System Configuration > System Security.
Device Control logs
Device Control logs display events related to device connections, file transfers, and policy enforcement. When the scalability architecture is active, Endpoint Protector stores Device Control logs in CrateDB and displays them in an updated log view with improved filtering and sorting.
The log view supports:
- Column selection through the Show/Hide Columns control
- Filtering by date range, computer, user, device, event type, and other attributes
- Sorting by any visible column
- Export to Excel, PDF, or CSV
Logs report
From this section, you can view, sort, and export the main logs in the system. This section includes several event types, such as User Login, User Logout, AD Import, AD Synchronization, Uninstall Attempt, and others. You can also view the main Device Control logs in this section.
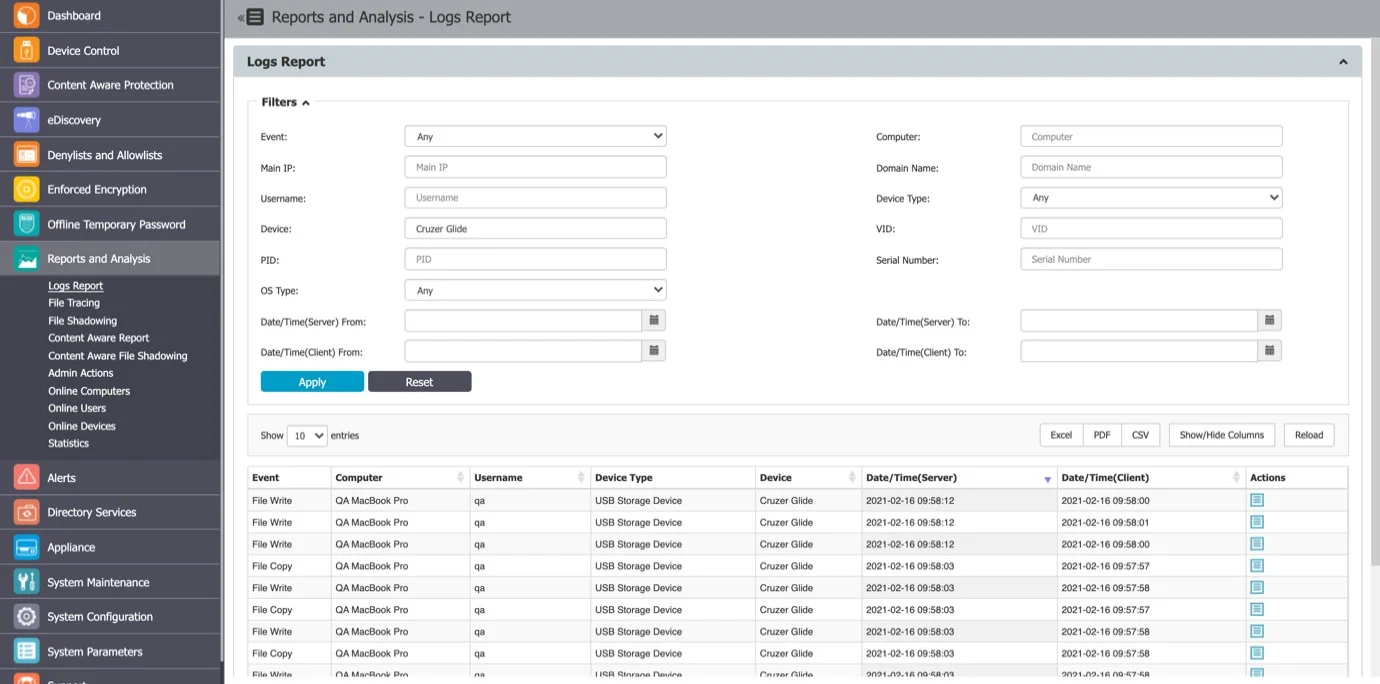
Use the Filters option to view and sort different log types, then export the result list.
File tracing
This section provides an overview of trace files transferred from a protected computer to a portable device or another computer on the network, and vice versa.
Endpoint Protector computes an MD5 hash for most files to which the File Tracing feature applies. This approach helps mitigate threats from changing file content.
You can export the search results (as Excel, PDF, or CSV) or create an export containing the entire log report as a CSV file.
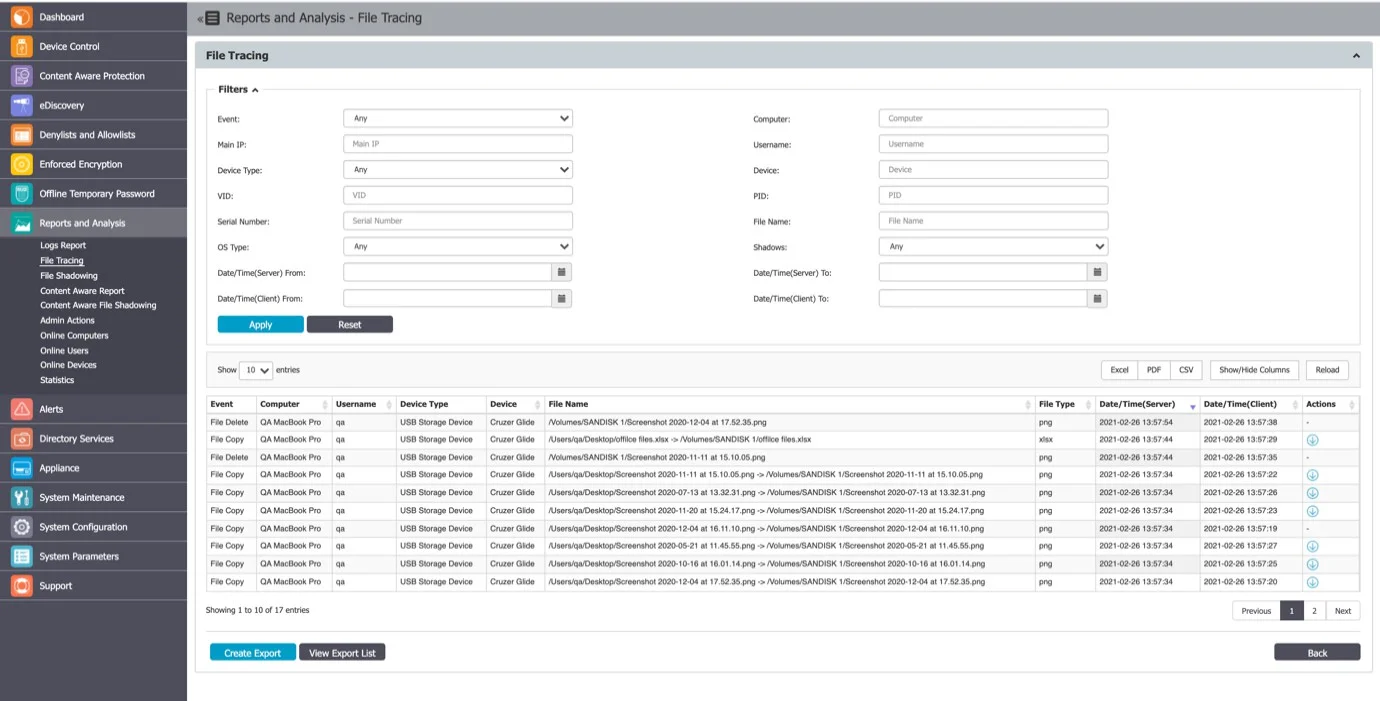
File tracing events by direction
This table shows how Endpoint Protector categorizes file tracing events based on data transfer directions.
This matrix refers to clients from the 5.9.0.0 release and later.
File Tracing Events Matrix by Direction
| Direction | Windows | macOS | Linux |
|---|---|---|---|
| Local -> Local (Partition 0) | N/A | N/A | N/A |
| Local -> Removable | Src & Dest | Src & Dest | Src & Dest |
| Local -> Network share | Src & Dest | Src & Dest | N/A |
| Local -> Partition 1 | Src & Dest | N/A | N/A |
| Removable -> Local (Partition 0) | Src & Dest | Src & Dest | Src & Dest |
| Removable -> Removable | Src & Dest | Dest | Src & Dest |
| Removable -> Network share | Src & Dest | Dest | N/A |
| Removable -> Partition 1 | Src & Dest | Src & Dest | Src & Dest |
| Network share -> Local (Partition 0) | Src & Dest | Src & Dest | N/A |
| Network share -> Removable | Src & Dest | Dest | N/A |
| Network share -> Network share | Src & Dest | Dest | N/A |
| Network share -> Partition 1 | Src & Dest | Src & Dest | N/A |
| Partition 1 -> Local (Partition 0) | N/A | N/A | N/A |
| Partition 1 -> Removable | Src & Dest | Src & Dest | Src & Dest |
| Partition 1 -> Network share | Src & Dest | Src & Dest | N/A |
| Partition 1 -> Partition 0 | N/A | N/A | N/A |
Legend:
- Partition 0 -> Boot Partition (OS)
- Partition 1 -> 2nd Partition (second OS or Data Partition)
Content Aware report
From this section, you can view Content Aware logs and detect data incidents corresponding to the Content Aware policies applied. When the scalability architecture is active, Content Aware logs are stored in CrateDB.
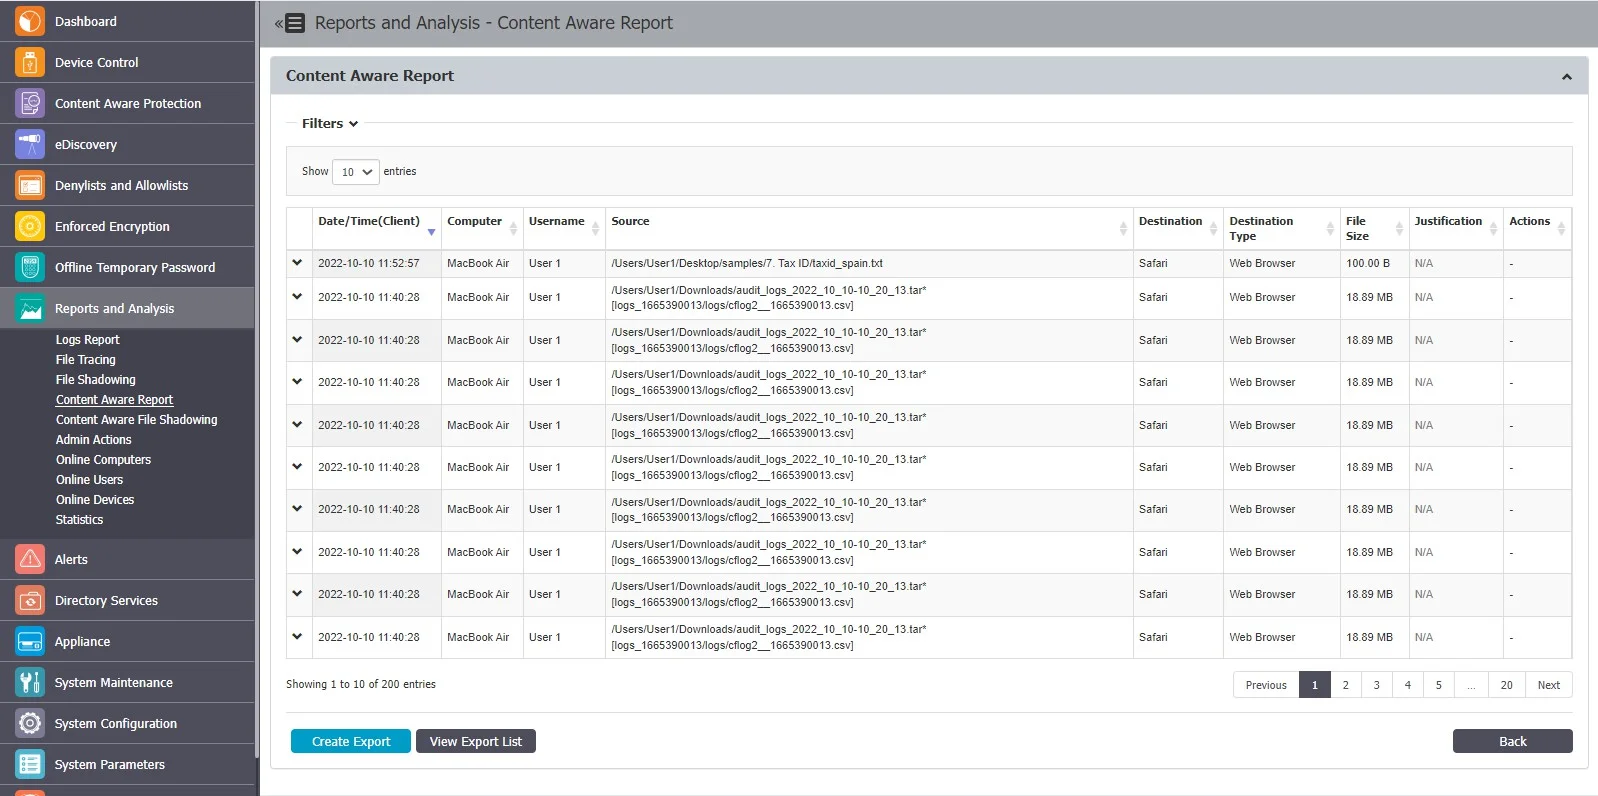
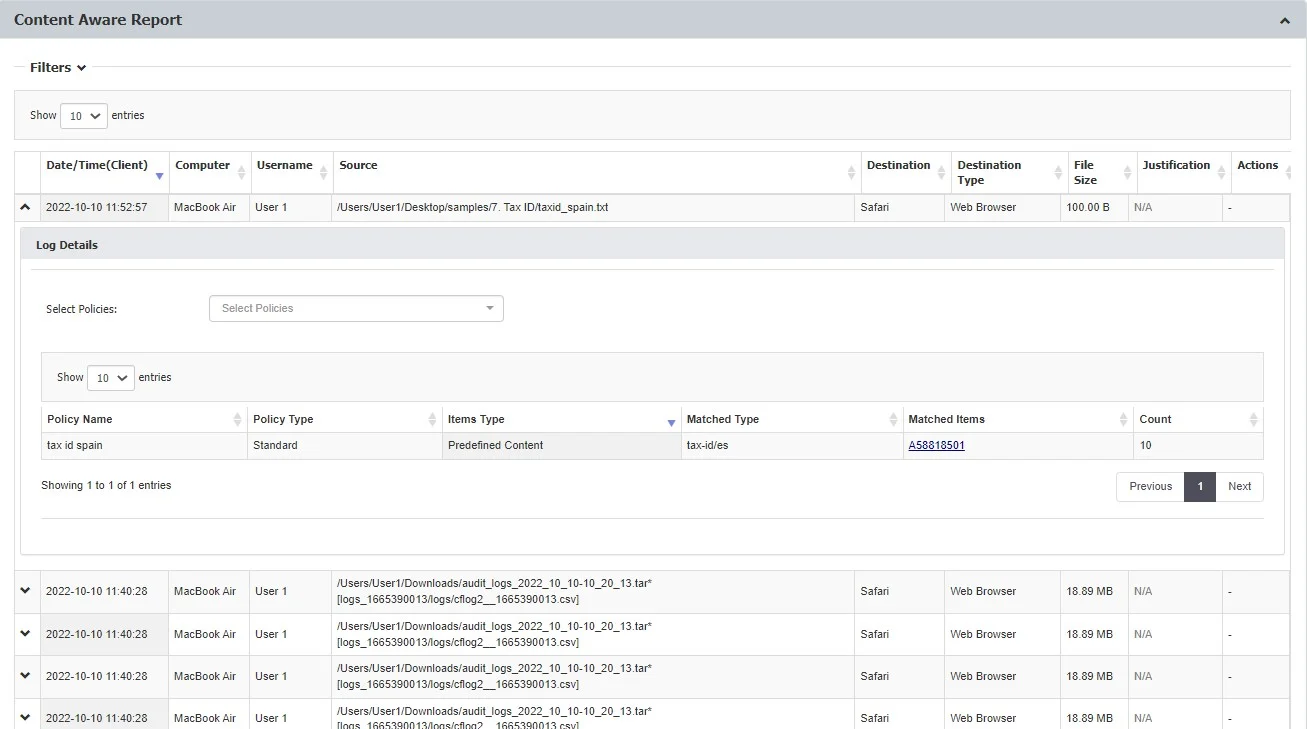
When using the latest Endpoint Protector client, you can view log details structured per file scanned.
Expand each entry to view detailed log information:
- Policy—select an active policy from the dropdown list
- Policy name—the name of the selected policy
- Policy type—the type of the selected policy
- Items type—the Policy Denylist category selected
- Matched type—the Policy Denylist type selected
- Matched items—click the link to view a pop-up window with the list of matched items

- Count—the number of matched items
Use the Show/Hide Columns dropdown to customize which columns are visible in the report. The Date/Time(Client UTC) column is available in this dropdown but is hidden by default.
From the Filters section, select the Include old logs before 5.7 upgrade option to include all logs in your searches. If you don't select the option, the filters apply only to the new structure of logs. The Date/Time(Client UTC) field is also available as a filter option.
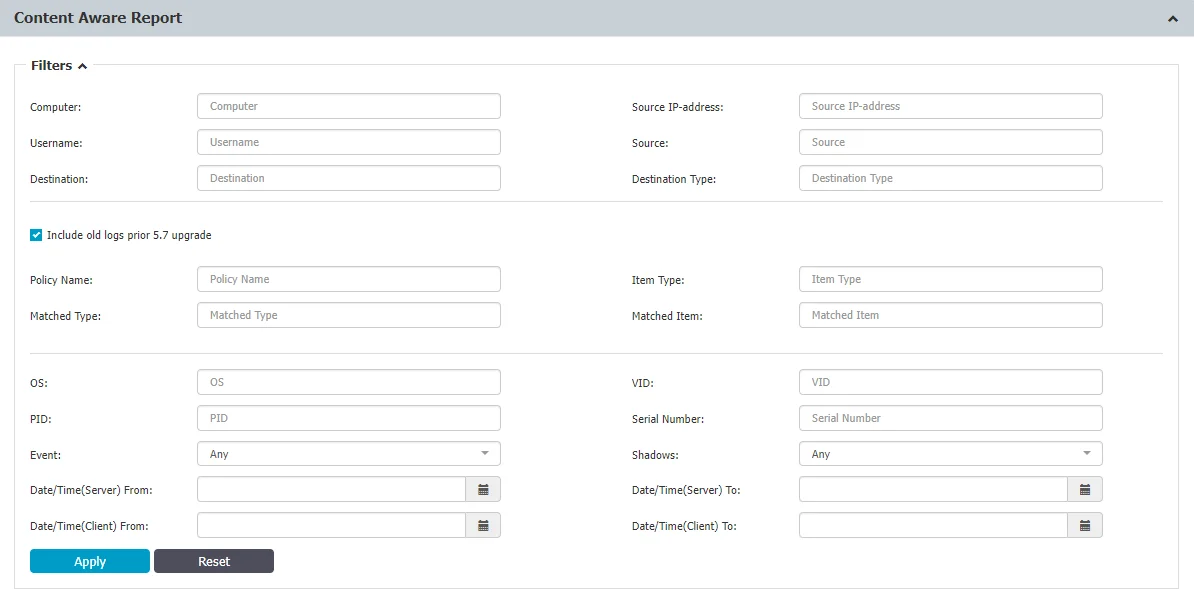
For macOS users, when the Deep Packet Inspection feature is enabled on the Endpoint Protector agent for macOS, the agent might not provide full destination details for files transferred from a network share through monitored applications, such as browsers. In such cases, the destination information might not be complete.
For Linux users, the Endpoint Protector agent doesn't support network share visibility, except for files transferred from a network share through Deep Packet Inspection monitored applications, such as browsers.
Export Content Aware reports
You can export Content Aware logs as Excel, PDF, or CSV, or create an export containing the entire log report as a CSV or XLSX file.
Excel/PDF/CSV—located above the Content Aware Reports list, this exports only the default columns. The Date/Time(Client UTC) column is included in exports when selected through Show/Hide Columns.

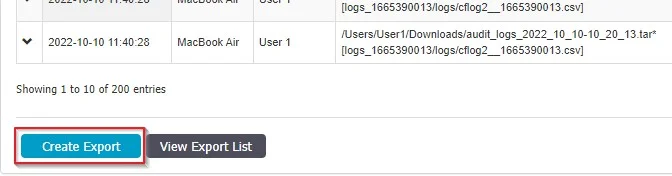
Create Export—located below the Content Aware Reports list, this creates an export containing all data, including the expanded Logs Details section with columns for Policy Type, Policy Name, Item type, Matched type, Matched items, and Count.
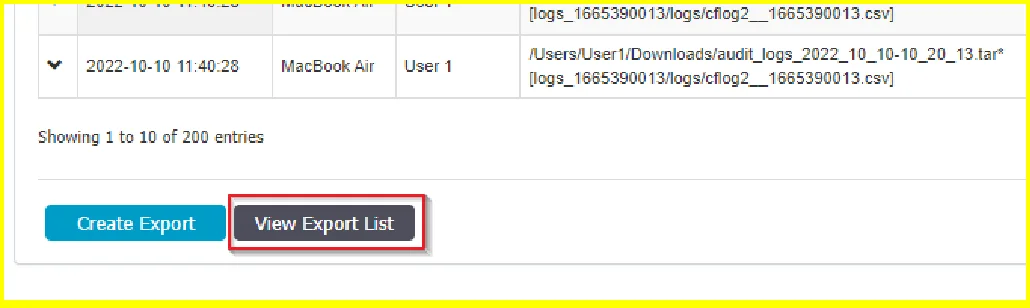
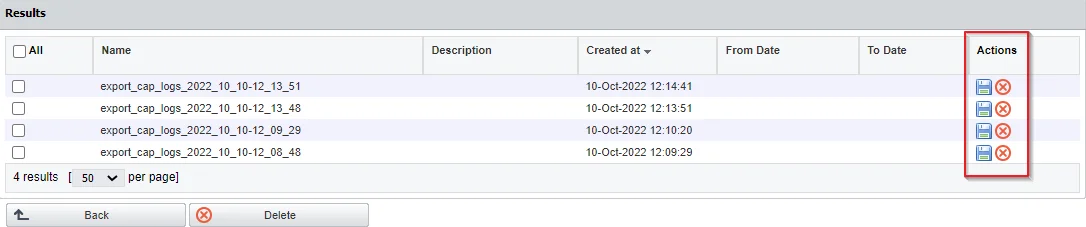
After the message displays that a new export is available on the Export List, click View Export List to open the list of Reports, where you can download or delete a report.
eDiscovery logs
eDiscovery scan results are accessible from the Reports and Analysis section. The eDiscovery log view displays discovered files with their detection details, remediation status, and associated policies.
Endpoint Protector stores eDiscovery logs in CrateDB, and they support the same filtering, sorting, and export capabilities as Device Control and Content Aware logs.
For detailed information on viewing and managing eDiscovery scan results, see Scan results and actions.
Export list
The Export List shows all exports held on the server, regardless of log type. Access it at any time by clicking View Export List in any log report section. The Export List includes exports for Device Control, Content Aware Protection, and eDiscovery logs.
From the Export List you can download completed exports or delete entries you no longer need. Deleting an entry removes both the record and the archive file from the server.
Scheduled exports
The Export List contains two types of export: exports you create manually, and exports Endpoint Protector generates automatically.
Endpoint Protector generates a scheduled export once per day for each module: Device Control, Content Aware Protection, and eDiscovery. Endpoint Protector creates these scheduled exports during the upgrade to 2608, and they run without any configuration.
Identify the two types by the file name prefix:
Scheduled_Export_...— Endpoint Protector generates these automatically. For example,Scheduled_Export_Device_Control_Logs_2026-09-09 06:00:00.Generated_Export ...— an administrator creates these manually. For example,Generated_Export 2026-09-09_14-22-05.
Scheduled exports belong to the system rather than to an administrator, so no user name appears against them in the Export List. This is expected and doesn't indicate a configuration problem.
You can't view, change, or disable the daily schedule for automatic exports from the interface.
Background processing
When you click Create Export, Endpoint Protector queues the request and processes it in the background. The server processes one export at a time. This means:
- You don't need to stay on the page while the export runs.
- If an export is already running, your new request waits in the queue.
- You can't create additional exports while the banner is showing.
When an export is in progress, a banner appears at the top of the page:
A log Report Export is currently running and will be ready soon. Until then, no additional Exports can be created and the displaying Log Report Results may be slower.
Wait for the current export to finish before starting a new one. The banner disappears when processing is complete. Large exports might take several minutes depending on the number of records and the load on the server.
If a system backup is running at the same time as an export, Endpoint Protector cancels queued exports automatically. Create the export again after the backup completes.
Export retention
Endpoint Protector deletes completed exports automatically after a configurable retention period. The default is 29 days. It removes both the entry in the Export List and the archive file on disk.
This cleanup applies to manual and scheduled exports alike, so exports don't accumulate on the server over time.
Export retention controls how long Endpoint Protector keeps the generated export files. It doesn't affect how long Endpoint Protector stores the log data itself. To control log data retention, use the Enable Log Rotate After setting described in Log Settings.
Admin actions
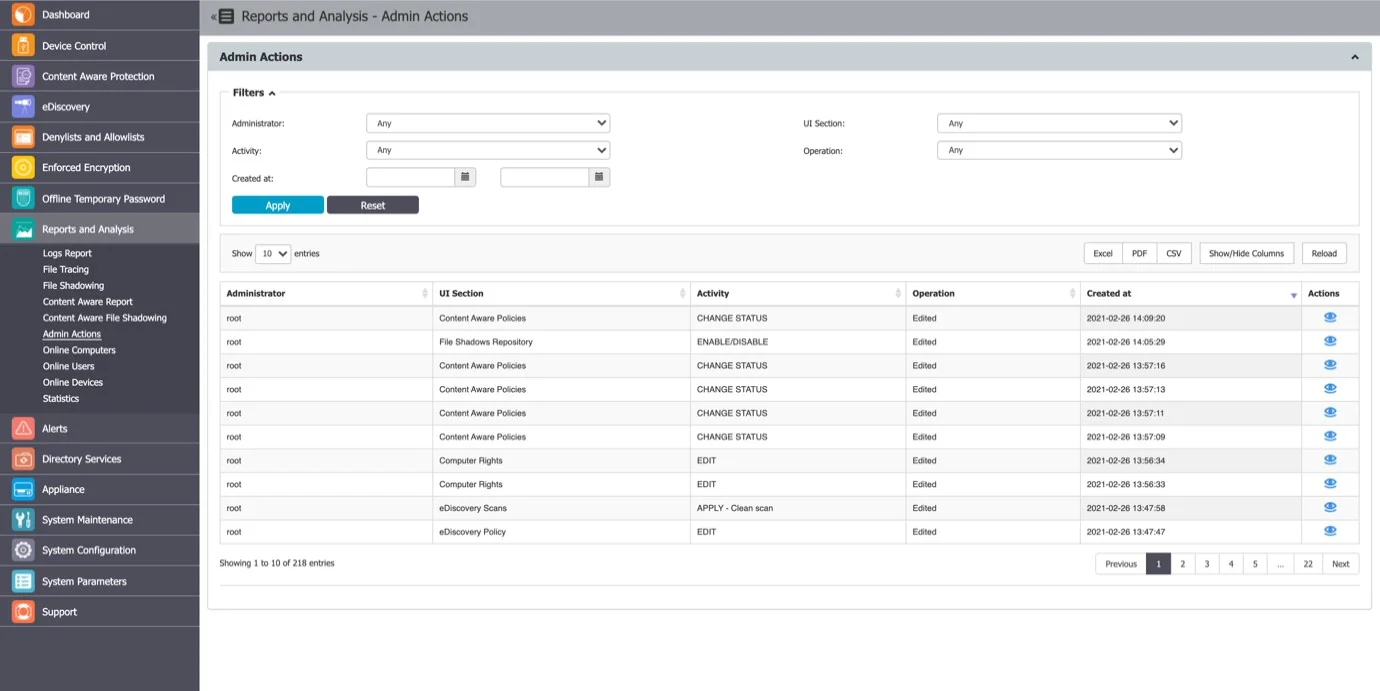
This section provides an overview of every important action performed in the interface. From the Action column, you can view additional information.
SCIM provisioning logs
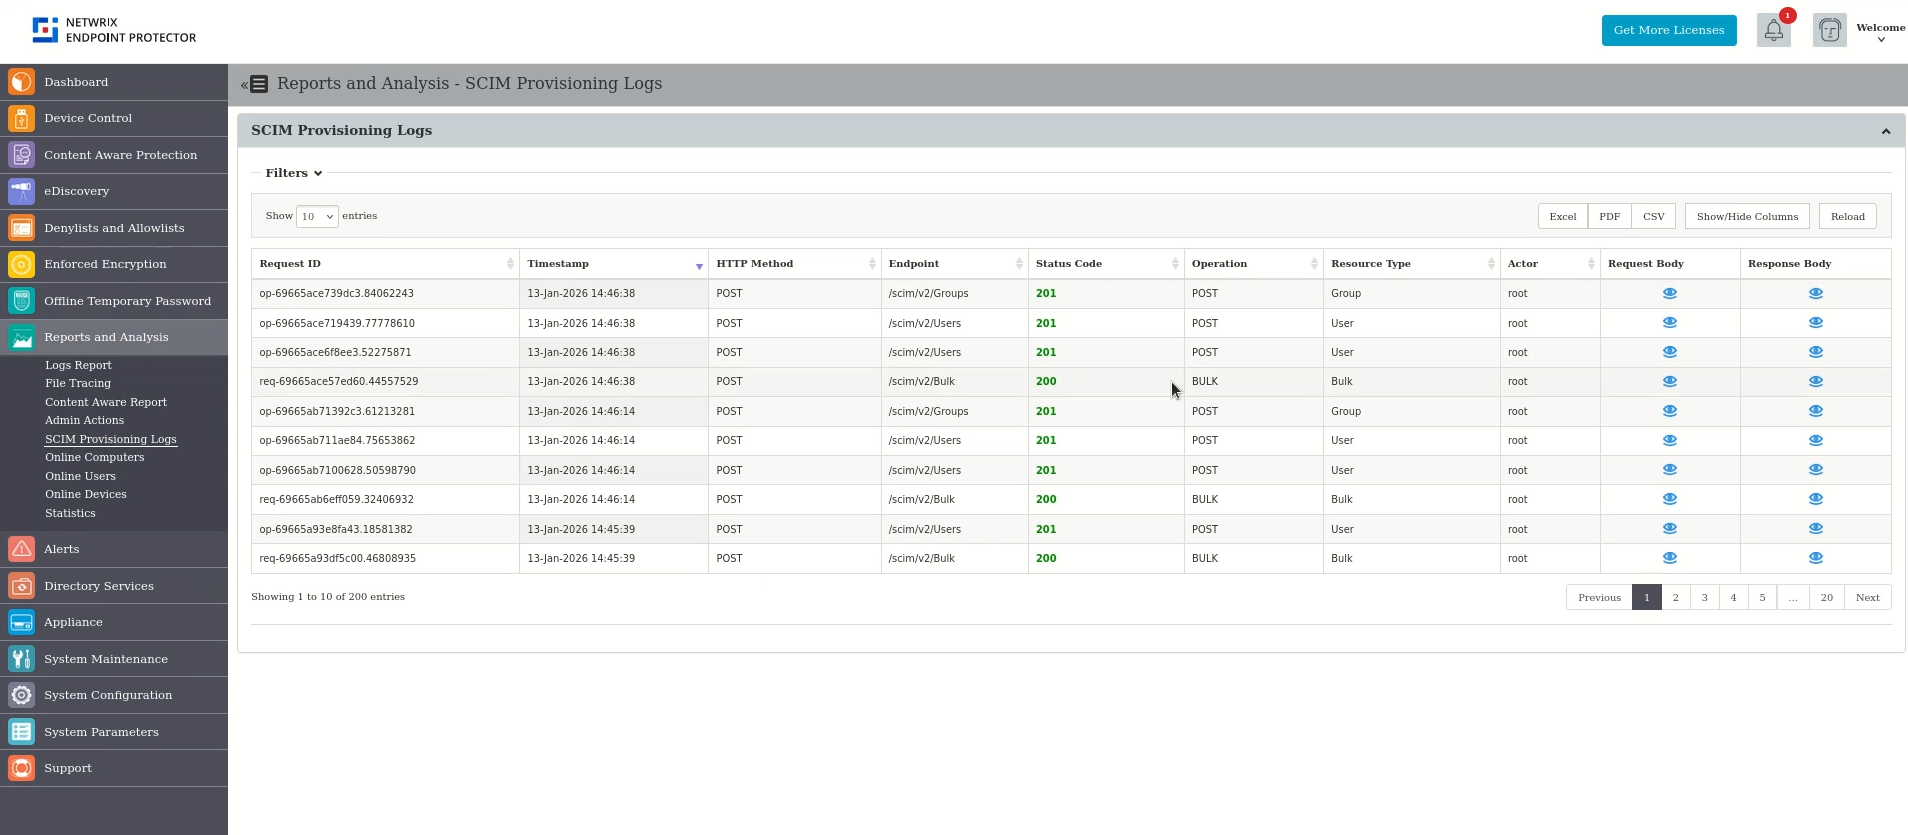
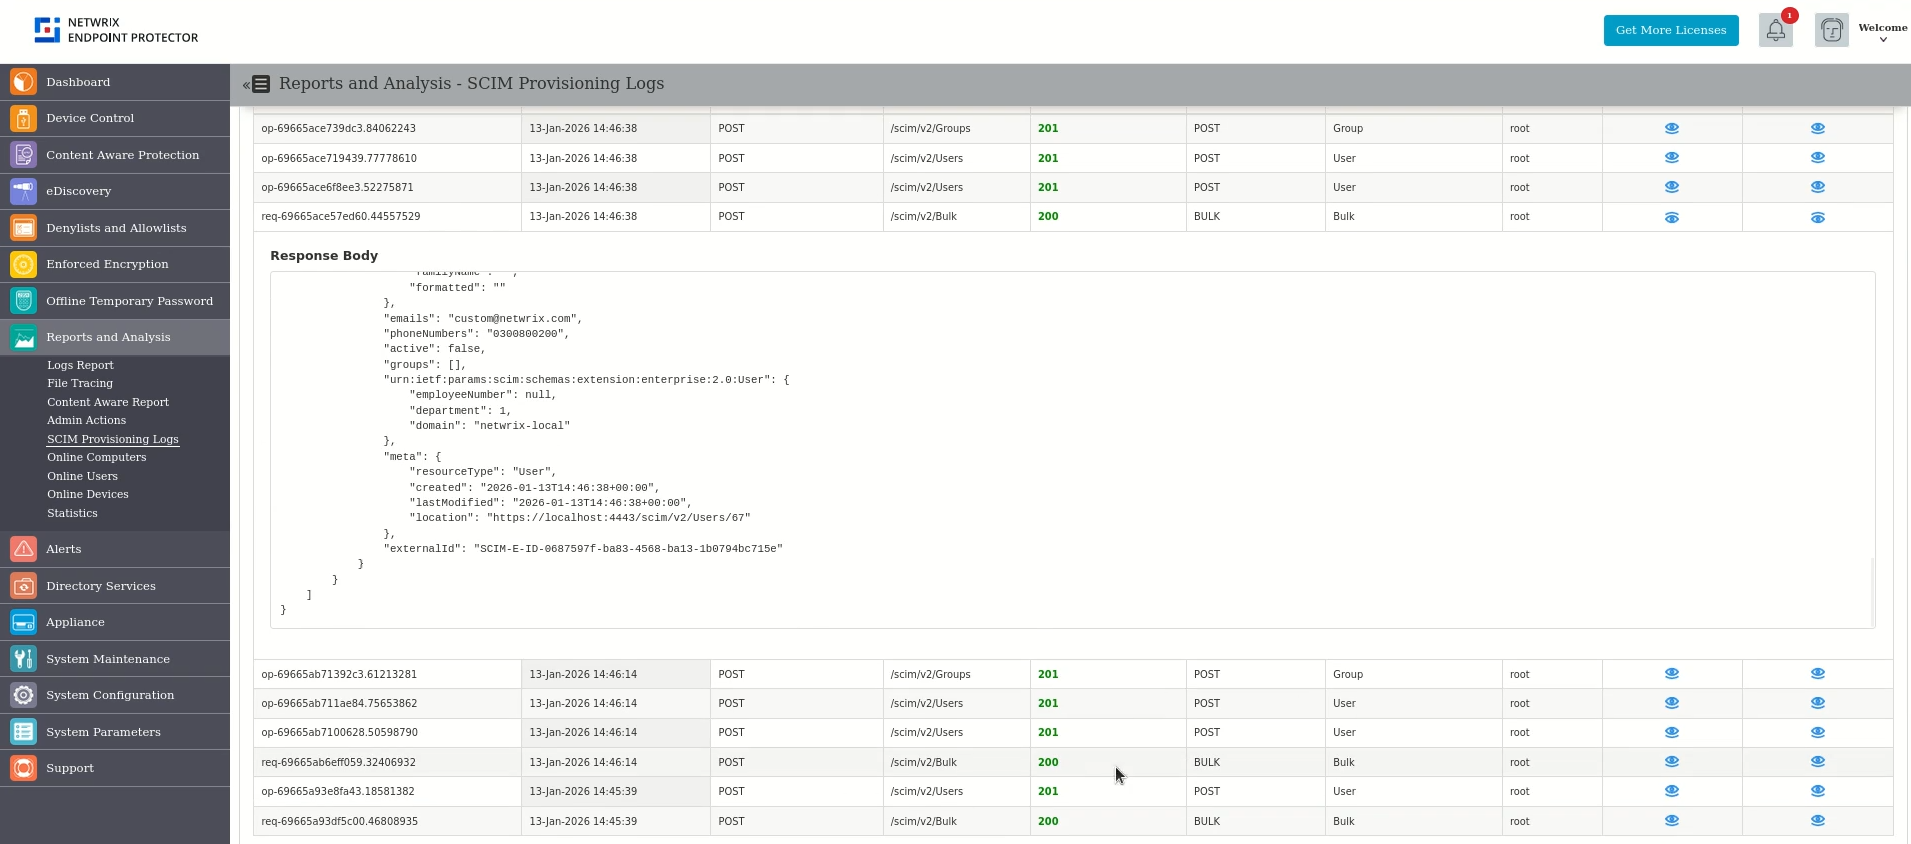
The logs display detailed information for each System for Cross-domain Identity Management (SCIM) request, including:
- Request ID
- Timestamp
- HTTP Method
- Endpoint
- Status Code
- Operation type (POST, PATCH, DELETE, BULK)
- Resource type (User, Group)
- Actor
- Request and response bodies
These logs help administrators:
- Verify successful provisioning
- Troubleshoot synchronization issues
- Support audit and compliance requirements
Online computers
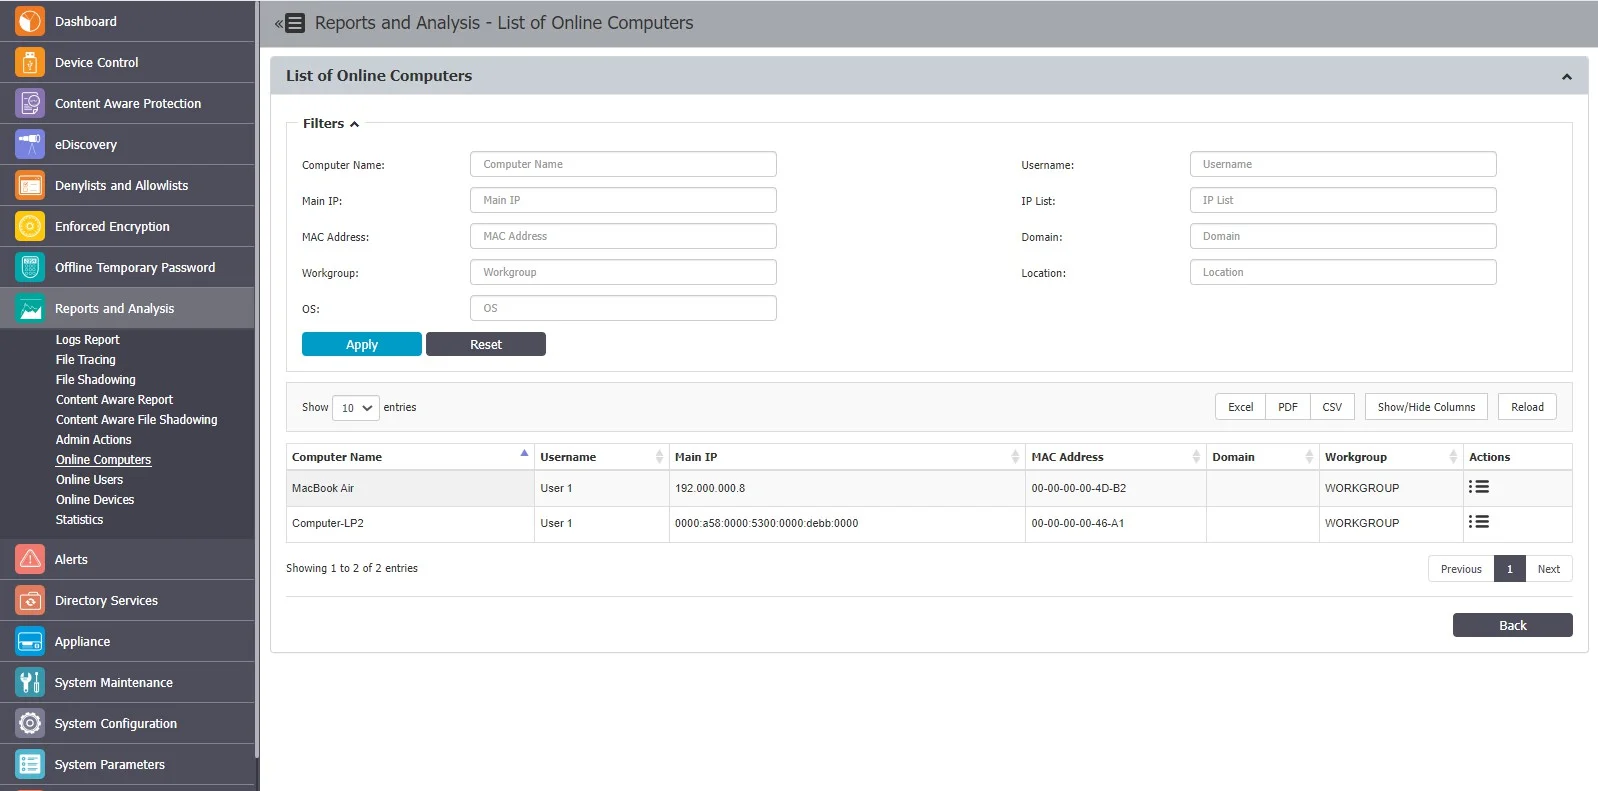
This section provides an overview of computers registered on the system that have an established connection with the server. If the Refresh Interval for computer X is one minute, then computer X was communicating with the server in the last minute.
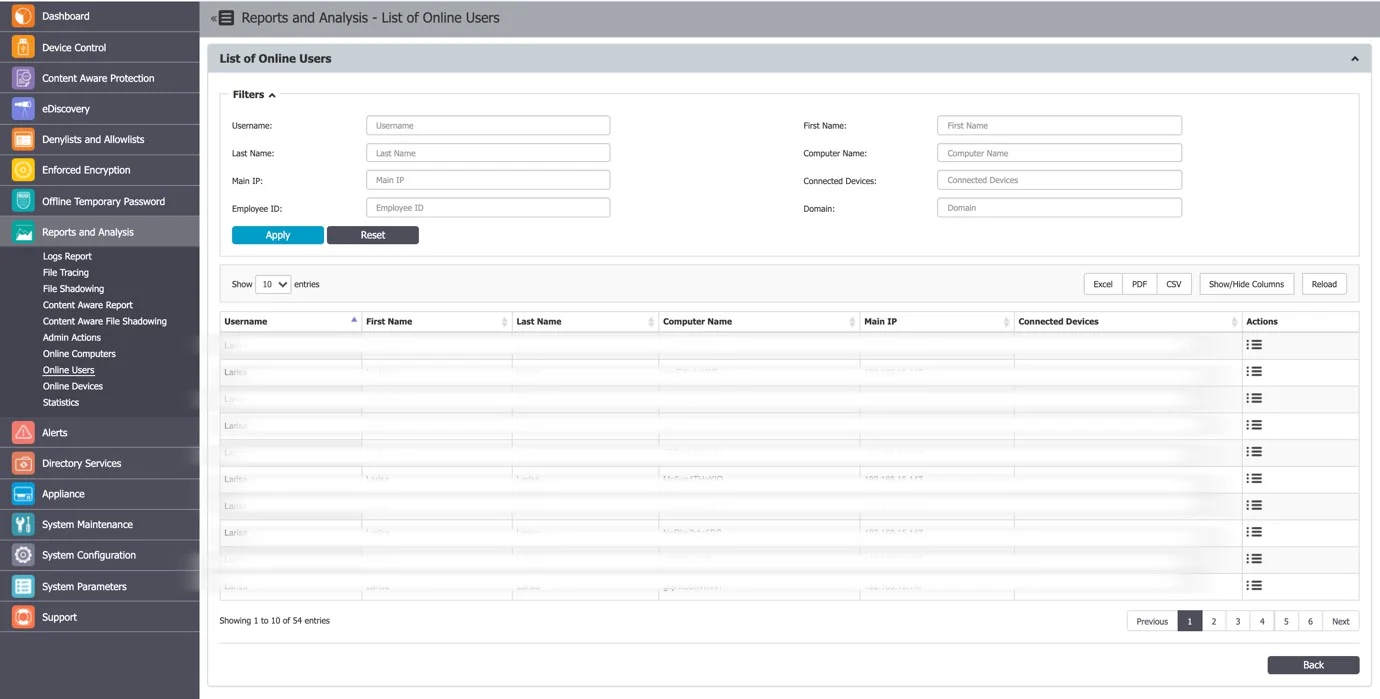
Online users
This section provides an overview of users registered on the system that have an established connection with the server.
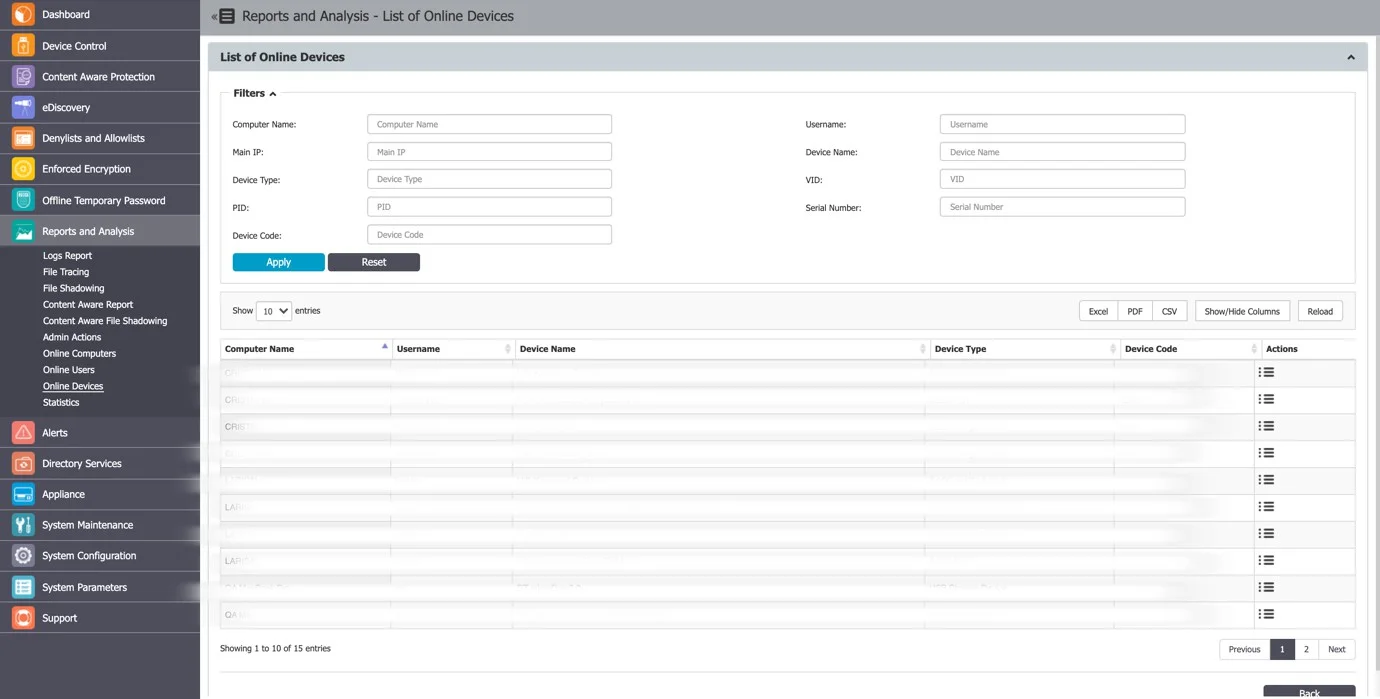
Online devices
This section provides an overview of devices registered on the system that have an established connection with the server.
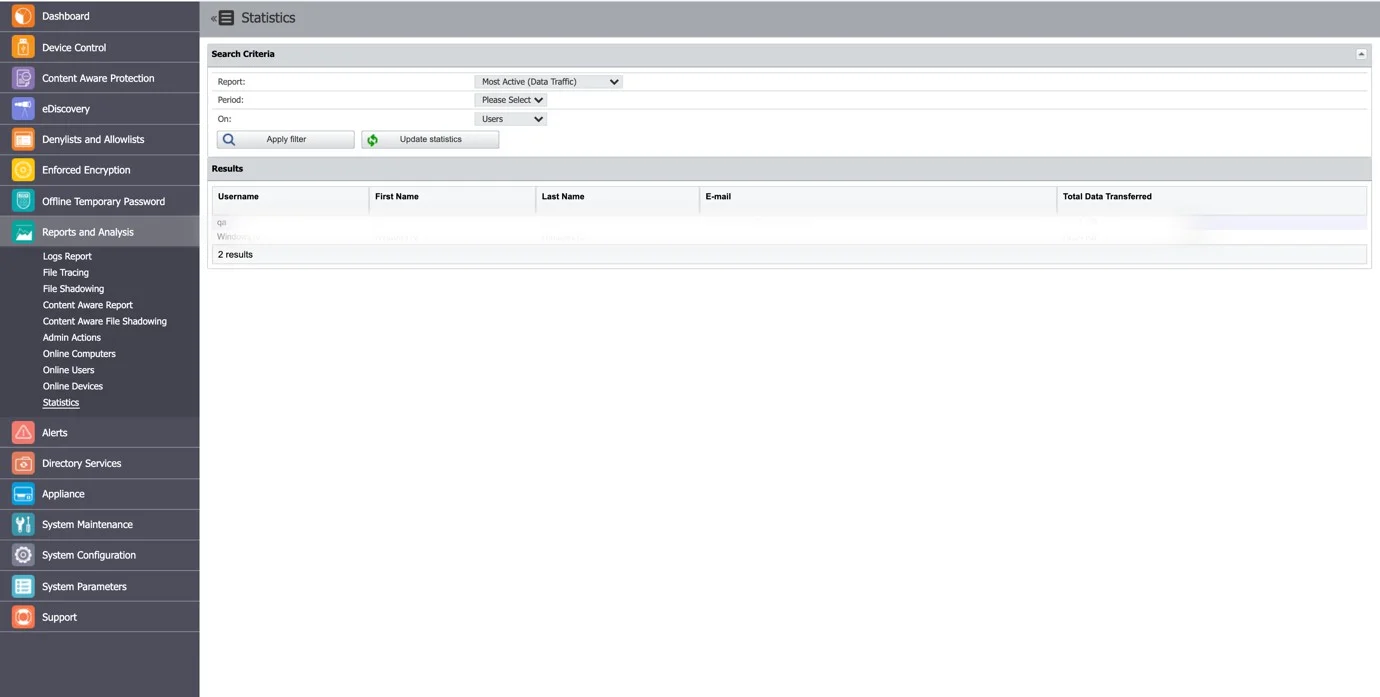
Statistics
The Statistics module lets you view system activity related to data traffic and device connections. Use the integrated filter to generate reports—select the field of interest and click Apply Filter.
Persistent filters
With persistent filters, you can save filter configurations and column visibility preferences to quickly return to a frequently used view. Saved filters are private to your administrator account.
Persistent filters are available on the following pages:
- Reports and Analysis — File Tracing, Content Aware Protection, eDiscovery, and Admin Actions reports
- Device Control — Computers, Users, and Groups lists
Save a filter
- On a supported page, configure the filters and column visibility to match the view you want to save.
- Click Save.
- In the Save as dialog, choose one of the following:
- New filter — enter a Filter name and optional Description, then click Create.
- Existing filter — select a previously saved filter from the list to overwrite it with the current configuration, then click Save.
- On reporting pages, select a Date range option:
-
Use selected — saves the selected date range as part of the filter.
- Predefined range — saves a relative date range that updates automatically each time the filter is loaded. Options: Last day, Last 3 days, Last 7 days, Last 30 days, This Week, This Month, Last Week, Last Month.
noteDate range options are available on reporting pages only. On entity pages (Computers, Users, Groups), filters don't include a date range component.
The filter saves all current filter settings, filter values, and the column visibility configuration for the active view.
Load a filter
- Click Load to display the list of saved filters.
- Select a filter from the list to apply it.
The page updates to reflect the saved filter settings and column visibility.
When you return to a page where you previously used a saved filter, Endpoint Protector loads the last used filter and column view automatically.
Reset filters
Click Reset to clear all applied filters and column visibility settings, returning the page to its default (unfiltered) state.
Delete a filter
- Click Save to open the filter management dialog.
- Select the filter you want to remove.
- Click Delete.
Column visibility
Endpoint Protector saves column visibility preferences automatically per view. When you show or hide columns using the Show/Hide Columns control, the change persists for your administrator account on that specific page.