Analyze Usercube's Data with Power BI
This topic explains how to prepare Usercube's data and use it in Power BI, with the final goal to generate user-friendly reports.
Overview
Power BI is used with Usercube to generate user-friendly reports in an interactive way, based on Usercube's database.
The SaaS edition Power BI Service contains an integrated Usercube connector, so we simply need to make Usercube's data usable by configuring a particular data model.
As this new model is to be organized into XML elements called universes, we will call the new data model the universe model.
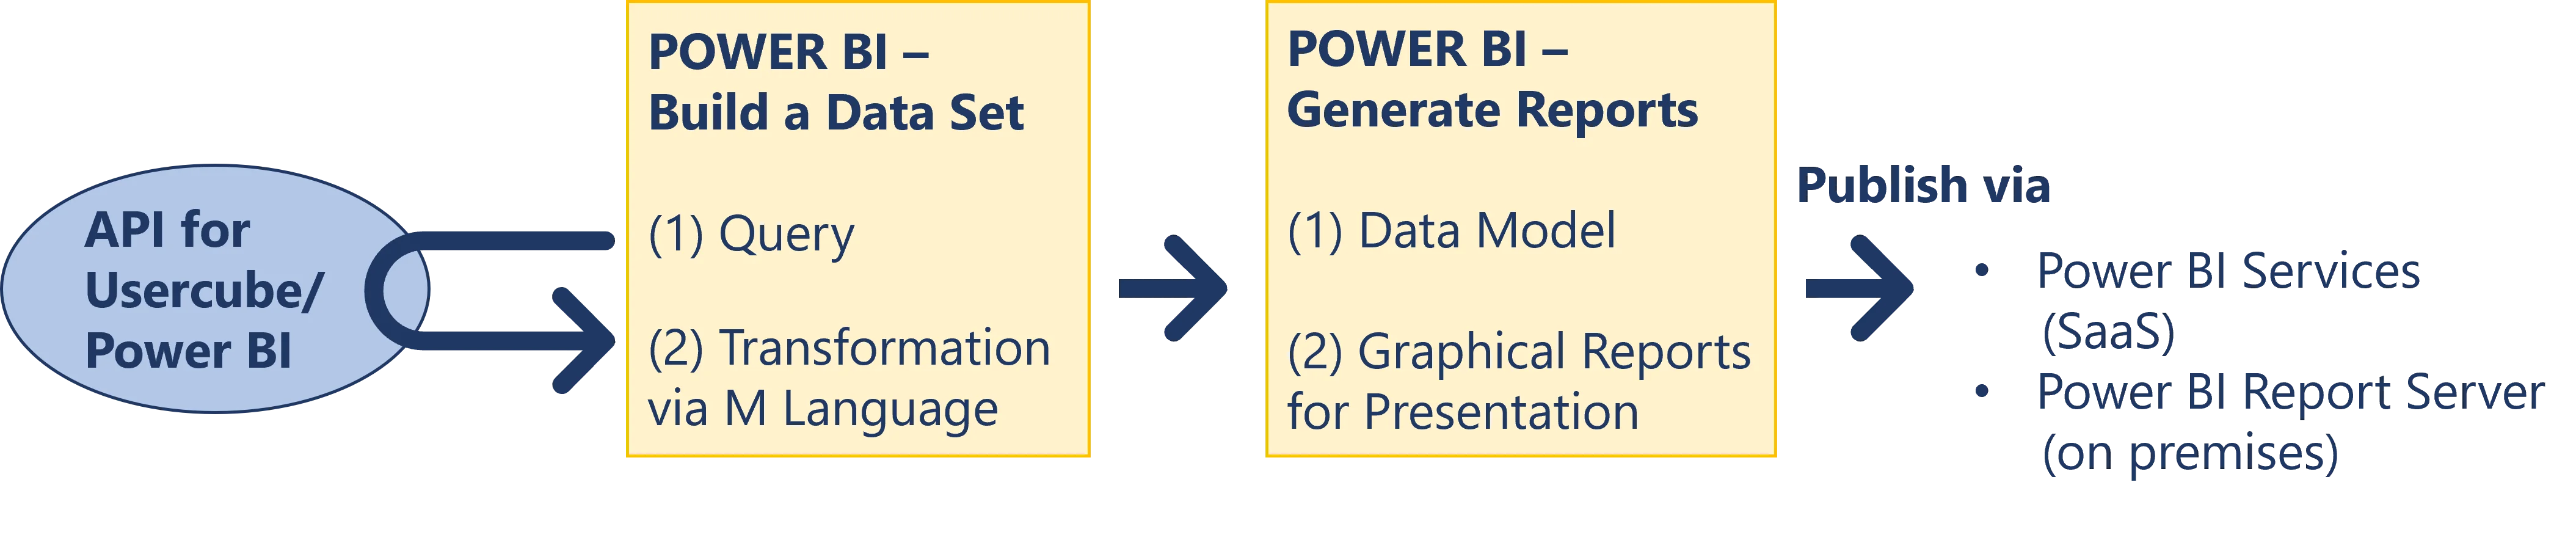
Based on this model, Power BI will be able to:
- query the database
- generate a model containing the data that we want to include in reports
- transform data if needed
- generate customized graphic reports
- publish the reports with Power BI Service (SaaS) or Power BI Report Server (on premises)
Prerequisites
Usercube's licenses for Power BI as well as Usercube Data are required to operate.
Integrators need to know:
- Usercube's data model, i.e. the entity names, the associations between the entities to display, etc. from both Usercube-hard-coded and customized parts
- what data needs to be displayed in the end
NOTE: Power BI is able to analyze all Usercube's data, hard-coded and customized, but only current data, i.e. nothing from the history.
Analyze Usercube's Data with Power BI
Build the universe model by proceeding as follows:
Step 1 – Define the appropriate universes using scaffoldings. See the queries
Remember, in order to understand business intelligence, with its universes, entity instances and association instances. See the Universe topic for additional information. Also note that XML objects that automatically generate XML snippets that would be complex and/or tedious to write manually. See the Scaffoldings topic for additional information.
Netwrix recommends creating no more than one universe to generate one report, to prevent issues about name uniqueness.
Step 2 – Connect Power BI to Usercube to visualize the output model. See the Connect Power BI to Usercube topic for additional information.
The Power BI applications Desktop, Service and Report Server all offer the Usercube plugin to access Usercube's database.
Step 3 – Remember to clear the cache in Power BI when modifying universes, to ensure that all changes are considered.
Step 4 – Customize the queries in Power BI, if needed, with the M language.
You can see in Power BI queries that Usercube must be specified as a source via the expression
Source = Usercube.Universes("<serverURL>").
Integrators may need to customize the model to make it more understandable and easily usable by end-users.
For example, the following M query removes the column Company Id from the table Directory_User_Records, considering that we do not need it for future reports.
Code attributes enclosed with <> need to be replaced with a custom value before entering the
script in the command line.
let
    Source = Usercube.Universes("<http://localhost:5000"),
    Directory_User_SourcesAndTargets = Source{[Name="Directory_User_SourcesAndTargets"]}[Items],
    Directory_User_Records = Directory_User_SourcesAndTargets{[Name="Directory_User_Records"]}[Data],
    Directory_User_Records_WithoutCompany = Table.RemoveColumns(Directory_User_Records,{"Company Id>"})
in
    Directory_User_Records_WithoutCompany
Another common use for manual queries is the denormalization of the model, when it simplifies the future queries and reports for end-users.
Step 5 – Generate reports and publish them for end-users by following the steps listed in the Power BI documentation.
This is how you analyze Usercube data through Power BI.
Maintain the Model
In order to maintain the model you must remenber the ones listed below.
Refresh data
You must define, in Power BI Service or Report Server, a frequency for data refresh so that reports display up-to-date data. See Power BI documentation for additional information.
Data is often refreshed once a day. Define the refresh frequency according to your needs.
Foresee the Impact of Model Modifications
A change inside an existing entity, for example adding a scalar field, does not require any particular actions on the universe model.
A change in an association requires making the corresponding change in the universe model, as association instances (in the universe model) are based on entity associations in Usercube's data model. See the EntityAssociation topic for additional information.
Connect Power BI to Usercube
This guide shows how to connect Power BI to Usercube.
Overview
When facing a periodic need for producing specific reports, especially when a visual presentation is required, Usercube offers the possibility to connect to the Power BI application. This application will allow you to create customized reports with a vast range of display options (such as graphs, charts, matrixes, etc.) using Usercube's universes.
Prerequisites
- Power BI Desktop must be installed on your device.
- Usercube's server must be running.
Connect Power BI to Usercube
Connect Power BI to Usercube by proceeding as follows:
-
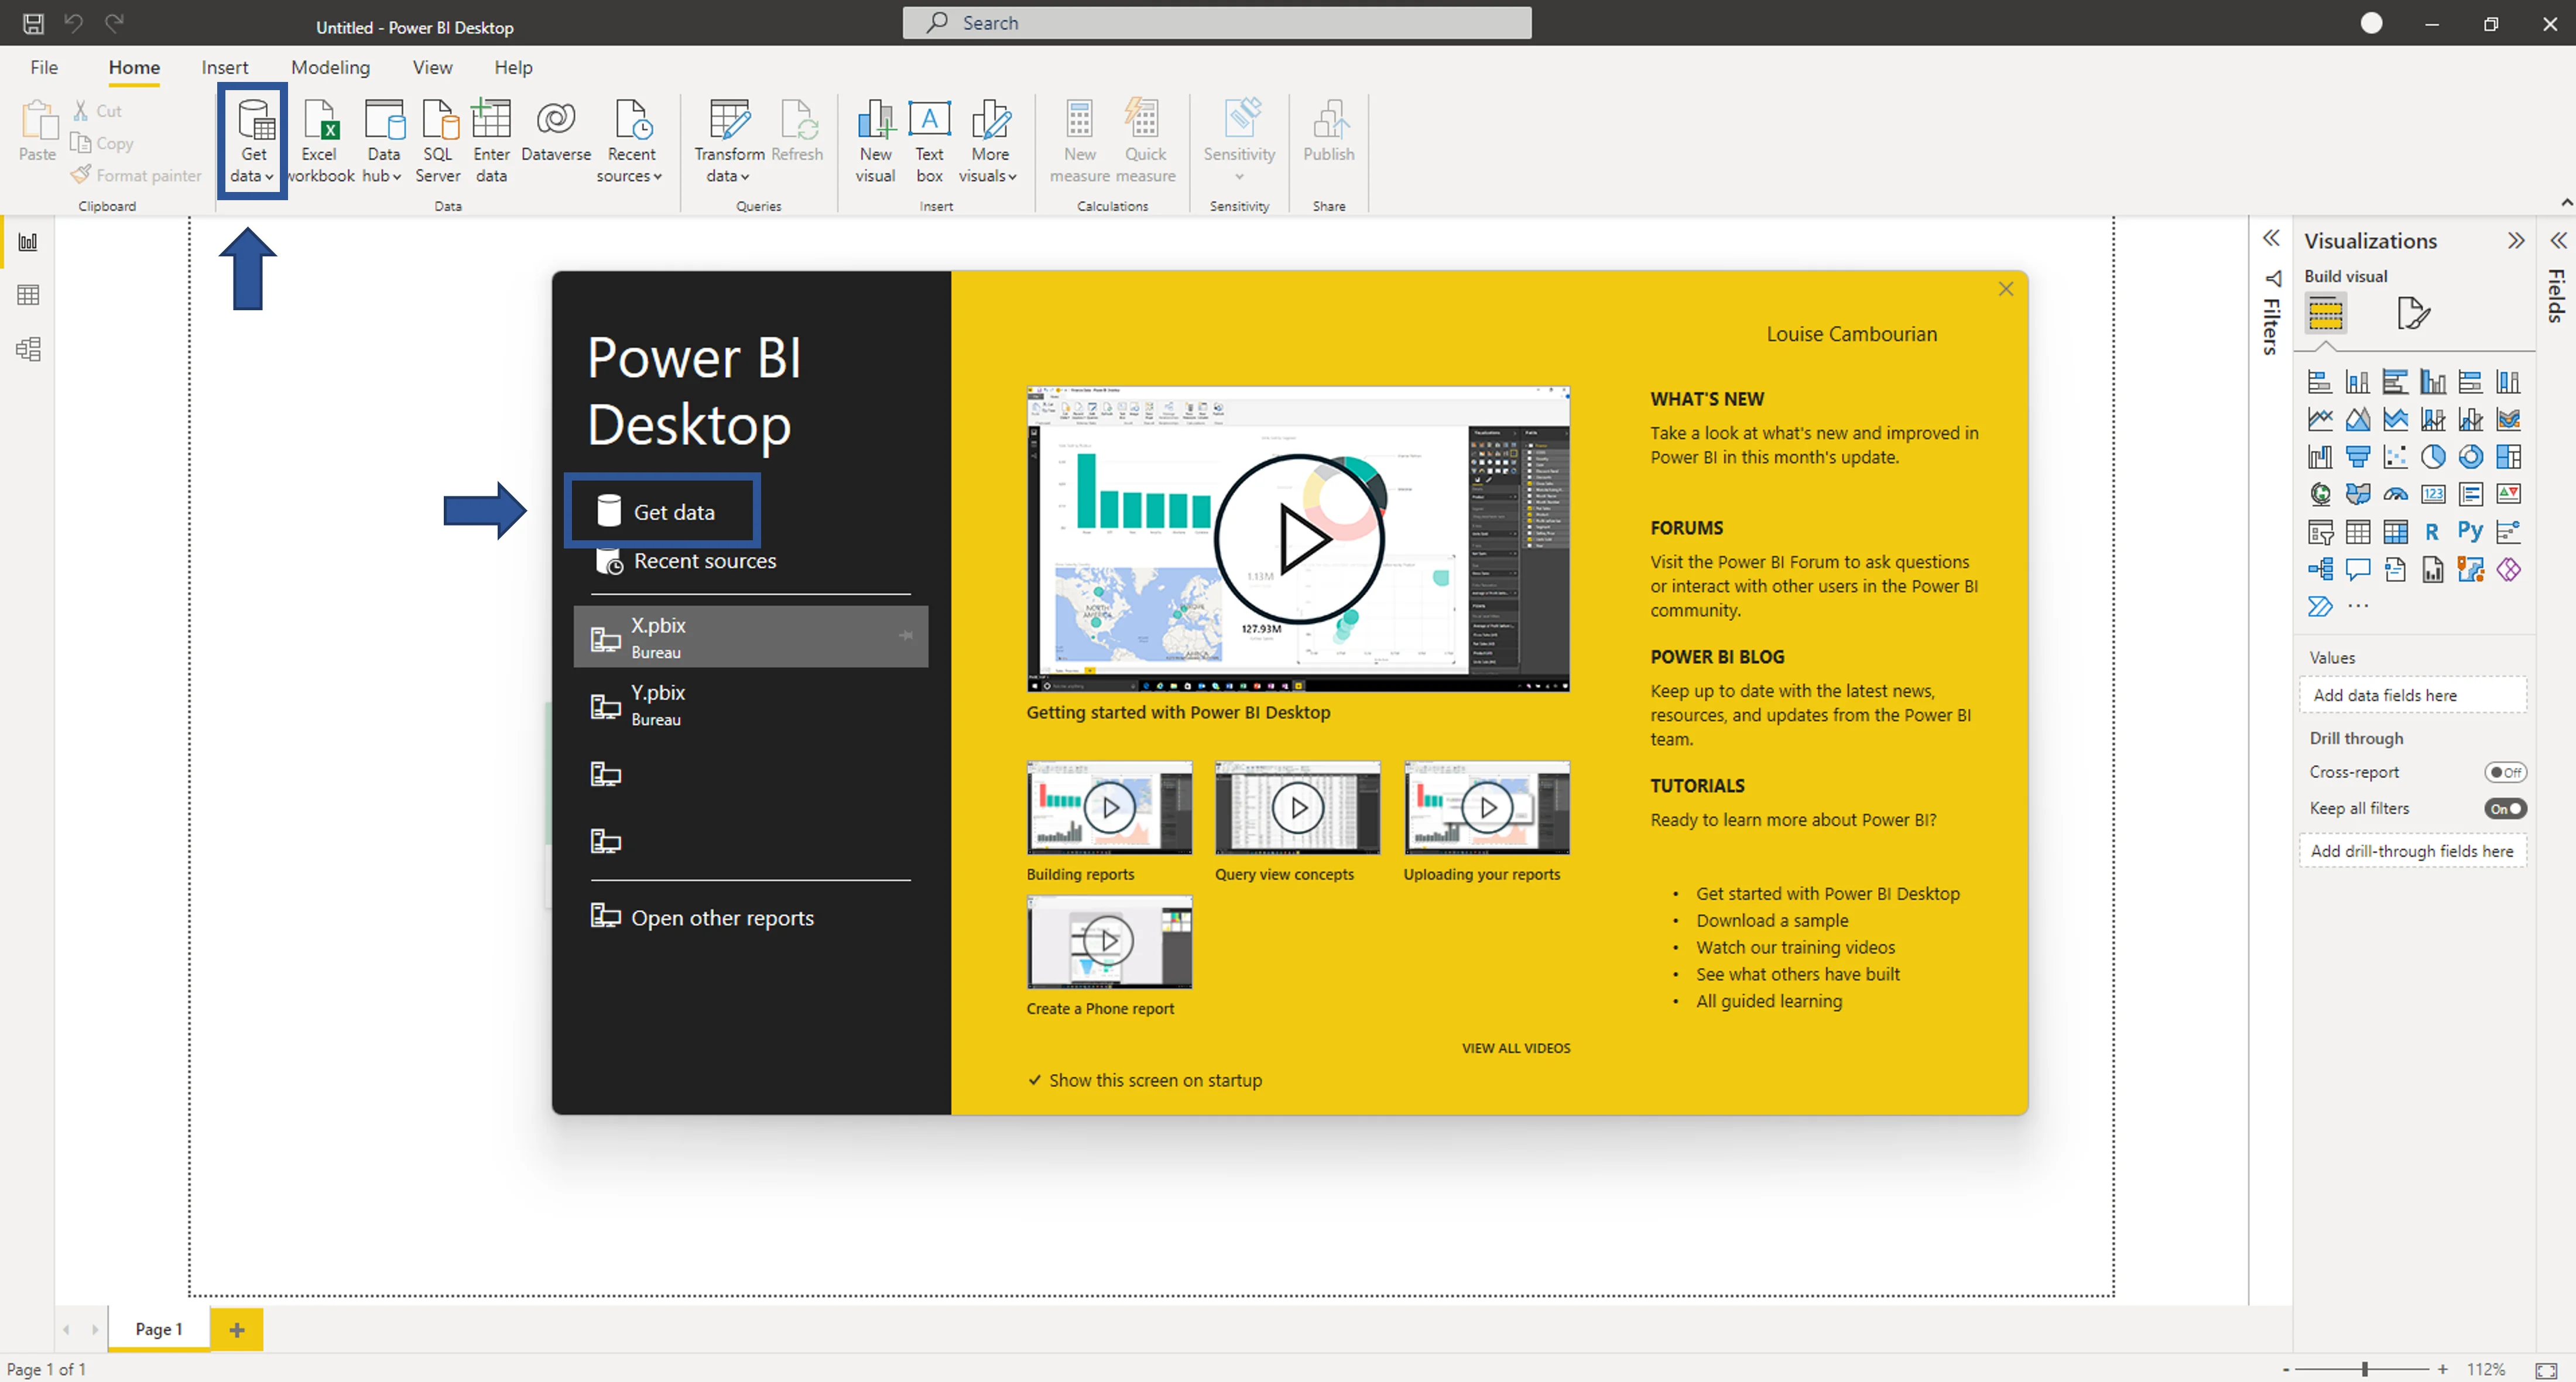
Open Power BI Desktop.
-
Click on Get data either in the welcome window or in the home menu.
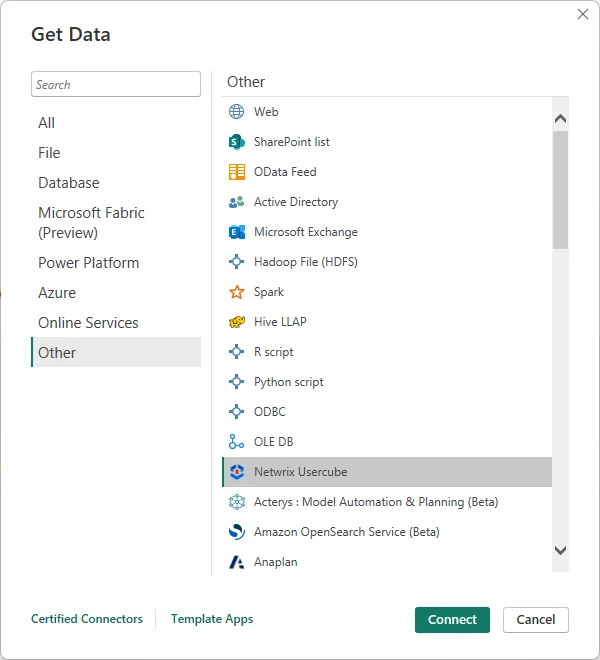
-
In the opening window, search for Usercube, click on its plugin in the right menu, and click on Connect.
-
Enter Usercube's server URL in the opening window.

-
In the opening window, enter the OpenIdClient of the
Administratorprofile. TheClient Idexpects the concatenation of the identifier ofOpenIdClientwith@and Usercube's domain name. See the following example.
-
You can now access in the left panel the universes from Usercube configuration. You can click on the desired universe to expand it, and view and pick the desired tables.

Power BI tip: to view a table, click on its name. To select a table, check the box next to the table's name.
-
Once you've selected all the tables you need, click on Load to import data to the Power BI report. You can also click on Transform data to open the query editor and make other changes in your tables, rows and columns.
Clear the Cache
Remember to clear the cache in Power BI to ensure that all changes are considered.
Clear the cache by proceeding as follows:
-
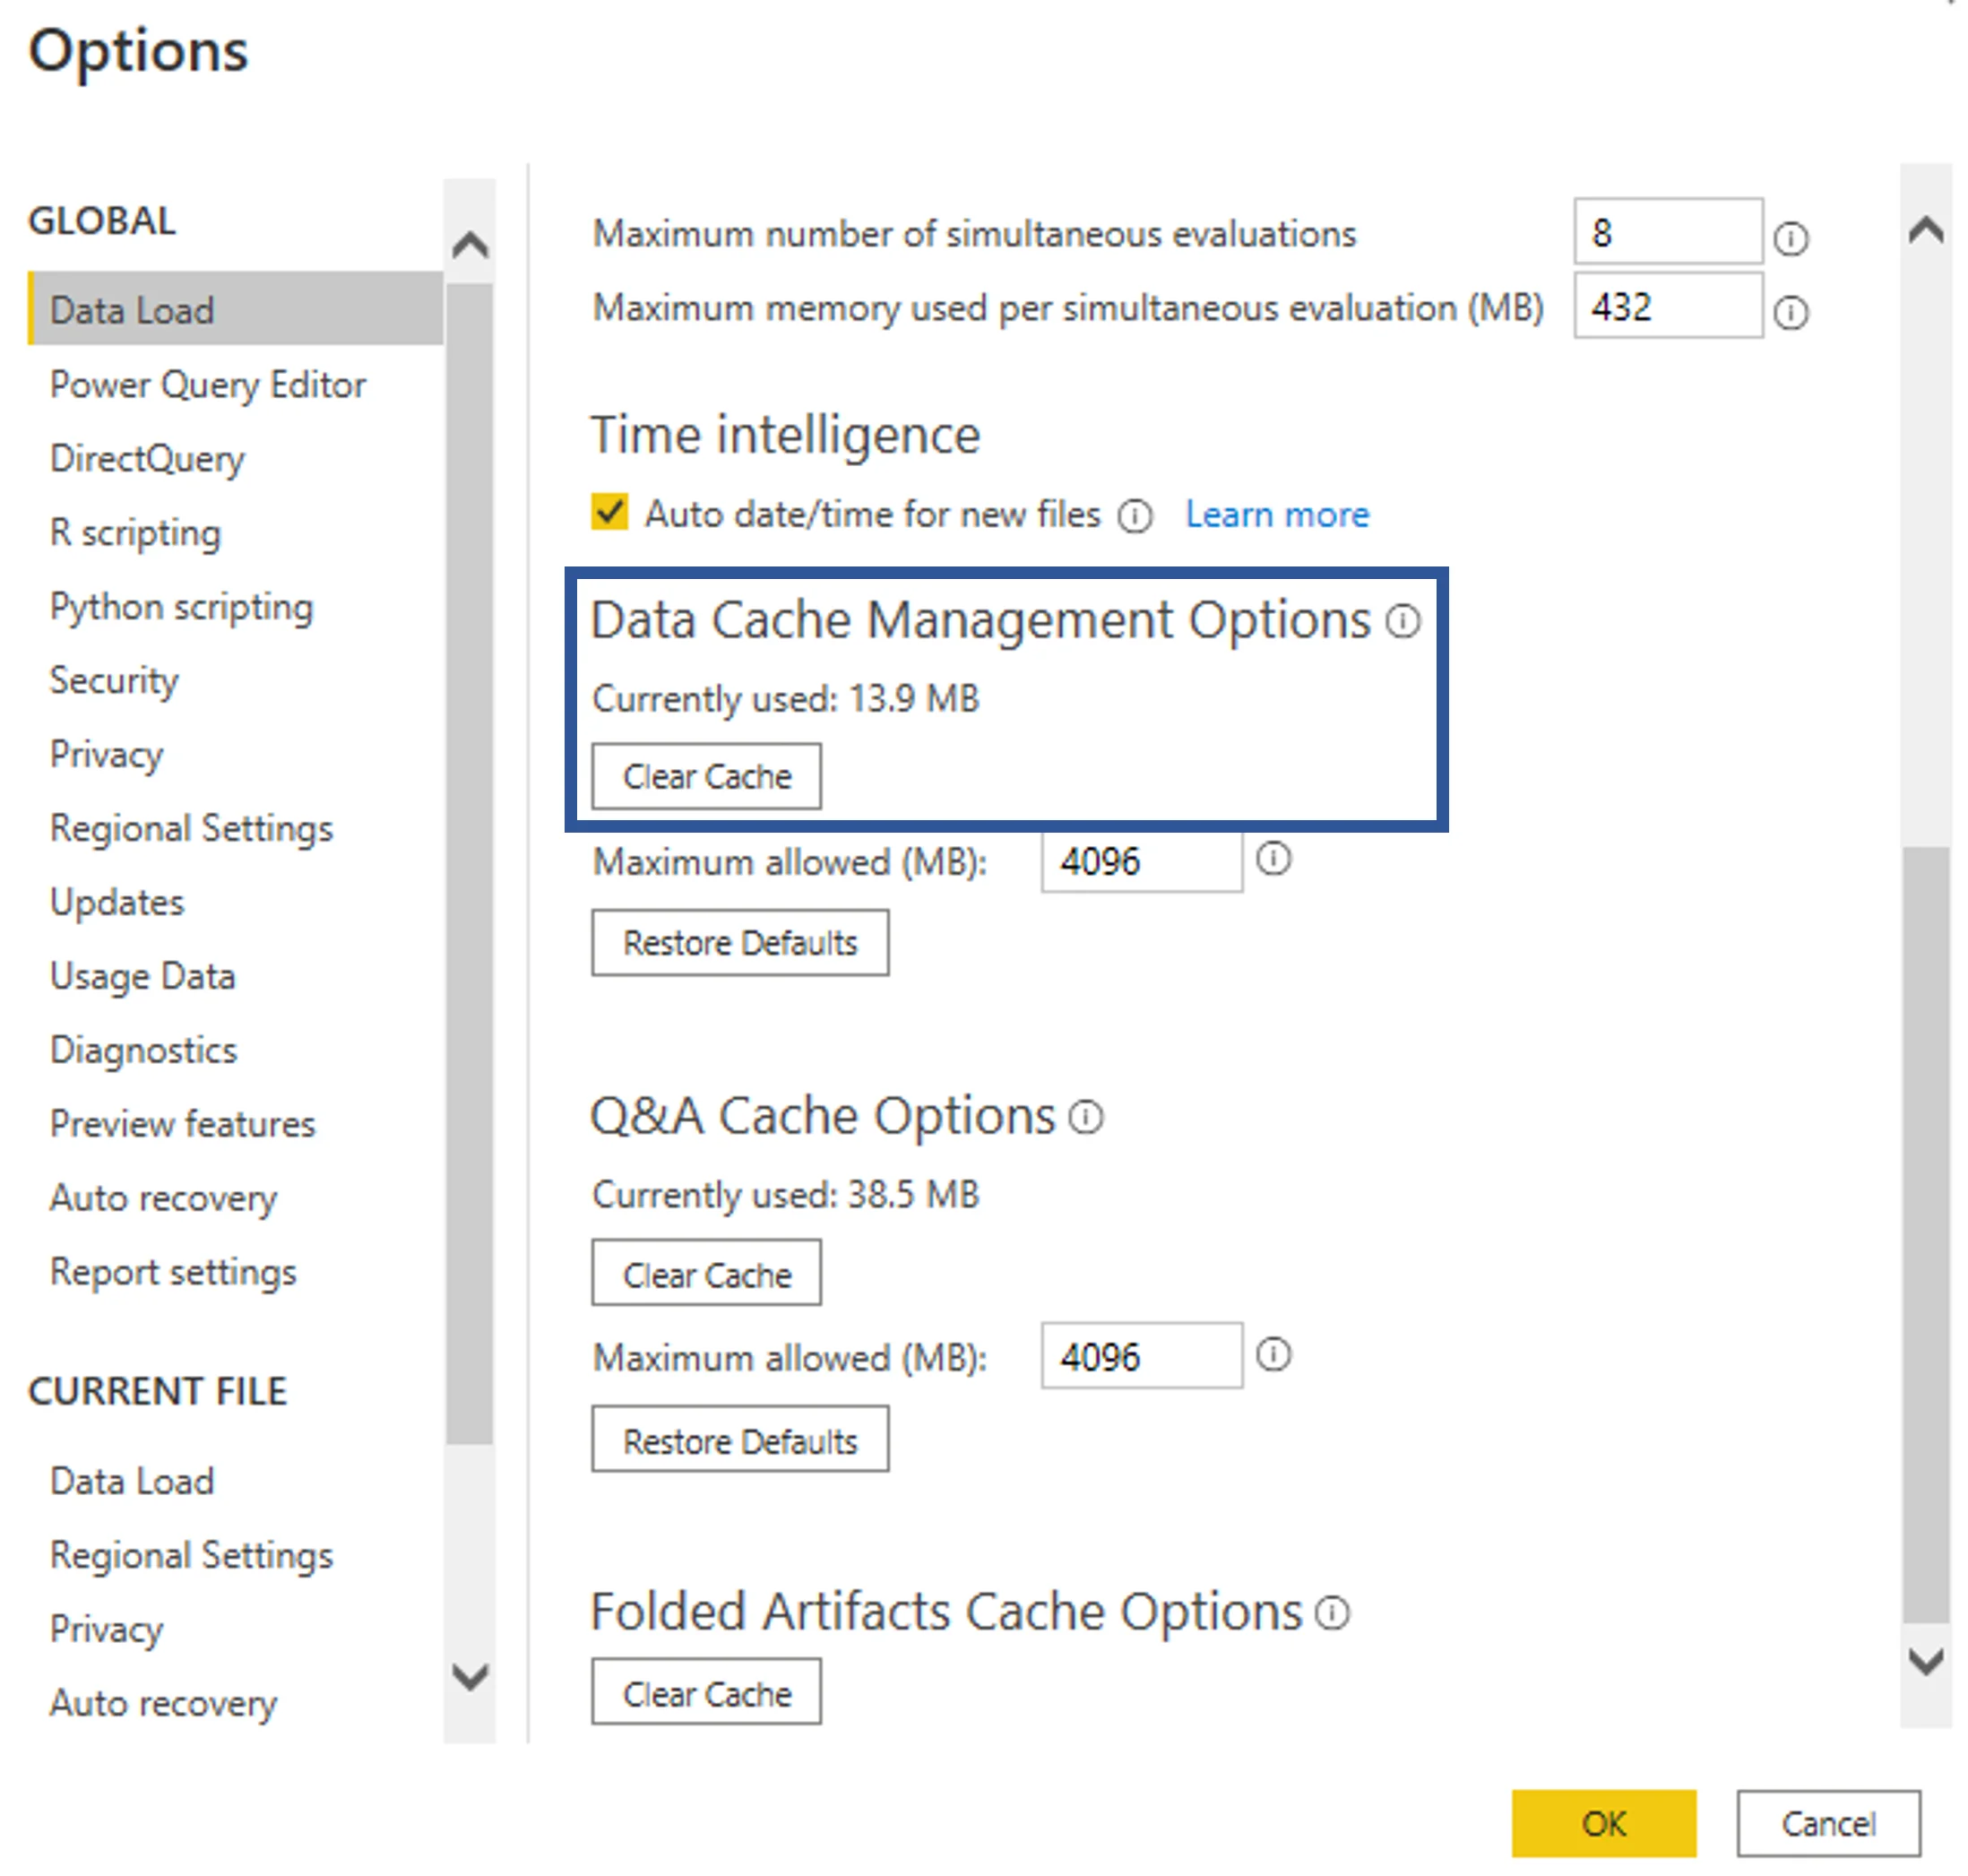
In Power BI, click on File > Options and settings > Options.
-
In the Data Load tab, click on Clear Cache.
How-Tos
These guides will help you perform reporting with practical step-by-step procedures.
-
Connect Power BI to Usercube
-
Analyze Usercube's Data with Power BI
Prepare Usercube's data and use it in Power BI, with the final goal to generate user-friendly reports.
Reporting
The Reporting module is used to generate basic reports in CSV using SQuery, or advanced reports using the Business Intelligence module.