Configuration Menu
Use the gear icon in the upper right corner of the console to open the Configuration menu.

It contains links to the component configuration and settings interfaces:
- Threat Detection – Provides an interface to configure threat monitoring. See the Threat Detection Page topic for additional information.
- Threat Response – Provides the ability to designate playbooks, which contain actions that can be executed in response to detected threats. See the Threat Response Page topic for additional information.
- Integrations – Allows you to configure integrations with a variety of Netwrix products and third-party systems and applications. See the Integrations Interface topic for additional information.
- Policies – Provides a single location to manage a variety of policy object types that define how processes and operations in Threat Manager function. See the Policies Page topic for additional information.
- System Health – Displays the total number of events for all threat types and a summary for each job. See the System Health Interface topic for additional information.
- System Settings – Provides access to system logs, user access controls, licensing, and more. See the System Settings Interface topic for additional information.
Home Page
The Home page provides an "at a glance" overview of the possible threats detected in an organization's environment for the past 24 hours.
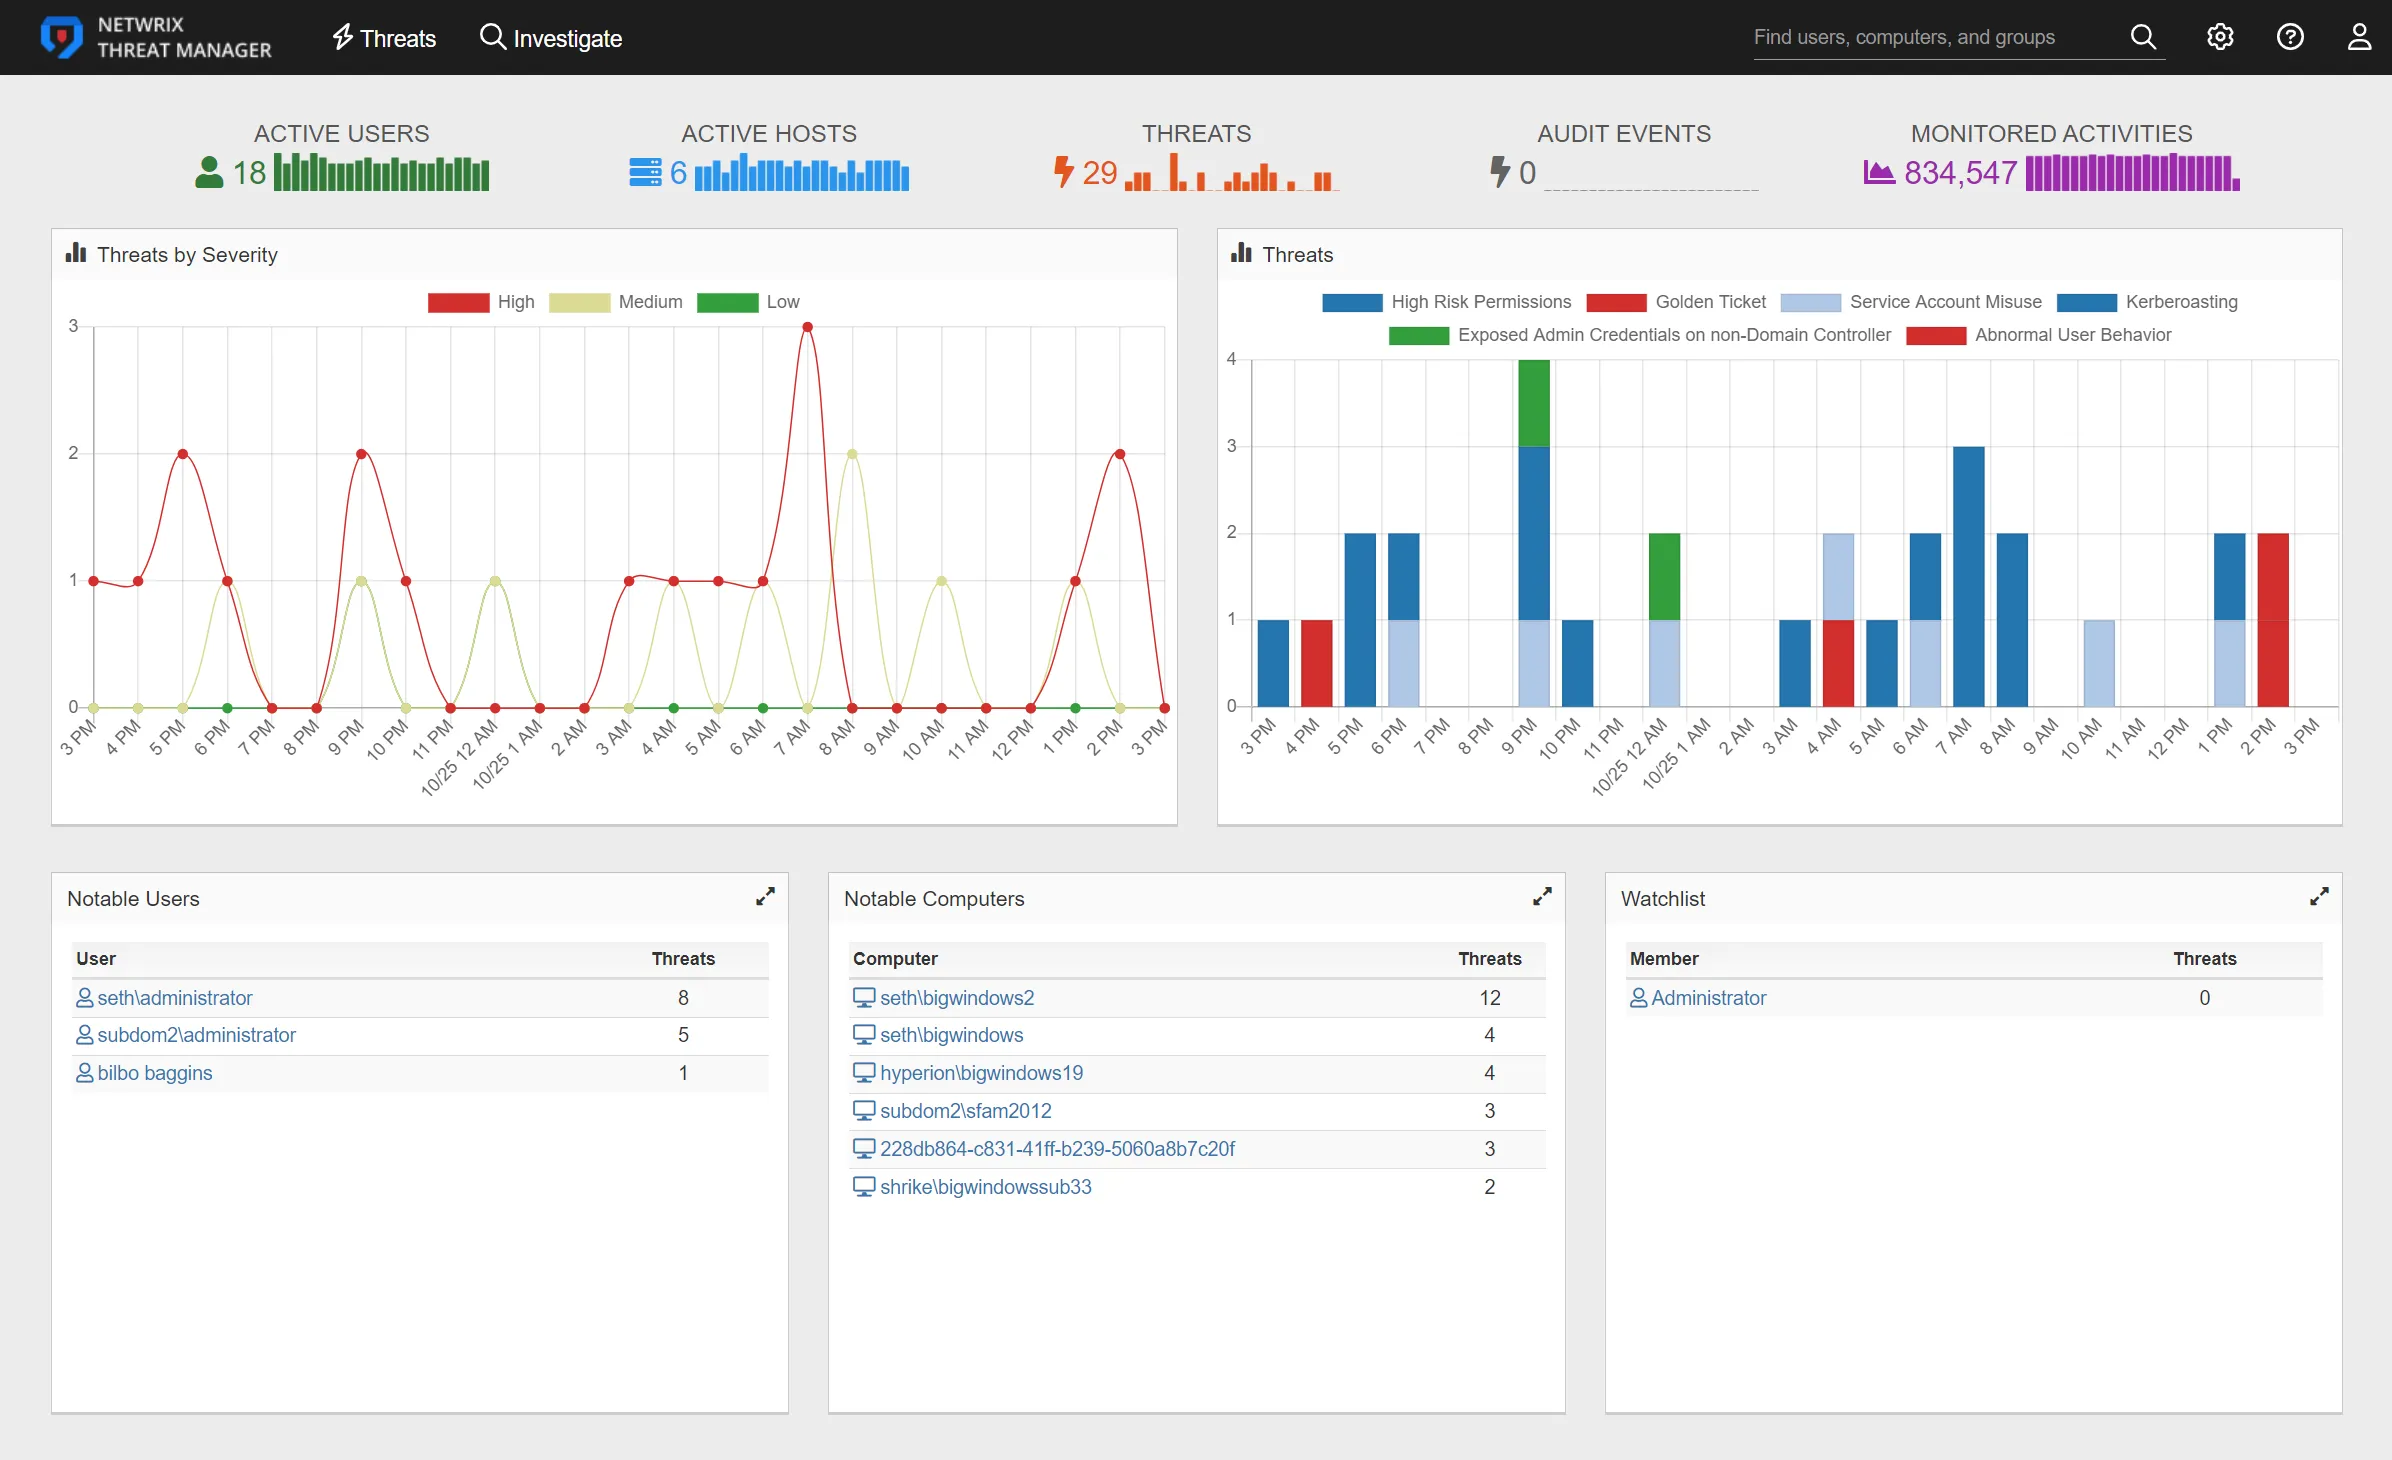
The daily activity summary bar graphs at the top of the page contains the following items:
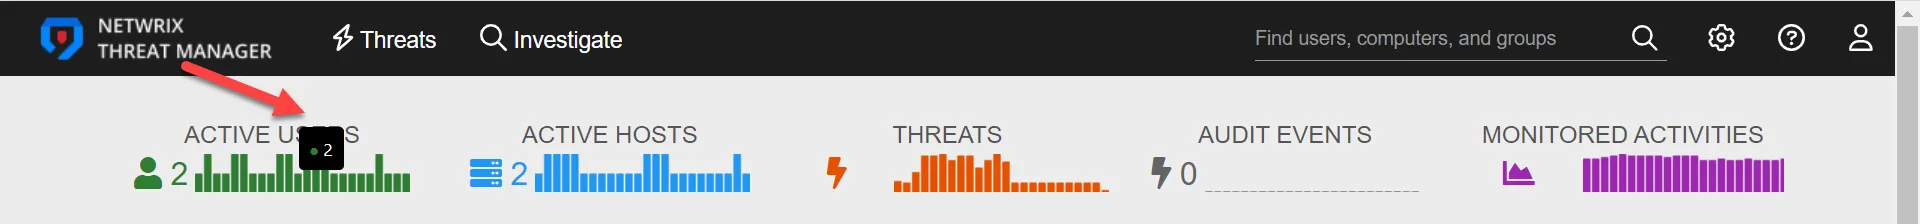
- Active Users – Number of unique active users. The bar graph displays the number of active users in 1-hour increments.
- Active Hosts – Number of active hosts. The bar graph displays the number of active users in 1-hour increments.
- Threats – Number of threats detected in the past 24 hours. The bar graph displays the threats detected over the past 24 in 1-hour increments.
- Audit Events – Number of instances of activity that are not necessarily threats, but should be monitored
- Monitored Activities – Number of monitored activities. The bar graph displays the number of monitored activities in 1-hour increments.
Hover over the trend lines in the bar graphs to view the number of threats that occurred during each time interval and identify any spikes in activity.
Home Page Charts
The Threats by Severity chart displays all threats by threat level to give a visual representation of threat severity for the past 24 hours.
The Threats chart displays each threat type detected in the past 24 hours. Each bar on the Threats chart filters the threats by an hour-long time frame. The bars are hyperlinks that can be clicked to display the Threats page. The Threats page shows the threats detected for the selected time frame.
Home Page Tables
The Home page displays the following tables:
- Notable Users – The Notable Users table displays users that are perpetrators of a threat. Click on the user to go the User Details page for that user.
- Notable Computers – The Notable Computers table displays computers where threatening activity has occurred. Click on the computer to go to the Computer Details page.
- Watchlist – The Watchlist table displays users with the Watchlist tag and a count of any associated threats
Administration
The navigation header contains the following links on the top left side of the page:
![]()
- Threat Manager – Opens the Home page for the Threat Manager Console
- Threats – Opens the Threats Page
- Investigate – Opens the Investigations Interface
NOTE: For mobile users, only the icons are displayed for the Threats and Investigate links.
The header bar contains the following links on the top right side of the page:
![]()
- Search – Enter a user, computer, or group and click the Search icon
- Configuration Menu – Displays a menu with the configuration pages
- Help – Accesses help
- Logout – Click the person icon and select Logout from the drop-down list to log out of the Threat Manager Console. The drop-down list also displays the user logged in.
A magenta alert banner will display below the navigation header if one of the following scenarios occurs:
![]()
- Service outage
- Agent outage
- License missing or expired
This banner contains a link to the page relevant to the issue.
Home Page
The Threat Manager Home Page provides an “at a glance” overview of the possible threats detected in an organization's environment for the past 24 hours. This is displayed with interactive graphs and a rollup count that will allow easy tracking and response capabilities for new threats, and users with risky activity.
Threats Page
The Threat Manager Threats Page is where end users and analysts investigate possible threats in their environment. This page displays a historical timeline of the detected threats and advanced filtering that allows users to find threats with ease. An end user can drill down into threats and view additional details. Threats have a response workflow that enables teams to assign a user to evaluate the threat, set status updates on the threat, and add any desired comments to the threat.
Investigate Page
The Threat Manager allows customers to investigate all data previously sent to Threat Manager through a series of customizable filters designed to discover threats unique to their organization. These investigations can be saved so they can be run ad hoc at a later time. Investigations can also be "saved as a threat" which enables investigation criteria to function as a threat detection mechanism that will be monitored by Threat Manager like out-of-the-box threats.
Interactive Chart Elements
The threat types listed for bar charts are interactive.
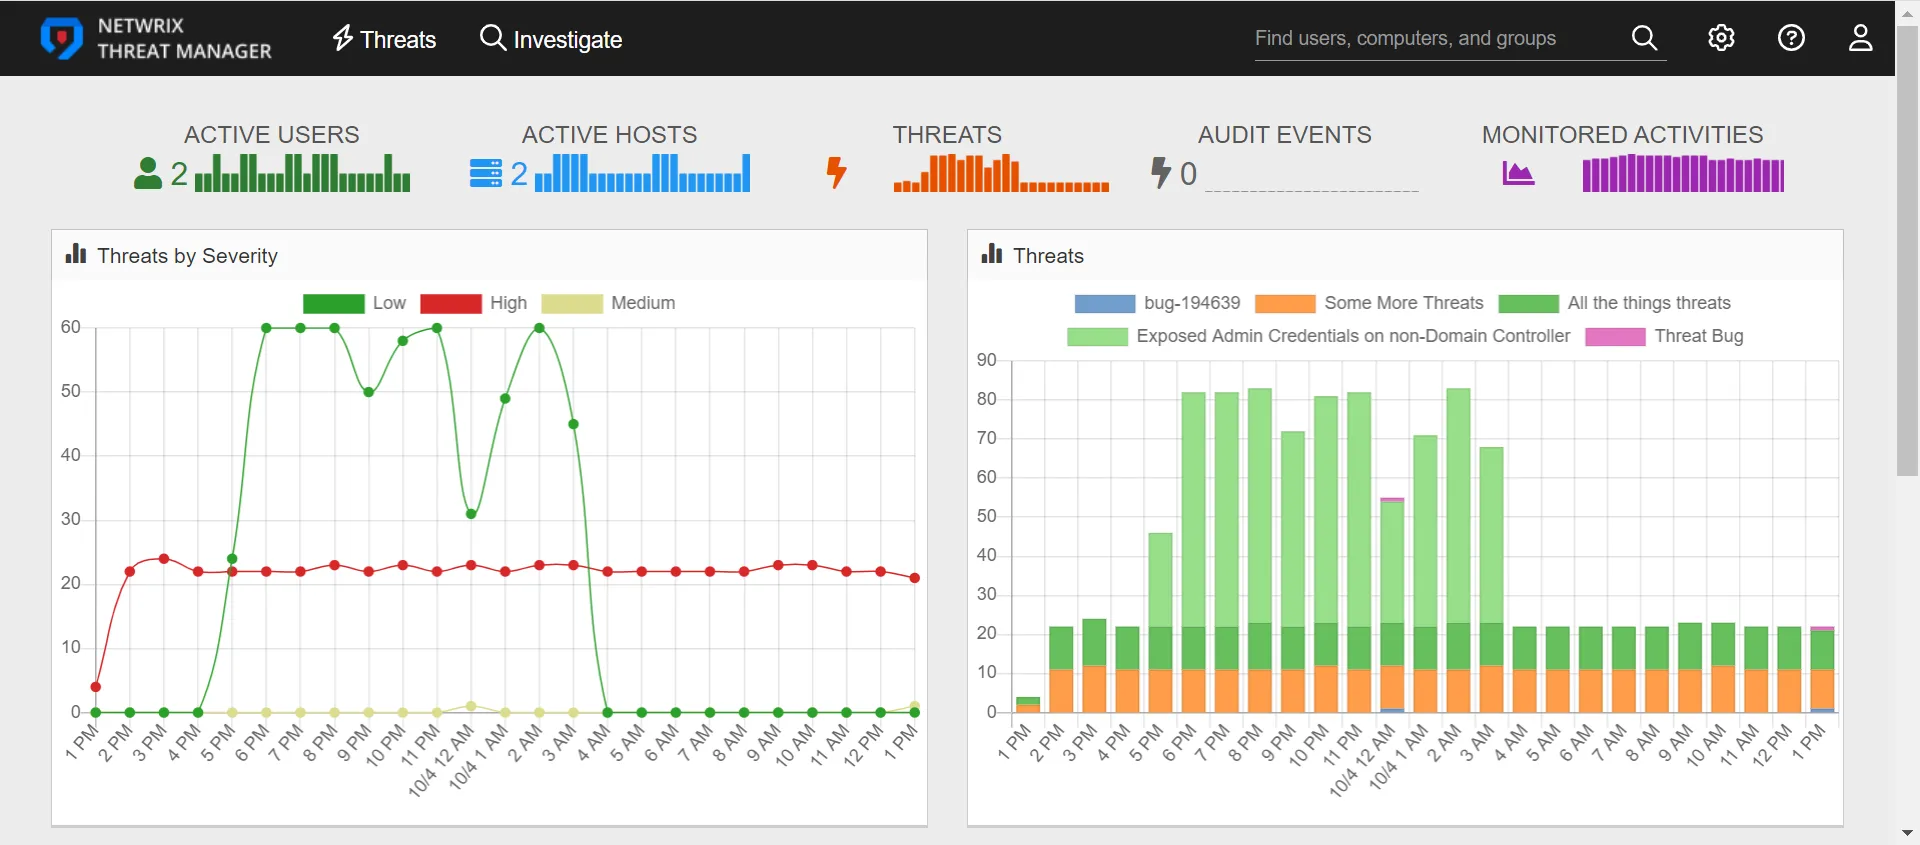
Click a threat to exclude it from the chart. The threat will have a black line through it to show that it has been excluded. Click the threat again to add it to the chart.
Hover over a trend line to see the number of threats detected in the selected time increment.
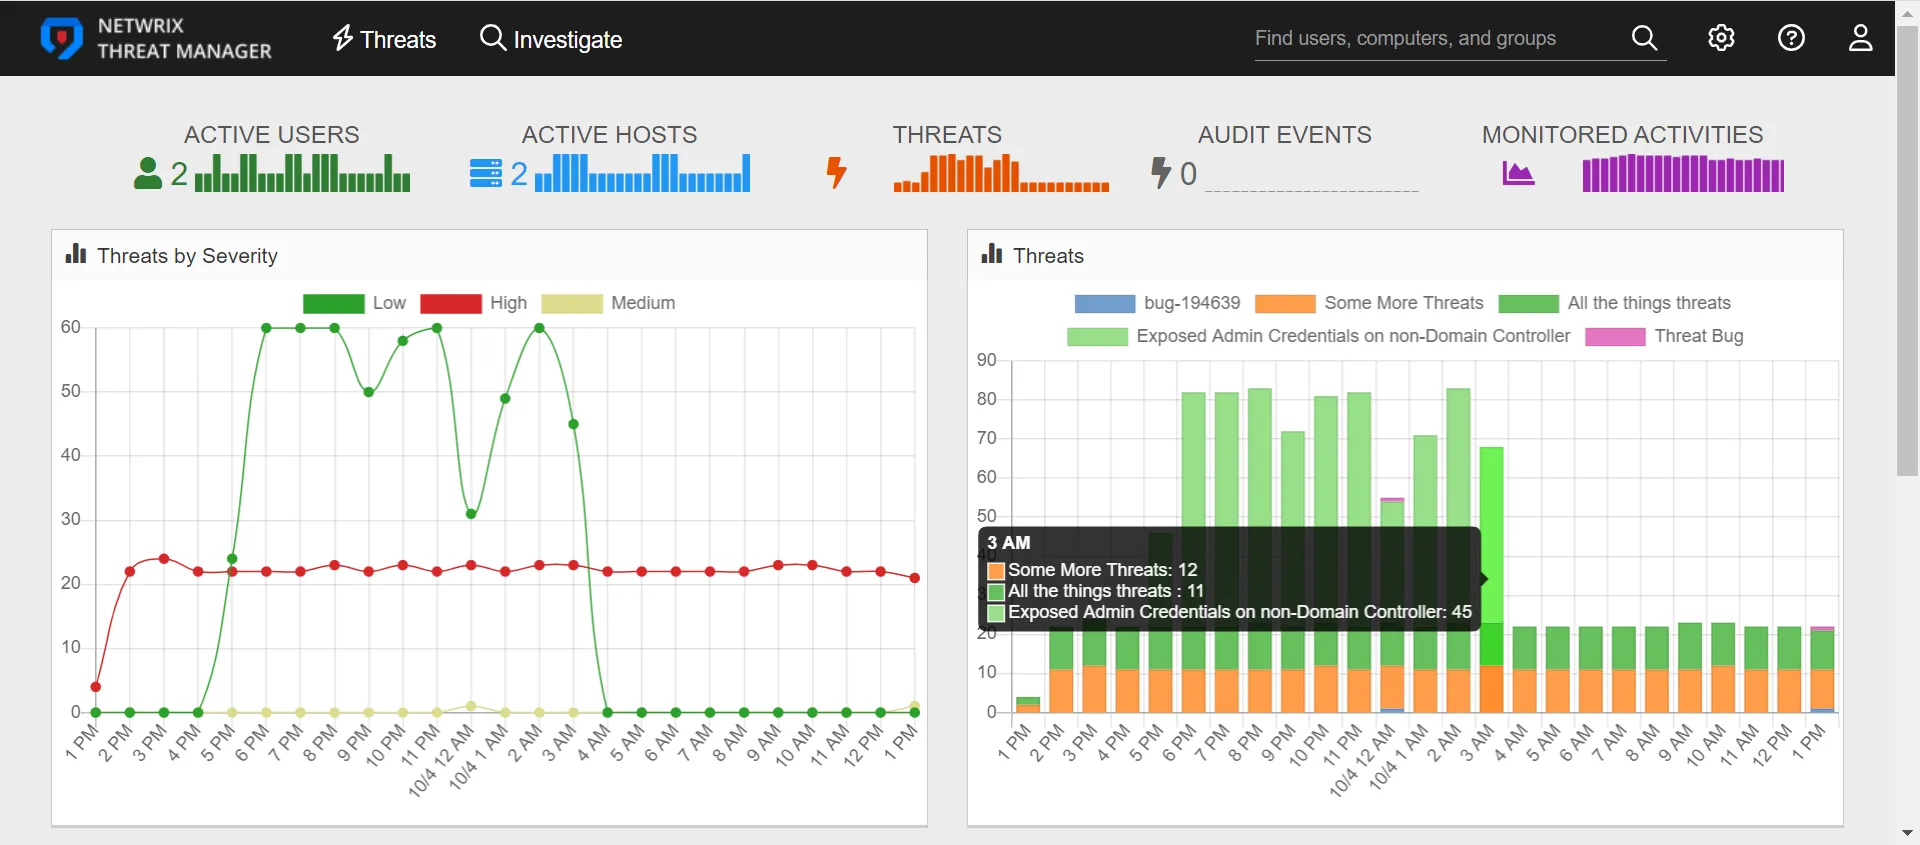
Hover over a bar graph to view the number of each type of threat created in the time frame. Hover over slices in a pie chart to view the number of threats for each threat type.
Preview Windows
Anywhere in the Console where a link to a user, group, or host details page is displayed, hover over the link to display a preview window.
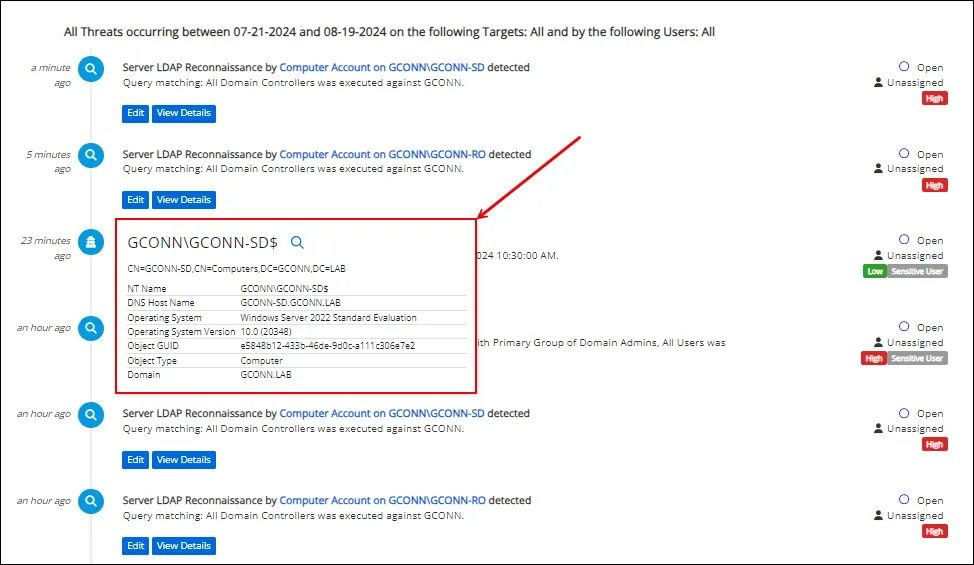
Preview windows display cards that provide information about the selected object without having to navigate off of the current page. These cards provide information about users, groups, and hosts, including any associated tags.
Data Grids
Data grids provide the ability to search for data and also to configure the presentation of data.
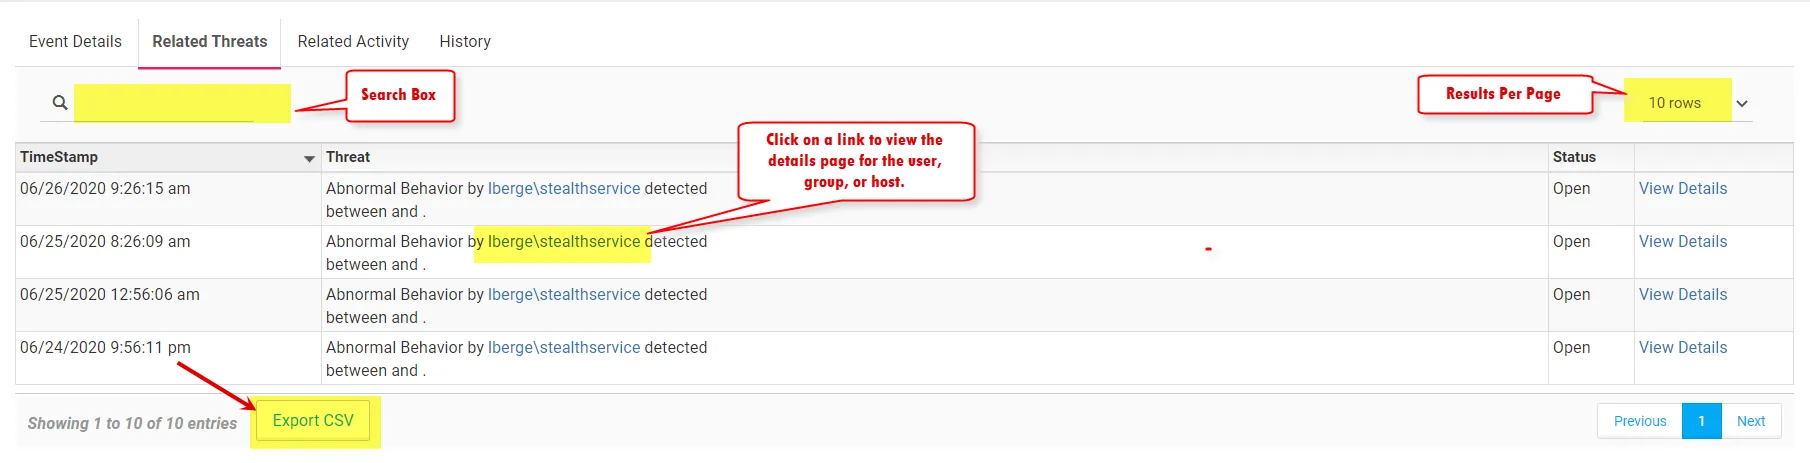
The top bar in a data grid contains the following options:
- Search Box – Enter text in the search box to filter data in the table
- Results Per Page – Click the drop-down list to select the number of results displayed per page.
Options include:
- 10 rows
- 50 rows
- 100 rows
- 1000 rows – Displays up to 1000 rows
- Links – Click a link view the user, group, or host details page
- Export CSV – Click this button to export the current rows displayed on the page into a CSV file
- Export All – Some tables contain an Export All button. Click the button to export all returned data into a CSV file
The data grids will display multiple authentication events that occur in quick succession in a single row. This means that if a user has multiple similar authentication events that occur within a minute, the data grids will display a single row in the table for those events.
If a data grid displays File System events that contain sensitive data, a Sensitive Data tag will be displayed in the Description field. The Sensitive Data tag is the only tag that will be displayed in the Description field.