Favorites Page
The Favorites page in the Investigations interface lists all saved investigations the logged in user has identified as a favorite.
Click Investigate in the application header bar to open the Investigations interface. Then click Favorites in the navigation pane.
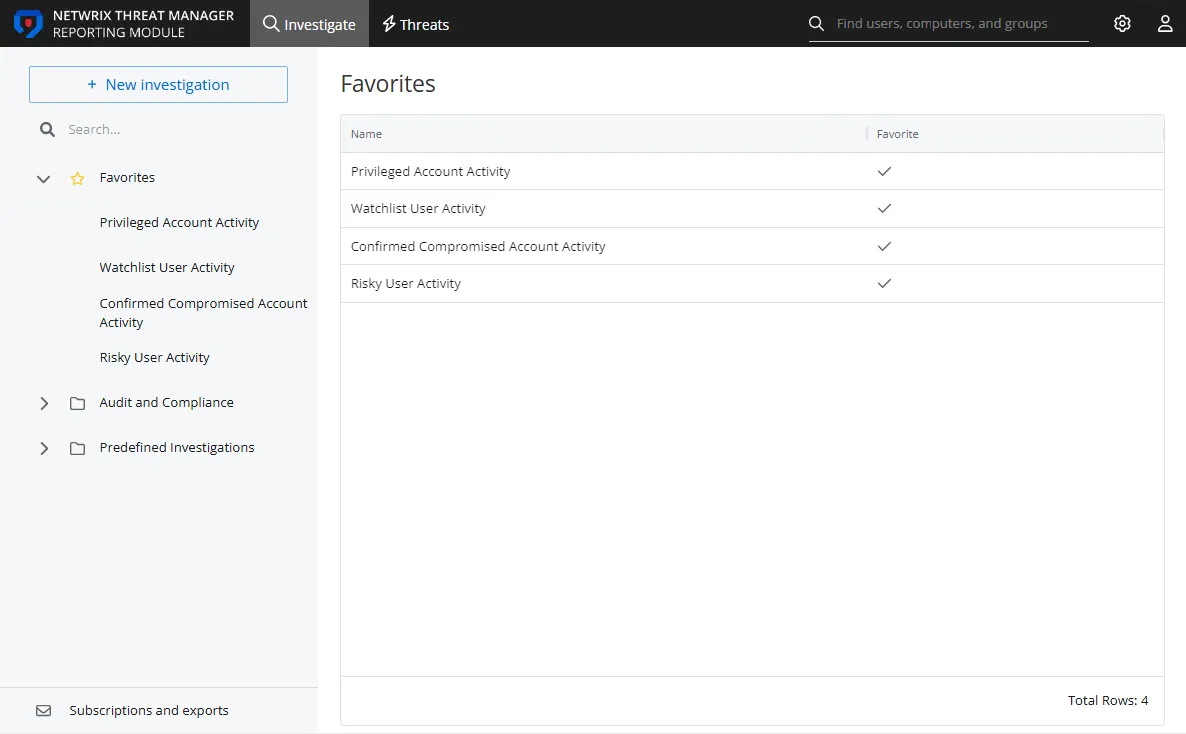
The table displays the list of favorite investigations with the following columns:
- Name – The name of the investigation
- Threat – The check mark indicates that a Threat has been configured for this investigation
- Favorite – The check mark indicates that the investigation has been tagged as a favorite for the logged in user
This provides quick access to regularly used investigations. If you click the investigation under Favorites in the navigation pane, it directly opens the investigation. If you click the investigation in the Favorites table, you are navigated to the folder location in the navigation pane. Click the investigation there to open it.
Add a Favorite Investigation
There is an empty star icon beside the name of an investigation not identified as a favorite.

Click the star to add the investigation to your Favorites list.
Remove an Investigation from Your Favorites
There is a yellow star icon beside the name of an investigation identified as a favorite.
Click the yellow star to remove the investigation from your Favorites list.
My Investigations Page
The My Investigations page in the Investigations interface provides a list of saved investigations created by the application users.
Click Investigate in the application header bar to open the Investigations interface.
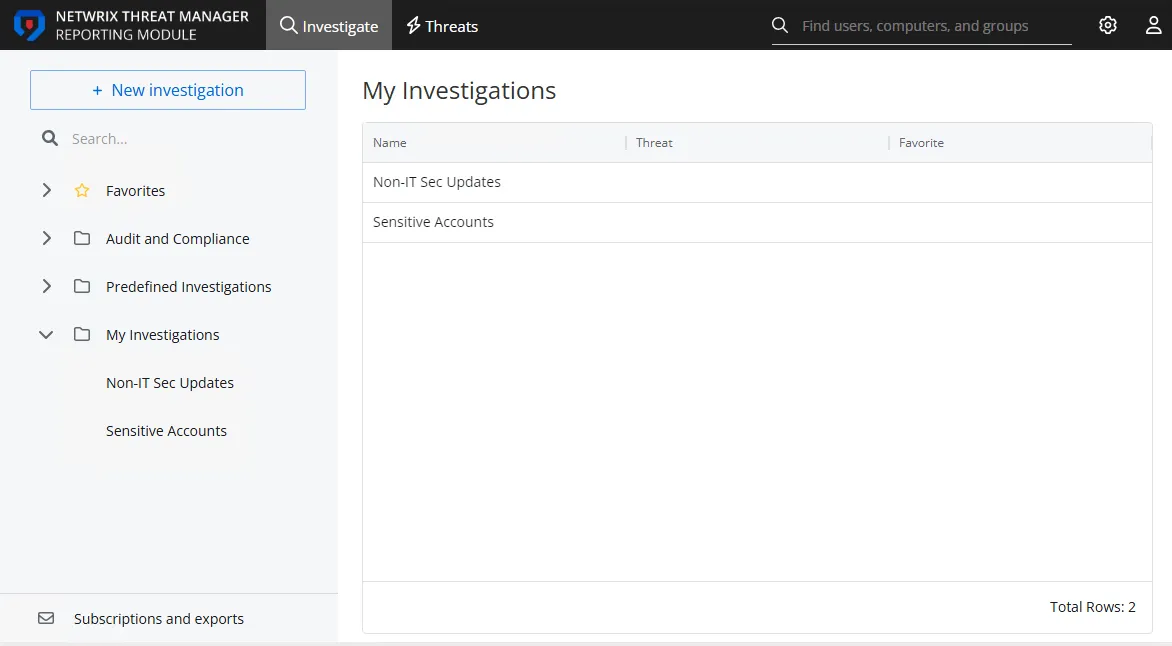
The table displays the list of investigations with the following columns:
- Name – The name of the investigation
- Threat – The check mark indicates that a Threat has been configured for this investigation
- Favorite – The check mark indicates that the investigation has been tagged as a favorite for the logged in user
Click an investigation to view it. You can run the query, modify the configuration, add a subscription, or export the report. See the Investigation Options topic for additional information on saved investigation options.
Every report generated by an investigation query displays the same type of information. See the Investigation Reports topic for additional information.
Edit or Duplicate an Investigation
An investigation can be edited and even duplicated.
Edit an Investigation
Follow the steps to edit an investigation.
Step 1 – Click Investigate in the application header bar to open the Investigations interface. Then click a folder in the navigation pane to access a saved investigation. An investigation is located in the folder where it was saved.
Step 2 – Modify the filter criteria of the investigation as desired.
Step 3 – Click the Edit option.

Step 4 – The Edit option opens the Save Investigation window in edit mode. You can modify the name, description, and folder of the saved investigation. If you save the investigation to a different folder, it will be moved from the original location to the new folder. You can also update the user roles granted ownership and access to the investigation report.
Step 5 – Click Save. The Save Investigation window closes.
The investigation is saved with the modified settings.
Duplicate an Investigation
Follow the steps to duplicate an investigation.
Step 1 – Click Investigate in the application header bar to open the Investigations interface. Then click a folder in the navigation pane to access a saved investigation. An investigation is located in the folder where it was saved.
Step 2 – Click the three dots at the top and select Open as new. The Open as New option opens the investigation in Duplicate mode. The filter is the same as that of the base investigation. You can save it as a new investigation.
Step 3 – Modify the investigation filter statement and click Save. The Save Investigation window is displayed.

The Name box displays the investigation name with the word "copy" appended to it.
Step 4 – You can modify the following:
- Name – The name of the investigation
- Description – An optional description of the investigation
- Folder – The folder in the navigation pane where the investigation is saved
Step 5 – Select a user role from the Owner drop-down menu. All users assigned this role would own this investigation and they will be able to modify the report.
Step 6 – In the Access box, type to search the role you want to give access of this investigation. A list of user roles matching the search string is displayed. Select a single or multiple user roles. All users belonging to the selected role(s) can view the report.
Step 7 – Click Save. The Save Investigation window closes.
The duplicated investigation is saved to the selected folder, and the folder expands in the navigation pane to display the saved item. You can access the investigation from the navigation pane.
Export Report
An export puts the report results for an investigation into a desired format. The Export option provides choices for how you can export the report results for an investigation. The report can be exported in a specified format and can be downloaded, emailed, or scheduled as desired.

After running an investigation query, click Export. Then select one of the following from the drop-down menu:
-
Export as CSV – Generates and downloads the report as a CSV file to your Downloads folder
-
Export as PDF – Generates and downloads the report as a PDF file to your Downloads folder
-
Export as JSON – Generates and downloads the report as a JSON file to your Downloads folder
-
Send as Email – Opens the Send as Email window to send the report to recipients
NOTE: This option requires an email server to be configured.
-
Schedule Export – Opens the Schedule export window to save a copy of the report to a shared folder
NOTE: This option requires a shared folder to be configured.
Reports will be downloaded to the Downloads folder on your local machine, according to your browser settings. You can configure a folder on the application server to place copies of all exported reports.
See the Folder Settings Page topic for additional information.
Send as Email
NOTE: This option requires an email server to be configured. If this requirement is not met, a message will appear in the window. See theEmail Page section for additional information.
You can send the report data of an investigation as an attachment to an email. The attachment can be any of the file formats available for download. Follow the steps to send a report as an email attachment.
Step 1 – Click Investigate in the application header bar to open the Investigations interface. Then click a folder in the navigation pane to access a saved investigation. An investigation is located in the folder where it was saved.
Step 2 – After running a query and confirming the report data is displayed in the report sections, click the Export menu and select Send as Email. The Send as Email window opens.

Step 3 – Begin typing in the Recipients textbox. You can enter a user name or email address. Available email addresses read from Active Directory that match the text string will populate in the drop-down menu. Select a recipient.
Step 4 – Repeat Step 3 to add additional recipients.
Step 5 – Modify the subject line as desired in the Email Subject box. The default subject is: Export of Report '[NAME OF INVESTIGATION]'.
Step 6 – Select the radio button for the desired file format: CSV, PDF, or JSON.
Step 7 – Click Send. The Send as Email window closes.
The recipients will receive the report as an attachment to an email.
Scheduled Export
NOTE: This option requires a shared folder to be configured.If this requirement is not met, a message will appear in the window. See the Folder Settings Page section for additional information.
You can schedule to save the report data of an investigation to a shared folder. The file format can be any of the formats available for download. Follow the steps to schedule a report export.
Step 1 – Click Investigate in the application header bar to open the Investigations interface. Then click a folder in the navigation pane to access a saved investigation. An investigation is located in the folder where it was saved.
Step 2 – After running a query and confirming the report data is displayed in the report sections, click the Export menu and select Scheduled export. The Schedule export window opens.
The name of the respective investigation is displayed as a link. Click it to view the filter defined for the investigation.
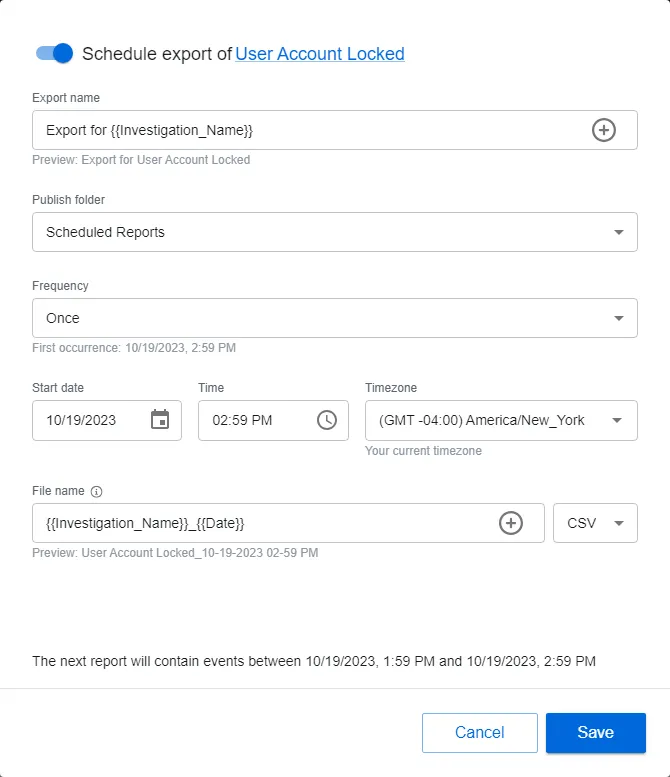
Step 3 – By default the schedule is enabled. You can disable it with the toggle button by the window name.
Step 4 – Modify the text in the Export name field as desired. The default name is: Export for
{{Investigation_Name}}. This variable will be replaced with the name of the investigation. The +
button opens a variable menu for the field.
Step 5 – Select a shared folder from the Publish folder drop-down menu. Only folders configured on the Folder Settings page of the Integrations interface will be listed here.
Step 6 – Set a frequency. Options in the Frequency drop-down menu are: Once, Daily, Weekly, and Monthly. Ensure the frequency does not exceed the "Time to Retain" settings for the System Jobs configured in the System Settings interface.
Step 7 – Set the start date, time, and timezone for the selected frequency:
- Start date – This field opens a calender. You can also type a date in the field.
- Time – This field opens a clock. You can also type a date in the field.
- Timezone – This field opens a drop-down menu. Select the desired timezone.
Step 8 – Set the file name in the File name field. The default name
is: {{Investigation_Name}}_{{Date}}. This variable will be replaced with the name of the
investigation. The + button opens a variable menu for the field.
Step 9 – Select the file format for the export from the drop-down menu: CSV, PDF, JSON, Excel Viewing.
Step 10 – Click Save. The Schedule export window closes.
The scheduled export is listed on the Subscriptions and Exports page of the Investigations interface.
See the Subscriptions and Exports Page topic for additional information.
Filters Section
The Filters section provides options to build a filter statement by selecting the Attribute, Operator, and Filter value. A time period for the report data is also configured here. If multiple data sources have been configured, there is also a Source drop-down menu. Filter statements can be simple with one value statement or complex with multiple value statements.

The section has the following options for configuring a filter statement:
- Source – This menu provides a list of all integrations with the application. If there is only one data source configured, the Source menudisplays that only. See the Netwrix Integrations Page topic for additional information.
- Timeframe – This menu provides several timeframe options as well as a clock and a calendar for setting a custom range. You must set the timeframe for the data to be returned in the report. If your report is blank, it is likely due to the timeframe setting. See the Timeframe topic for additional information.
- Attribute – This menu provides a list of attributes that are available on events in the data source. See the Filter Attribute Menu topic for additional information.
- Operator – This menu controls how the rule is evaluated by specifying the comparison between the Attribute and the Filter value. Options vary based on the selected attribute. See the Filter Operator Menu topic for additional information.
- Filter – Use it to specify the value to evaluate using the operator for the selected attribute
- Add – This appears in a new row of the Filter table, in the Attribute column. Clicking it opens the Attribute menu to add another filter statement.
- Clear All – This icon removes the respective filter statement
See the Build a Filter Statement topic for additional information.
Timeframe
You must set a timeframe for an investigation query. When you run a query, the application scans the available data for activity events that match the set filters for the specified timeframe. By default, the timeframe is set for the "Last Hour" of activity.
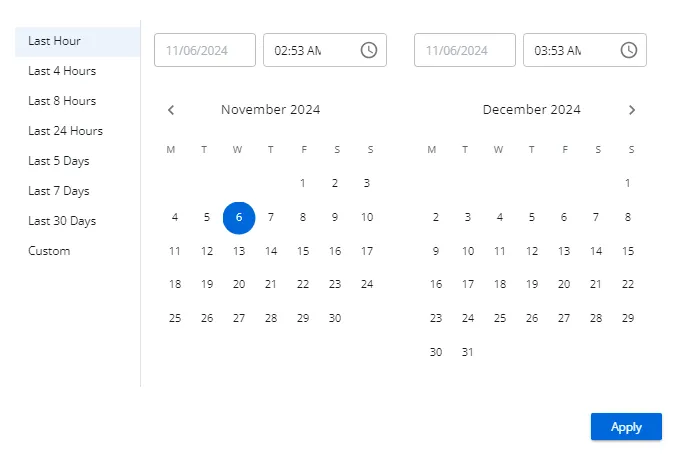
Click the displayed timeframeto open a window, which provides several timeframe options as well as a clock and a calendar for setting a custom range:
-
Preset timeframes:
- Last Hour
- Last 4 Hours
- Last 8 Hours
- Last 24 Hours
- Last 5 Days
- Last 7 Days
- Last 14 Days
- Last 30 Days
-
Custom timeframe – Specified by the start and end date and time range set in the clock / calendar section
NOTE: The timeframe property is saved with the investigation filters. However, it can be modified to run a query ad hoc with the same filter statement but a different timeframe.
Configure a Custom Timeframe Range
Follow the steps to configure a custom timeframe range.
Step 1 – On the Investigations interface, select the desired Investigation or start a new investigation.
Step 2 – Click the Timeframe displayed in the Filters section.
Step 3 – Set the start date on the left. You can either type it in the box at the top or navigate through the calendar to select the desired date.
Step 4 – Set the start time on the left. You can either type it in the box at the top or click the clock icon within the box to get a menu for selecting the hour, minute, and period (AM or PM).
Step 5 – Set the end date on the right. You can either type it in the box at the top or navigate through the calendar to select the desired date.
Step 6 – Set the end time on the right. You can either type it in the box at the top or click the clock icon within the box to get a menu for selecting the hour, minute, and period (AM or PM).
Step 7 – Click Apply.
The Timeframe window closes and the custom range is visible in the Filters section. Save the changes to the selected investigation, unless you are running an ad hoc query.
Filter Attribute Menu
The Attribute menu in the Filters section has the following options grouped by the type of attribute:

-
Event ( group header in the menu):
- Affected Object – The The name of the object in Active Directory that was affected by the event
- Attribute – The specific property or field of the object that was changed or accessed
- Attribute New Value – The new value that the attribute was changed to after the event
- Attribute Old Value – The value that the attribute had before the event occurred
- Blocked – Indicates whether the operation was prevented by a security measure, such as a Netwrix agent
- Client – The device, IP address, or host that initiated the event
- Client Type – The type of client initiating the event, such as host, IP address, or device
- Domain – The Active Directory domain where the event occurred
- Event Operation – The specific action that was attempted or performed during the event (e.g., modify, delete)
- Event Sub-Operation – Additional actions or details related to the primary event operation
- Event Type – The nature or source of the event data, indicating where or how the event originated
- Perpetrator – The user or service account that initiated the event
- Perpetrator Type – The type of account (e.g., user, service) that carried out the event
- Success – Indicates whether the action associated with the event was successfully completed
- Tag (Direct) – A label or classification directly applied to the object or event
- Tag (Effective) – A label or classification that applies to an object due to inheritance from a group or policy. For example, if a group has a tag, all its members will inherit that tag
- Target – The specific object, resource, or entity that was the focus of the event
- Target Type – The type or classification of the object, resource, or entity that was targeted
- Time of Day – The exact date and time when the event occurred
-
Active Directory (category group header in the menu):
- Affected Object Distinguished Name – The full path and name of the object in Active Directory that was affected by the event
- Certificate Thumbprint – The unique identifier of a certificate used in the event, typically represented as a hexadecimal string
- Encryption Type – The method or algorithm used to encrypt data during the event (e.g., AES, RSA)
- LDAP Query Filter – The LDAP search filter used to query the Active Directory for specific objects or attributes
- Object Class – The type or schema class of the object affected by the event (e.g., user, group)
- Perpetrator Protocol – The network protocol used by the perpetrator to perform the operation (e.g., LDAP, Kerberos)
- Pre-Authentication Type – The type of pre-authentication used before the main authentication (e.g., Kerberos, NTLM)
- Reply Encryption Type – The type of encryption used to secure the response sent back to the requester
-
Entra ID (category group header in the menu)
- Correlation Id – A unique identifier used to link related events across different services, helping to trace and analyze potential security incidents
- Entra Event Id – The specific identifier assigned to an event within Microsoft Entra ID
- Is Interactive – Indicates whether the event involved direct user interaction or if it was a non-interactive event, like an API call
- Location – The geographical location where the event originated, which can help identify unusual sign-ins
- Logged By Service – The specific Microsoft Entra service that recorded the event, providing context on which service was involved in the activity
- Risk Detail – Detailed information about the type of risk detected during the event, such as leaked credentials or suspicious sign-in patterns. This detail helps administrators understand the nature of the threat
- Risk Event Type – The category of risk identified, such as "Anonymous IP Address" or "Unfamiliar Sign-in Properties," which signals potentially compromised activity
- Risk Level Aggregated – The overall risk level assigned after evaluating all related events and signals, such as "Low" or "High"
- Risk Level During Sign-In – The risk level specifically assessed during the sign-in process, indicating how likely the sign-in was compromised
- Risk State – The current status of the detected risk, which can be "At Risk," "Dismissed," or "Remediated," depending on the actions taken
- Target Resource Type – The type of resource or service that was involved in the event, such as a specific application or database
-
File System (grayed-out category group header in the menu):
- Extension – The file extension indicating the file type (e.g., .txt, .docx)
- File Path – The The full directory path to where the file is located
- File Size – The The size of the file, typically measured in bytes
- File Tag – A label or classification applied to the file for organizational or security purposes
-
Integrations (category group header in the menu):
- Policy – The set of rules or configurations applied within the integration., which may require Netwrix Threat Preventiondatabase access to be configured on the NetwrixIntegrations page. See the Netwrix Integrations Page page for additional information
Filter Operator Menu
The options available for the Operator menu in the Filters section change to match the selected Attribute. The following is a list of all possible operator options:

- Equals
- Not Equal To
- Contains
- Does Not Contain
- Starts With
- Ends With
Build a Filter Statement
You can create a filter for a new investigation or modify a filter for a saved investigation. Follow the steps to build a filter statement.
Step 1 – Navigate to the desired investigation's Filters section.

Step 2 – If multiple data sources are configure, select a source from the Source drop-down menu.
Step 3 – Set the timeframe for the event data to be returned in the report.
Step 4 – Select an attribute from the Attribute drop-down menu.
Step 5 – Select an operator from the Operator drop-down menu.
Step 6 – Enter a value in the Filter box. Possible values available from the events will populate in a drop-down menu as you type. Select the desired value from the drop-down menu. If the value you type is not available in the drop-down menu, use the Add button to add it to the Filter box.
NOTE: Adding additional values in the same Filter box will add an OR statement for the attribute. For example:
-
When:
- Attribute = Perpetrator; Operator = Equals; Filter = nwxtech\ad.bruce.wayne, nwxtech\ad.robin.locksley
-
Then the query will return activity for nwxtech\ad.bruce.wayne OR nwxtech\ad.robin.locksley
Step 7 – To form a complex filter with multiple attributes, click Add to insert a new row and repeat steps 4-6. The AND operator is automatically applied to group multiple rows. For example:
-
When:
- Attribute = Perpetrator; Operator = Equals; Filter = nwxtech\domain admins
-
AND
- Attribute = Perpetrator; Operator = Not Equal to; Filter = nwxtech\ad.bruce.wayne
-
Then the query will return activity for all domain admins except nwxtech\ad.bruce.wayne
NOTE: Click the X at the end of a row to remove it from the statement.
Once the filter is set, you can generate the report ad hoc by clicking Run Query. The allows you to test if your filter statement is working as desired. Save the investigation for reuse. You can also add subscriptions or export the report data using the options above the Filters section.
See the Investigation Reports topic for additional information.
Investigation Options
Every investigation has the following options at the top of the page:
-
Edit – The Edit option opens the Save Investigation window in edit mode. You can modify the name, description, and folder of the saved investigation. If you save the investigation to a different folder, it will be moved from the original location to the new folder. You can also update the user roles granted ownership and access to the investigation report. A My Investigation can also be saved as a new Threat in the Investigation Settings page. See the Edit or Duplicate an Investigation topic for additional information.
-
Create threat – In addition to preconfigured threats, a user can create a custom threat when certain events are considered to be dangerous in the environment, for example, when one of the privileged users makes file changes. See the Custom Threatstopic for additional information.
-
Subscriptions – Click the Subscriptions link to open the Subscription to window. You can specify recipients to receive this report as an email attachment in a specified format. See the Add Subscription topic for additional information.
-
Export – The Export option provides choices for how you can export the report results for an investigation. The report can be exported in a specified format and can be downloaded, emailed, or scheduled as desired. See the Export Report topic for additional information.
-
Three vertical dot icon has the following options:
- Copy link – The Copy link option copies the URL of the investigation to your clipboard, so that you can share it with users who have access to the report
- Open as new – The Open as New option opens the investigation in Duplicate mode. The filter is the same as that of the base investigation. You can save it as a new investigation. See the Edit or Duplicate an Investigation topic for additional information.
-
Run Query – The Run Query button pulls available activity data that match the set filters and timeframe. The data is displayed on the Event Details, Events Over Time, and Top Resources tabs. See the Investigation Reports topic for additional information.
-
Filters – The Filters section provides options to build a filter statement by selecting the Attribute, Operator, and Filter value. A time period for the report data is also configured here. If multiple data sources have been configured, there is also a Source drop-down menu. See the Filters Section topic for additional information.
NOTE: For an investigations to return information on user display names, groups, or email addresses, the Active Directory Service must be running to collect Active Directory data prior to running an investigation. See the Active Directory Sync Page topic for additional information.
NOTE: For an investigation to return information on Entra ID users, groups, roles and applications, the Entra ID Service must be running to collect Entra ID data before running an investigation. See the Entra ID Sync Page topic for additional information.