Investigation Reports
Every report generated by an investigation query displays the following information:
- Event Details – Provides a view of all events matching the criteria specified for the investigation. See the Events Details Section topic for additional information.
- Events Over Time – Provides a bar graph and pie chart for events matching the criteria specified for the investigation. See the Events Over Time Section topic for additional information.
- Top Resources – Provides summary statistics for perpetrators (users) and targets (hosts) associated with the events matching the criteria specified for the investigation. See the Top Resources Section topic for additional information.
NOTE: For an investigations to return information on user display names, groups, or email addresses, the Active Directory Service must be running to collect Active Directory data prior to running an investigation. See the Active Directory Sync Page topic for additional information.
NOTE: For an investigation to return information on Entra ID users, groups, roles and applications, the Entra ID Service must be running to collect Entra ID data before running an investigation. See the Entra ID Sync Page topic for additional information.
Click Investigate in the application header bar to open the Investigations interface. Then create a new investigation or click a folder in the navigation pane to access a saved investigation. An investigation is located in the folder where it was saved.
Enter information in the Filters section, which includes one or more filter statements and a timeframe, to generate the report.
Events Details Section
The Event Details tab provides a view of all events matching the criteria specified for the investigation.
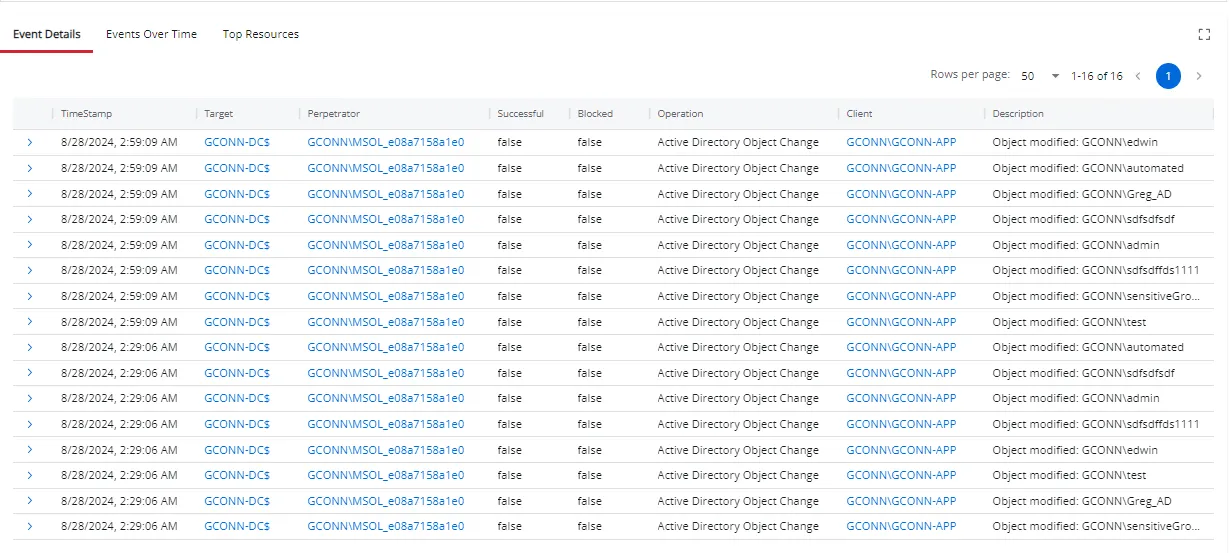
The table displays the following data:
-
TimeStamp – The exact date and time when the event occurred
-
Target – The specific object, resource, or entity that was the focus of the event. The name is in NT style [domain\computer name]. Click the link to view target details.
-
User – The name of the user in sAMAccountName format who generated the activity. Click the link to view user details.
-
Perpetrator – The name of the user, group, or entity responsible for carrying out an action. This name is in sAMAccountName format. Click the link to view perpetrator details.
-
Successful – Indicates whether the action associated with the event was successfully completed:
- True – The operation was successful
- False – The operation failed
-
Blocked – Indicates whether the operation was prevented by a security measure, such as a Netwrix agent:
- True – The operation was blocked
- False – The operation was not blocked
-
Operation – The type of activity performed
-
Client – The name of the system or entity that initiates an action or request towards a server or another system. This name is in NT style [domain\computer name]. Click the link to view client details.
-
Description – A summary of the event
Click the arrow () in the table for a specific event to view additional details.
See the Host Details Page topic and the User Details Page topic for additional information.
Events Over Time Section
The Events Over Time section displays a bar graph and pie chart for events matching the criteria specified for the investigation.
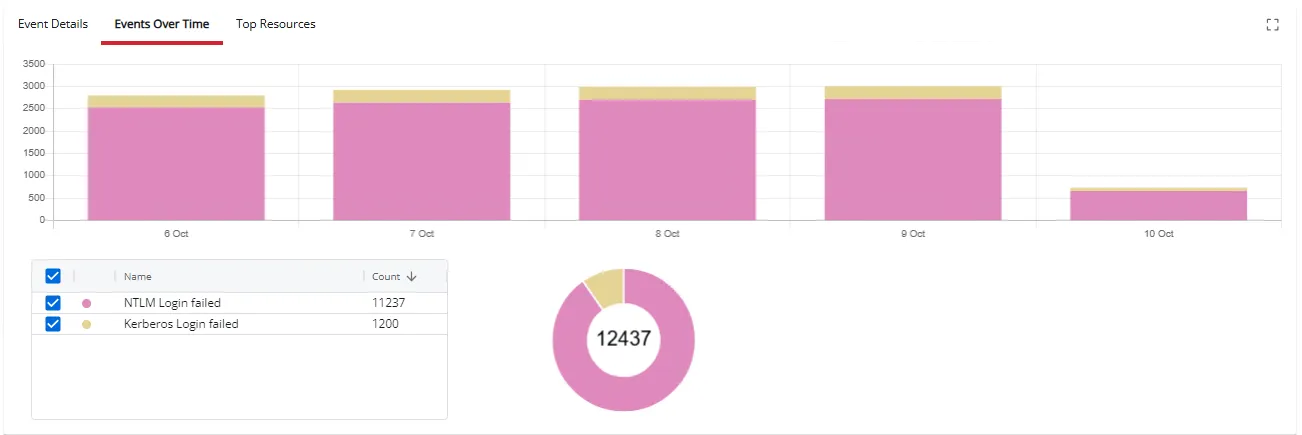
- Hover over a time period to view the type of event and number of events logged for that timeframe.
- Hover over the pie chart to view the total number of each type of event. The total number of all events is displayed in the middle of the pie chart.
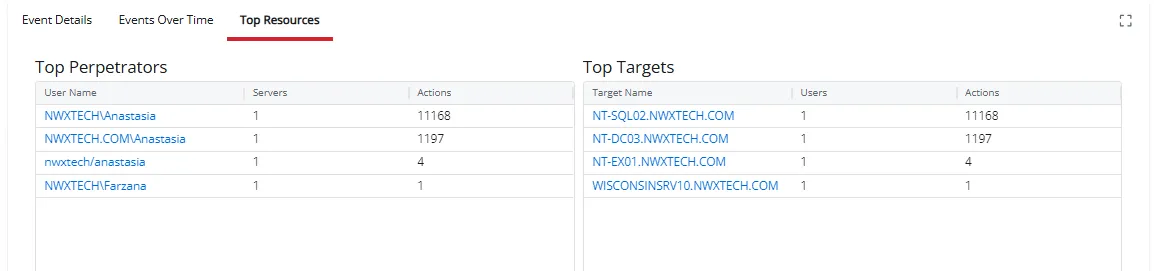
Top Resources Section
The Top Resources tab displays summary statistics for perpetrators (users) and targets (hosts) associated with the events matching the criteria specified for the investigation.
The tab contains two tables:
- Top Perpetrators
- Top Targets
Top Perpetrators Table
The Top Perpetrators table displays information about the perpetrators associated with the events.
It contains the following columns:
- User Name – The name of the user in sAMAccountName format who generated the event
- Servers – The number of servers where the user generated events
- Actions – The number of events generated by the user
Click the link to view perpetrator details.
Top Targets Table
The Top Targets table displays information about targets associated with the events.
It contains the following columns:
- Target Name – The specific object, resource, or entity that was the focus of the event. This name is in NT style [domain\computer name].
- Users – The number of users who generated events
- Actions – The number of events generated by all users on the target
Click the link to view target details.See the Host Details Page topic for additional information.