Database Maintenance Window
The database maintenance function grooms the NVMonitorData database to optimize performance. It automatically deletes or archives data aged beyond a specified threshold. The threshold can be set per Event Type, per Analytics, and/or per Policy. While all three options can be enabled with different operations and retention periods, the Event Type maintenance settings take precedence over Policy maintenance settings where the selected policy employs that event type.
Remember, See the Database Maintenance Permission details in the Database Maintenance Feature Requirements topic for additional information.
See the Stored Procedures topic for additional information on stored procedures Threat Prevention uses on its SQL Server databases.
Follow the steps to configure database maintenance.
Step 1 – Click Configuration > Database > Maintenance on the menu. The Database Maintenance window is displayed.
This window is only available to Threat Prevention administrators.
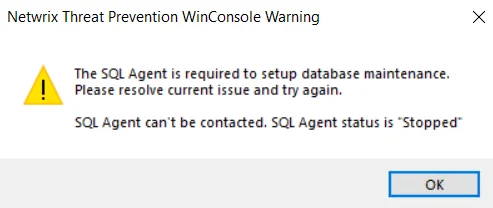
The database maintenance feature is only available if the SQL Server Agent service is running on the SQL Server host. A warning message displays instead of the Database Maintenance window if this service is not running.
To enable the service, go to Start > Administrative Tools > Services interface and start the SQL Server Agent (MSSQLSERVER).
When the SQL Server Agent service is running, the Database Maintenance window opens.
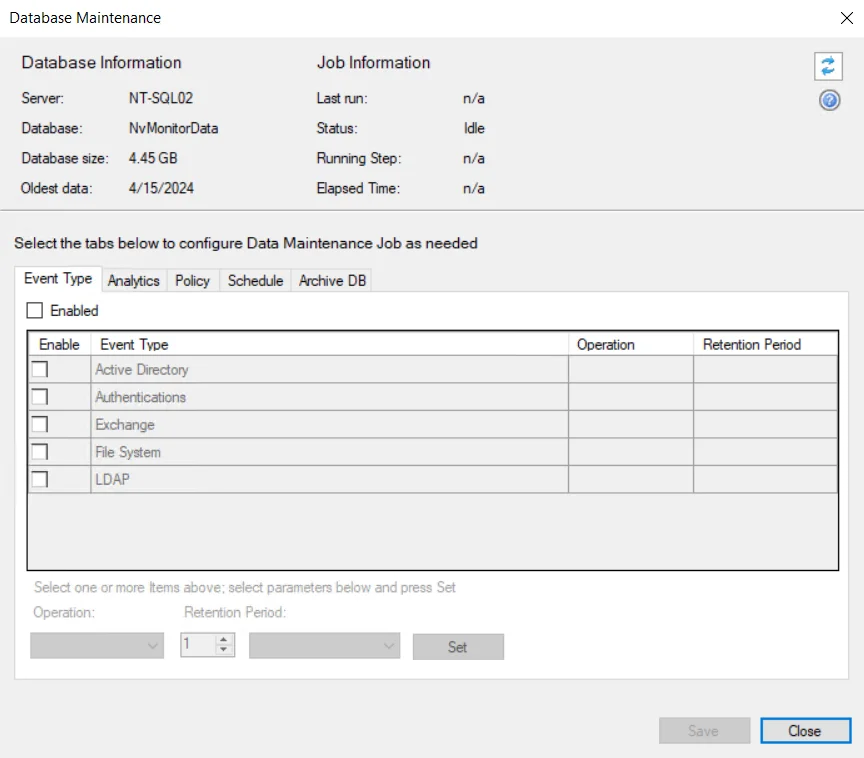
The following information is displayed at the top of the window:
- Database Information:
- Server – SQL Server where database maintenance is performed
- Database – Name of the database
- Database size – Current size of the database
- Oldest data – Date of the oldest data in the database
- Job Information:
- Last run – Date timestamp when the last database maintenance job was executed
- Status – Status of the job. Different statuses are:
- Idle – Indicates that no database maintenance task is running
- Succeeded – Indicates that the most recent job finished without error
- Running – Indicates that a job is running
- Error – Indicates that the job started but terminated on an error
- Running Step – During job execution, this field populates with the step being executed
- Elapsed Time – Overall elapsed time of job execution
The Refresh button in the upper-right corner refreshes this database and job information.
Step 2 – On the Event Type, Analytics, and/or Policy tabs, enable maintenance for all or some of the options. See the Enable Database Maintenance topic for additional information.
Step 3 – On the Schedule tab, set the frequency and time when the database maintenance job runs. See the Schedule Database Maintenance topic for additional information.
Step 4 – To use the Move operation, the information on the Archive DB tab must be configured. See the Archive Data topic for additional information.
Step 5 – Click Save to save the changes.
The SQL Server databases should be configured to use 'Simple Recovery Mode' in the SQL Server Requirements. This configuration has a direct impact on the size of the transaction log during database maintenance delete tasks. If Simple Recovery Mode is not configured on the databases, the transaction log may get quite large during delete tasks.
Event Type Tab
The Event Type tab is displayed by default when the Database Maintenance window opens.
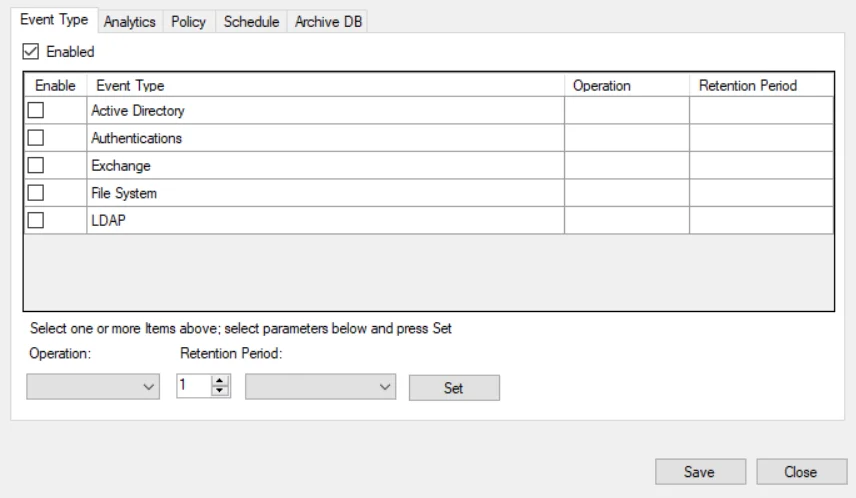
Check the Enabled box at the top to set database maintenance by event type. The table contains the following information:
- Enable – Checked box indicates database maintenance is enabled for the event type
- Event Type – Data is grouped by the following event types:
- Active Directory – Configure maintenance for all event data collected by the Active Directory Changes, Active Directory Lockdown, Active Directory Read Monitoring, AD Replication Monitoring, AD Replication Lockdown, Effective Group Membership, FSMO Role Monitoring, GPO Setting Lockdown, GPO Setting Changes, LSASS Guardian – Monitor, LSASS Guardian – Protect, and Password Enforcement Event Types
- Authentications – Configure maintenance for all event data collected by the Authentication Monitoring and Authentication Lockdown Event Types. This does not apply to Analytics policy data
- Exchange – Configure maintenance for all event data collected by the Exchange Changes and Exchange Lockdown Event Types
- File System – Configure maintenance for all event data collected by the File System Changes, File System Lockdown, and File System Enterprise Auditor Event Types
- LDAP – Configure maintenance for all event data collected by the LDAP Monitoring, LDAP Lockdown, and LDAP Bind Monitoring Event Types
- Operation – The operation set for the event type: Move (for archiving) or Delete
- Retention Period – The age of data to be retained when the database maintenance job is executed for the event type
Analytics Tab
Click the Analytics tab on the Database Maintenance window.

Check the Enabled box at the top to set database maintenance by analytic. The table contains the following information:
- Enable – Checked box indicates database maintenance is enabled for the analytic
- Analytic Name – Name of each analytic
- Operation – The operation set for the analytic: Move (for archiving) or Delete
- Retention Period – The age of data to be retained when the database maintenance job is executed for the analytic
- Incident Count – The number of incidents recorded in the database for each analytic
- Event Count – The number of events for the recorded incidents in the database for each analytic
The rows in the table can be sorted alphanumerically by the Analytic Name, Incident Count, or Event Count column.
Above the table is a cumulative count of:
- Total Incidents – The number of incidents recorded in the database for all analytics
- Total Events – The number of events for the recorded incidents in the database for all analytics
Policy Tab
Click the Policy tab on the Database Maintenance window.
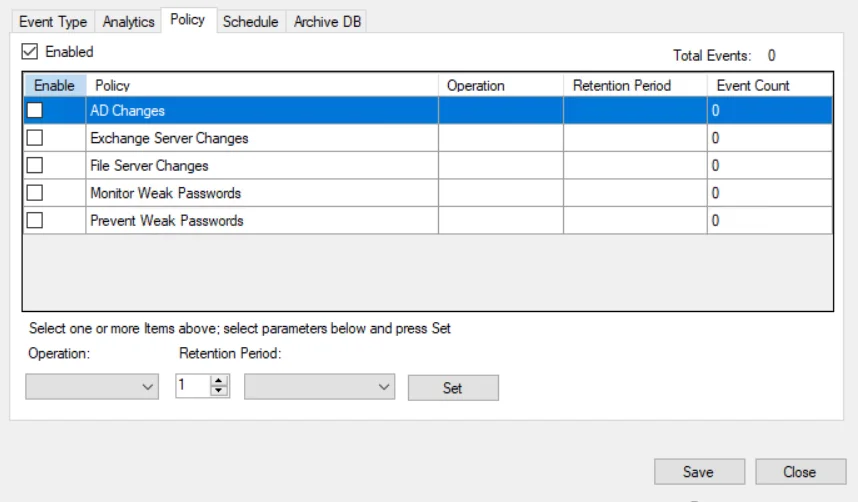
Check the Enabled box at the top to set database maintenance by policy. The table contains the following information:
- Enable – Checked box indicates database maintenance is enabled for the policy
- Policy – Name of each policy you have created. Policies are listed in alphanumeric order, first live policies (whether or not they are enabled) and then the deleted policies are listed
- Operation – The operation set for the policy: Move (for archiving) or Delete
- Retention Period – The age of data to be retained when the database maintenance job is executed for the policy
- Event Count – The number of events for the recorded incidents in the database for each policy
Above the table is a cumulative count of:
- Total Events – The number of events for the recorded incidents in the database for all policies
The rows in the table can be sorted alphanumerically by the Policy or Event Count column. Deleted policies are always listed after all other policies.