GPO Monitoring Dashboard
The GPO Monitoring dashboard contains the following cards:
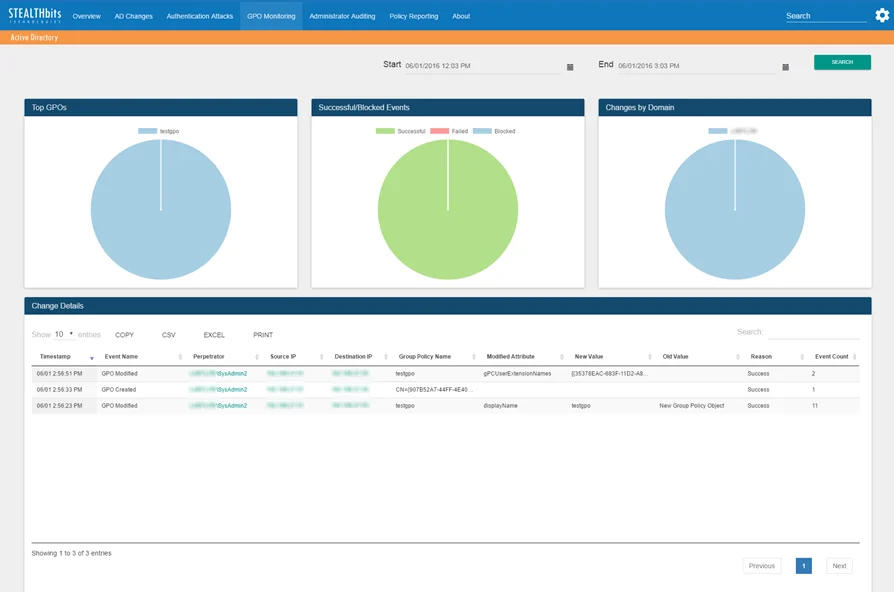
- Top GPOs – Displays up to the top five (5) Group Policy Objects related to events that have been recorded in the specified timeframe. See the Graph Card Features topic for additional information.
- Successful/Blocked Events – Breakdown of Group Policy Object changes that have been recorded in the specified timeframe by successful/failed/blocked status. See the Graph Card Features topic for additional information.
- Changes by Domain – Breakdown of Group Policy Object changes that have been recorded in the specified timeframe by domain. See the Graph Card Features topic for additional information.
- Change Details – Tabular format of all Group Policy Object change events that have been recorded in the specified timeframe. See the Table Card Features topic for additional information.
The time interval is identified in the upper-right corner with the Start and End boxes. This is set by default to the past three (3) hours. To search within a different interval, either manually type the desired date and time or use the calendar buttons to set the desired date and time interval. Then click Search to refresh the card data.
When a search using a time interval longer than twelve (12) hours is instigated, the database query is broken into multiple mini-queries. This will result in a visible reset of the dashboard display at the end of each mini-query until all data for the selected time interval has been retrieved.