Golden Ticket Analytic Type
The Golden Tickets analytic type identifies Kerberos tickets that exceed the specified maximum lifetimes for a user ticket or maximum lifetimes for a user ticket renewal. Every time an account authenticates, the ticket is checked against the maximum ticket lifetime and maximum renewals configured within this analytic type. Any ticket that exceeds either ‘maximum’ will trigger an incident.
| Golden Tickets | |
|---|---|
| Definition | Kerberos tickets with modified maximum lifetimes for a user ticket and maximum lifetimes for a user ticket renewal |
| Example | Kerberos tickets are used as a sort of “pass card” to obtain access to resources. Once a domain controller authenticates a user, a TGT (ticket granting ticket) is granted with a limited lifespan. This is then used to obtain TGS (ticket granting service) and the TGS is what identifies a user to a resource on the network. On TGT expiry, the user account is checked for validity (password, enabled/disabled, group memberships, etc.) and a new TGT is granted. A known vulnerability exists where a domain admin could forge the TGT renewal time, creating an indefinite “golden” ticket. This could be accomplished, and then the underlying account removed, allowing the user to obtain admin access forever with an account that no longer exists. If a user on the network were to attempt to use such a ticket, this analytic would detect the altered ticket and generate an alert. |
| Trigger | Maximum lifetime for a user ticket > than X hours OR Maximum lifetime for a user ticket renewal > Y days |
| Recommended Settings | Netwrix recommends configuring this analytic to trigger a hit if the maximum lifetime for a user ticket is greater than 24 hours or the maximum lifetime for a user ticket renewal is greater than 30 days. |
Analytic Workflow
- Configure the analytic policy
- Enable the analytic policy
- Enable alerting on incidents through the System Alerting Window.
See the Golden Tickets Analytic Data Grid topic for information on event data collected per incident.
Configure Golden Tickets Analytic Policy
Open the Golden Tickets Analytic Policy in any of the following ways:
- Click Analytics in the left pane to launch the Analytics interface. Then click the gear icon for the analytic.
- Expand the Analytics node and click the desired analytic. On the analytic window, click the gear icon available in the top right corner.
The Configure Analytics window has two tabs:
- Settings – Where the analytic trigger is defined
- Policy – Where filters can be added, additional actions configured, a custom schedule set, and the policy enabled
Settings Tab

Set the Maximum Lifetime for User Ticket [value] Hours and the Maximum Lifetime for User Ticket Renewal [value] Days to trigger the incident. The default Microsoft Windows lifetime for user tickets is ten hours, and the renewal period is seven days. This analytic policy will check each ticket that requests authentication against the values set in this analytic policy. Any time a ticket exceeds either of these values, an incident is triggered.
Policy Tab
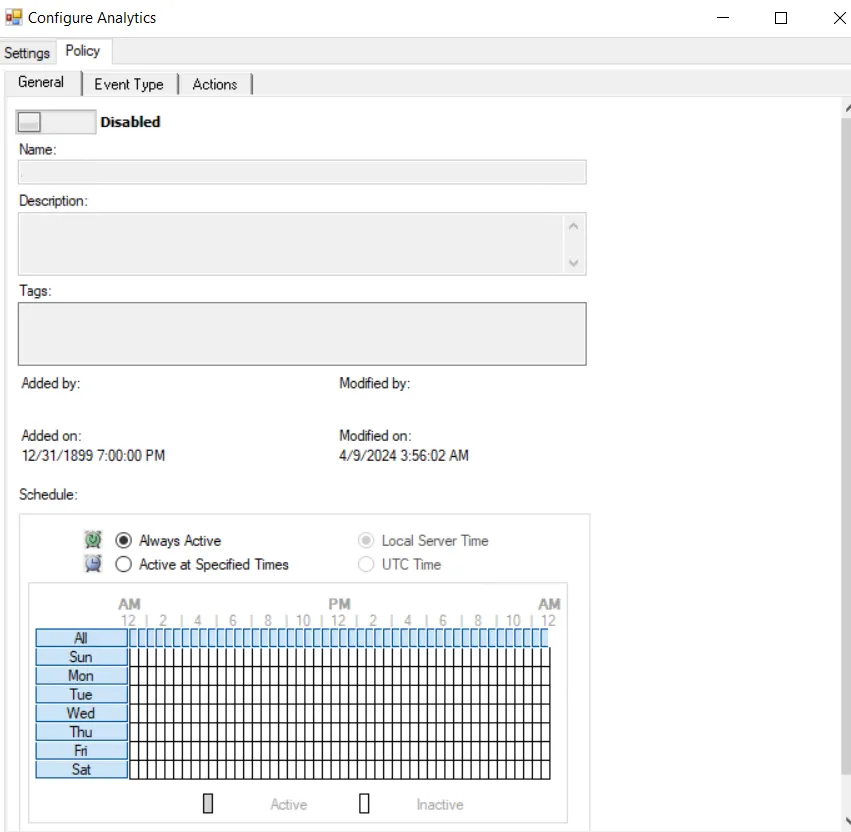
The Policy tab for configuring analytics consists of three sub-tabs:
-
General tab – Configured the same way a regular policy’s General Tab is configured. The only exception is that the Name and Description are hard coded, and cannot be modified. The Tags field is disabled for analytics.
-
Event Type tab – Configured the same way a regular policy’s Event Type Tab is configured. The only exception is that the Authentication Monitoring Event Type is hard coded, and the Success filter cannot be modified.
infoDo not configure any filters for this analytic type.
-
Optional: Scope the protocol to be monitored on the Authentication Protocol filter. If enabling the analytic on a domain controller, also scope the login type.
noteThe Exclude failed authentications with ‘N-2’ passwords option requires a GPO within the organization be configured to ‘Enforce password history’ with a setting of a minimum of ‘3 passwords remembered’ or it will not have an effect.
-
_Optional:_Scope the domains to be included in or excluded from monitoring on the Domains/Servers filter.
-
_Optional:_Scope the accounts to include in or exclude from being monitored on the AD Perpetrator filter.
-
_Optional:_Scope the servers to be included in or excluded from monitoring on the IP Addresses (from) filter, the IP Addresses (to) filter, the Hosts (from) filter, or the Hosts (to) filter.
noteSome authentication events may return only a host name (NetBIOS or FQDN), others may return only an IP address. It is recommended to take this into account when entering filter values.
-
-
Actions tab – Configured the same way a regular policy’s Actions Tab is configured. The only exceptions are that the “Send to Event DB” and “Email Notifications” options are disabled. The event data collected by analytic policies are stored in memory until an incident is triggered. For the “Send Raw Data to SIEM” option, use caution, as this will send all event data not the triggered incident, which could be a large volume of data. To send notifications on incidents, use the System Alerting Window to configure Email and SIEM alerts.
Golden Tickets Analytic Data Grid
The data grid on the Golden Tickets node lists one row per incident identified.
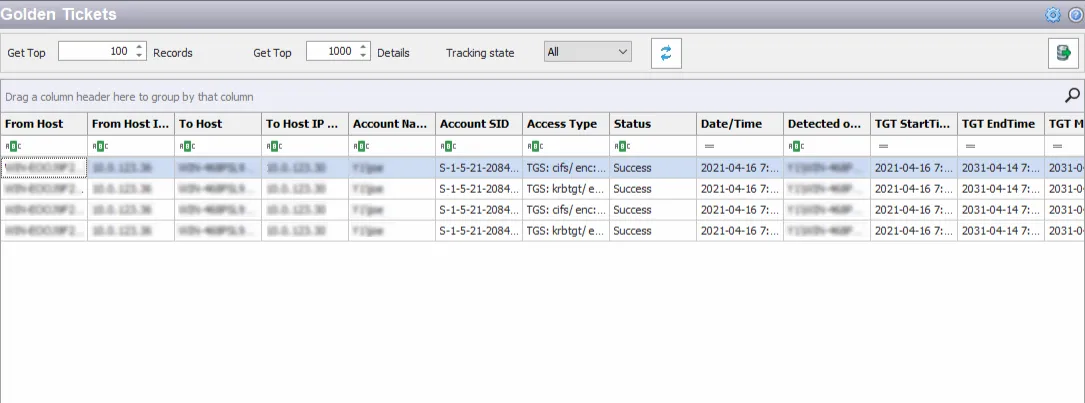
The data grid can be filtered according to the Event Tracker status: All, New, or Reviewed. See the Event Tracker Window topic for additional information.
The top data grid includes the following information for each incident:
- From Host – Name of the originating host
- From Host IP Address – IP address of the originating host
- To Host – Name of the target host
- To Host IP Address – IP address of the target host
- Account Name – Security principal of the account that triggered the incident
- Account SID – Security Identifier of the account used in the event that triggered the incident
- Access Type – Type of authentication, e.g. RDP, CIFS, etc.
- Status – Indication of whether the authentication was successful
- Date/Time – Date timestamp of the monitored event. Hover over the data in this column to view the local time (of the Enterprise Manager) and UTC time simultaneously.
- Detected on DC – Fully-qualified name of the domain controller that detected the event
- TGT StartTime – Date timestamp for the start time of the ticket; the specified time is the local time for the server where the Agent is deployed
- TGT EndTime – Date timestamp for the expiration time of the ticket; the specified time is the local time for the server where the Agent is deployed
- TGT MaxRenew – Date timestamp for the maximum renewal date of the ticket; the specified time is the local time for the server where the Agent is deployed
- Agent Time Logged – Timestamp for when the Agent detected the event. This can be different from the Enterprise Manager time (displayed in the Date/Time column) due to latency.
This data grid employs features for sorting, filtering, searching, and more. See the Data Grid Functionality topic for additional information.