User Account Hacking Analytic Type
The User Account Hacking analytic type identifies multiple bad passwords provided for a given valid user account in the specified time interval.
Configure a subset of accounts to be monitored in order to avoid the excessive volume of event activity from monitoring all accounts.
| User Account Hacking | |
|---|---|
| Definition | Repeated failed logins below lockout thresholds and/or over extended periods |
| Example | Malware or a bad actor on the network is attempting to compromise an account by guessing the account’s password repeatedly until access is granted. To circumvent built-in lockout policies in Active Directory, the malware or bad actor will only guess so many times before backing off, making sure not to lockout the account. After a period of time has expired, it will continue its routine until the password is guessed correctly. This type of attack is easily automated using a script. The quiet nature of this type of attack often results in the attack going undetected. *The Enterprise Admin account (SID ending in -500) in Active Directory cannot be locked out making it vulnerable to hacking and eventual breach. While Active Directory will show the account is locked out on the object itself, as soon as the correct password is supplied, the account will be automatically unlocked, giving the perpetrator “God-rights” to the enterprise. |
| Trigger | (X1 failed login attempts from an individual user account in Y1 minutes) OR (X2 failed login attempts from an individual user account in Y3 minutes) OR … |
| Recommended Settings | Set the number of attempts 1 or 2 increments below the organization’s Active Directory lockout policy settings. |
Analytic Workflow
- Configure the analytic policy
- Enable the analytic policy
- Enable alerting on incidents through the System Alerting Window.
See the User Account Hacking Analytic Data Grid topic for information on event data collected per incident.
Configure User Account Hacking Analytic Policy
Open the User Account Hacking Analytic Policy in any of the following ways:
- Click Analytics in the left pane to launch the Analytics interface. Then click the gear icon for the analytic.
- Expand the Analytics node and click the desired analytic. On the analytic window, click the gear icon available in the top right corner.
The Configure Analytics window has two tabs:
- Settings – Where the analytic trigger is defined
- Policy – Where filters can be added, additional actions configured, a custom schedule set, and the policy enabled
Settings Tab

Set the Number of Failed Logins and the Interval Duration to trigger the incident. The interval duration is set for (hours:minutes) and is capped at 23:59. When the specified number of failed logins have occurred for an individual user account within the specified interval duration, it will trigger an incident record.
By default, authentication event data is cached in memory for 24 hours. When an incident is triggered, an incident record is saved to the database along with the events that triggered the incident. Raw authentication event data that did not contribute to an incident are purged from memory once they are more than 24 hours old.
- Click the Add (+) button to include additional triggers conditions. If any of the specified conditions are met, it will trigger an incident. For example, one trigger condition can be set to generate an incident if there are 5 Failed Logins during an interval of 1 minutes, and another trigger condition can be set to generate an incident if there are 10 Failed Logins during an interval of 30 minutes. If either condition is met, an incident is triggered.
- Use the Remove (x) button to remove trigger conditions.
The Configure Accounts link will redirect you to the Policy > Event Type > AD Perpetrator filter.
If checked, the Ignore failed logins for unresolved user names option will exclude bad user IDs from contributing to User Account Hacking incidents.
Policy Tab
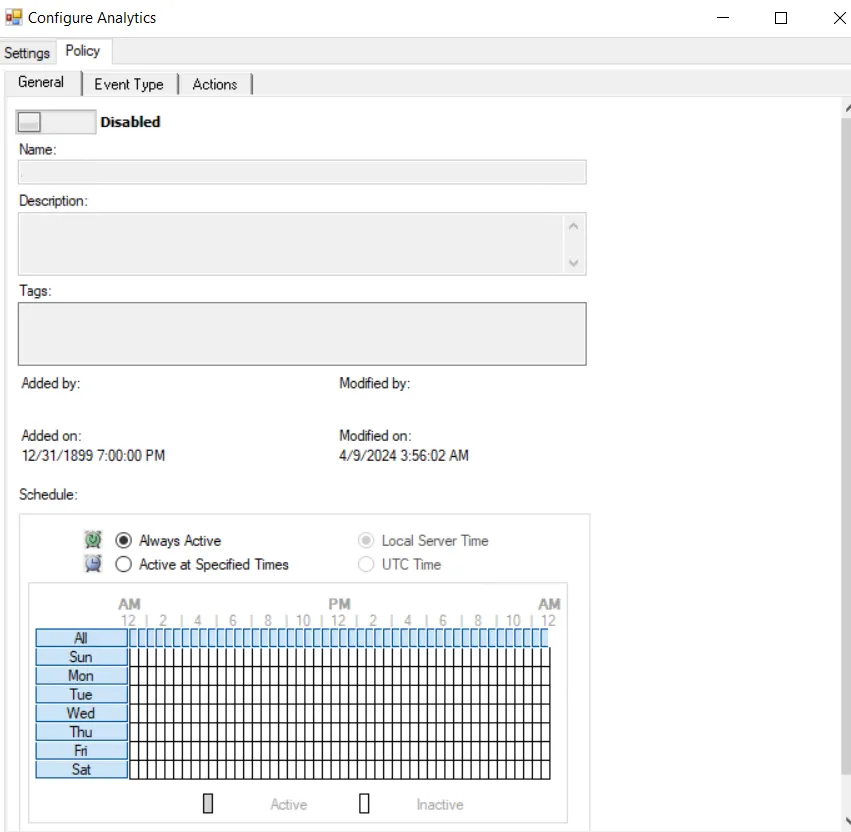
The Policy tab for configuring analytics consists of three sub-tabs:
-
General tab – Configured the same way a regular policy’s General Tab is configured. The only exception is that the Name and Description are hard coded, and cannot be modified. The Tags field is disabled for analytics.
-
Event Type tab – Configured the same way a regular policy’s Event Type Tab is configured. The only exception is that the Authentication Monitoring Event Type is hard coded, and the Success filter cannot be modified.
-
Scope the accounts to include in or exclude from being monitored on the AD Perpetrator filter.
-
Optional: Scope the protocol to be monitored on the Authentication Protocol filter. If enabling the analytic on a domain controller, also scope the login type.
noteThe Exclude failed authentications with ‘N-2’ passwords option requires a GPO within the organization be configured to ‘Enforce password history’ with a setting of a minimum of ‘3 passwords remembered’ or it will not have an effect.
-
Optional: Scope the domains to be included in or excluded from monitoring on the Domains/Servers filter.
-
Optional: Scope the servers to be included in or excluded from monitoring on the IP Addresses (from) filter, the IP Addresses (to) filter, the Hosts (from) filter, or the Hosts (to) filter.
noteSome authentication events may return only a host name (NetBIOS or FQDN), others may return only an IP address. It is recommended to take this into account when entering filter values.
-
-
Actions tab – Configured the same way a regular policy’s Actions Tab is configured. The only exceptions are that the “Send to Event DB” and “Email Notifications” options are disabled. The event data collected by analytic policies are stored in memory until an incident is triggered. For the “Send Raw Data to SIEM” option, use caution, as this will send all event data not the triggered incident, which could be a large volume of data. To send notifications on incidents, use the System Alerting Window to configure Email and SIEM alerts.
User Account Hacking Analytic Data Grid
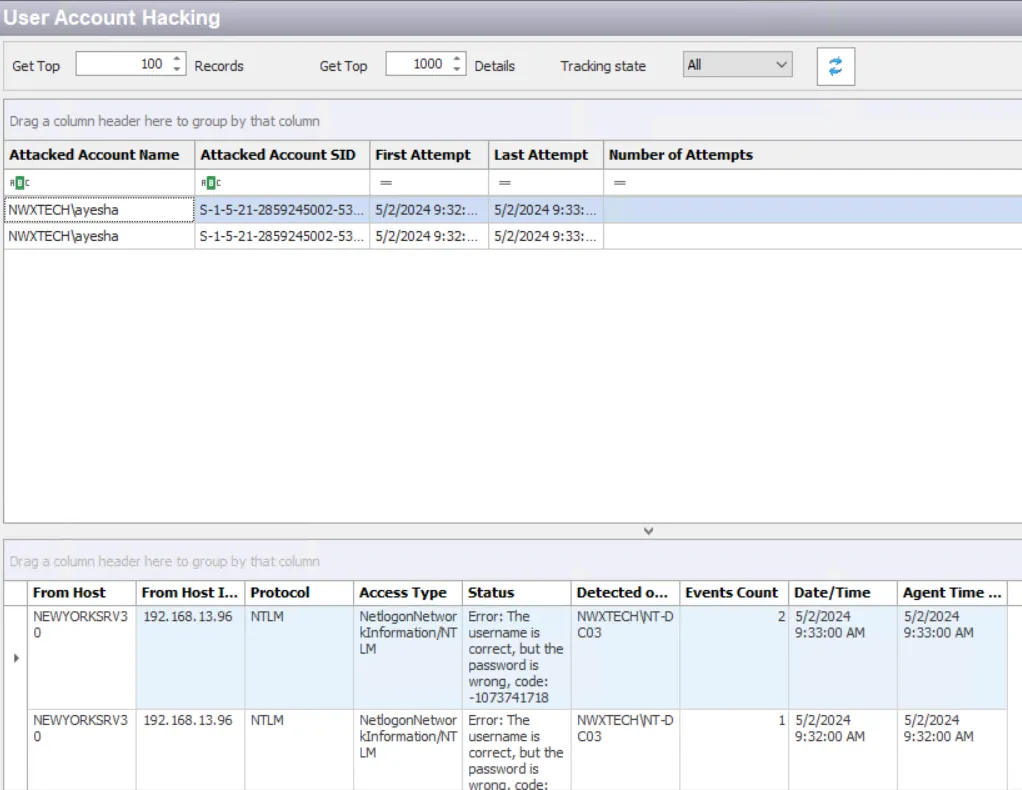
The data grid on the User Account Hacking node lists one row per incident identified.
The data grid can be filtered according to the Event Tracker status: All, New, or Reviewed. See the Event Tracker Window topic for additional information.
The top data grid includes the following information for each incident:
-
Attacked Account Name – Security principal of the account that triggered the incident
noteThe name will be red if the attacking account is the Administrator account.
-
Attacked Account SID – Security Identifier of the account used in the event
-
First Attempt – Date timestamp of the first monitored event that triggered the incident. Hover over the data in this column to view the local time (of the Enterprise Manager) and UTC time simultaneously.
-
Last Attempt – Date timestamp of the last event that triggered the incident. Hover over the data in this column to view the local time (of the Enterprise Manager) and UTC time simultaneously.
-
Number of Attempts – Number of attempts monitored during the specified interval matching this rule
Select an incident in the top data grid to view information on the events that triggered the incident:
- From Host – Name of the originating host
- From Host IP Address – IP address of the originating host
- Protocol – Protocol(s) used for the monitored operation
- Access Type – Type of authentication, e.g. RDP, CIFS, etc.
- Status – Detailed information on the error generated by the event
- Detected on DC – Fully-qualified name of the domain controller that detected the event
- Events Count – Number of identical events that occurred in one minute
- Date/Time – Date timestamp of the monitored event. Hover over the data in this column to view the local time (of the Enterprise Manager) and UTC time simultaneously.
- Agent Time Logged – Timestamp for when the Agent detected the event. This can be different from the Enterprise Manager time (displayed in the Date/Time column) due to latency.
This data grid employs features for sorting, filtering, searching, and more. See the Data Grid Functionality topic for additional information.