Investigate Data Grid
Events are displayed in the data grid on the Investigate interface.
Follow the steps to view events in the data grid.
Step 1 – Click Investigate in the left pane to launch the Investigate interface.
Step 2 – To expand the grid view, do either of the following:
- Collapse the individual filter category sections
- Use the arrow between the filter categories and the grid view to collapse the entire filter category section
Step 3 – Select the Production or Archive option button to view events from the respective database.
The archive database is part of the Threat Prevention Database Maintenance feature and it can only be queried from the Administration Console. See the Archive Data topic for additional information.
Step 4 – Use the Get Top [number] Events box to specify the number of events to be displayed.
Step 5 – Check the For Each Policy checkbox to view the specified number of events on a per policy basis. If unchecked, the specified number of events displayed are solely based on the time the event was logged.
Step 6 – Use the Refresh button to repopulate the data grid with the current information for the selected options.
The Show All Columns link automatically adds any columns to the data grid that are currently hidden from view.
Each column in the data grid has a prefix identifying the type of information displayed. Double-click a populated grid column to access the Event Viewer Window with detailed information on the event. The columns display the following information for each event:
-
Event: Policy Name – Policy which monitored or blocked the event
-
Event: Time Logged – Timestamp for when the event was monitored/blocked. The specified time is the local time for the server where the Agent is deployed.Hover over the data in this column to view the local time (of the Enterprise Manager) and UTC time simultaneously.
-
Event: UTC Time Logged – UTC Timestamp for when the event was monitored/blocked by the Agent. Hover over the data in this column to view the local time (of the Enterprise Manager) and UTC time simultaneously.
-
Affected Object: Path – Name of the affected object according to the type of monitoring/blocking
- Active Directory monitoring/blocking – Active Directory distinguished name for the affected object
- Effective Group Membership monitoring – Active Directory distinguished name for the affected group. A double asterisk (**) at the beginning indicates that the path is to the nested group where the actual membership change occurred.
- Exchange monitoring/blocking – Name of the affected Exchange mailbox
- File System monitoring/blocking – Original path of the affected file or folder
- Authenticate – DN of the user object making the request
noteFor LDAP bind/monitoring/blocking, Affected Object Path is not used
-
Agent: Domain – Active Directory domain where the Agent that monitored/blocked the event is deployed
-
Affected Object: Class – Active Directory class of the affected object
-
Event: Type – Identifies the type of monitoring/blocking, e.g. Active Directory, File System, Exchange
-
Event: Raw Name – Short description of the monitored operation
-
Perpetrator: DN – Distinguished name for the perpetrator account
-
Agent: Computer – Server where the Agent is deployed
-
Agent: IP Address – IP address of the server where the Agent is deployed
-
Perpetrator: Access URL – Raw data, the combination of the protocol, IP address, and the Port used as part of the event
- LSASS Guardian monitoring/blocking – Process name that is modifying or attempting to modify LSASS
-
Event: Success – Indicates the event completed successfully
-
Event: Blocked – Indicates the Agent blocked the event from occurring
-
Affected Object SID – Security Identifier of the object/account affected by the event
-
Affected Object: Account Name – Security principal of the account affected by the event
-
Affected Object GUID – The globally unique identifier of the object affected by the event
-
Event: Name – Type of event monitored/blocked
-
Perpetrator: Name – Security principal of the account that triggered the event
-
Perpetrator: SID – Security Identifier of the account used in the event
-
Perpetrator: Protocol – Protocol used for the monitored operation
- File System monitoring/blocking – Name of the share where the operation was monitored/blocked. It will be blank if the affected host has an operating system older than Windows Server 2008 R2.
-
Perpetrator: IP Address – IP address of the originating host
- File System monitoring/blocking – It will be blank if the affected host has an operating system older than Windows Server 2008 R2.
-
Perpetrator: MAC Address – Network adapter identifier
-
Perpetrator: Host – Name of the originating host
-
Affected Object: IP Address – IP address of the host where the affected object resides
-
Affected Object: Host – Name of the host the security principal is trying to access
-
Event: Message – Result of the attempted operation
-
Event: Count – Number of identical events that occurred in one minute
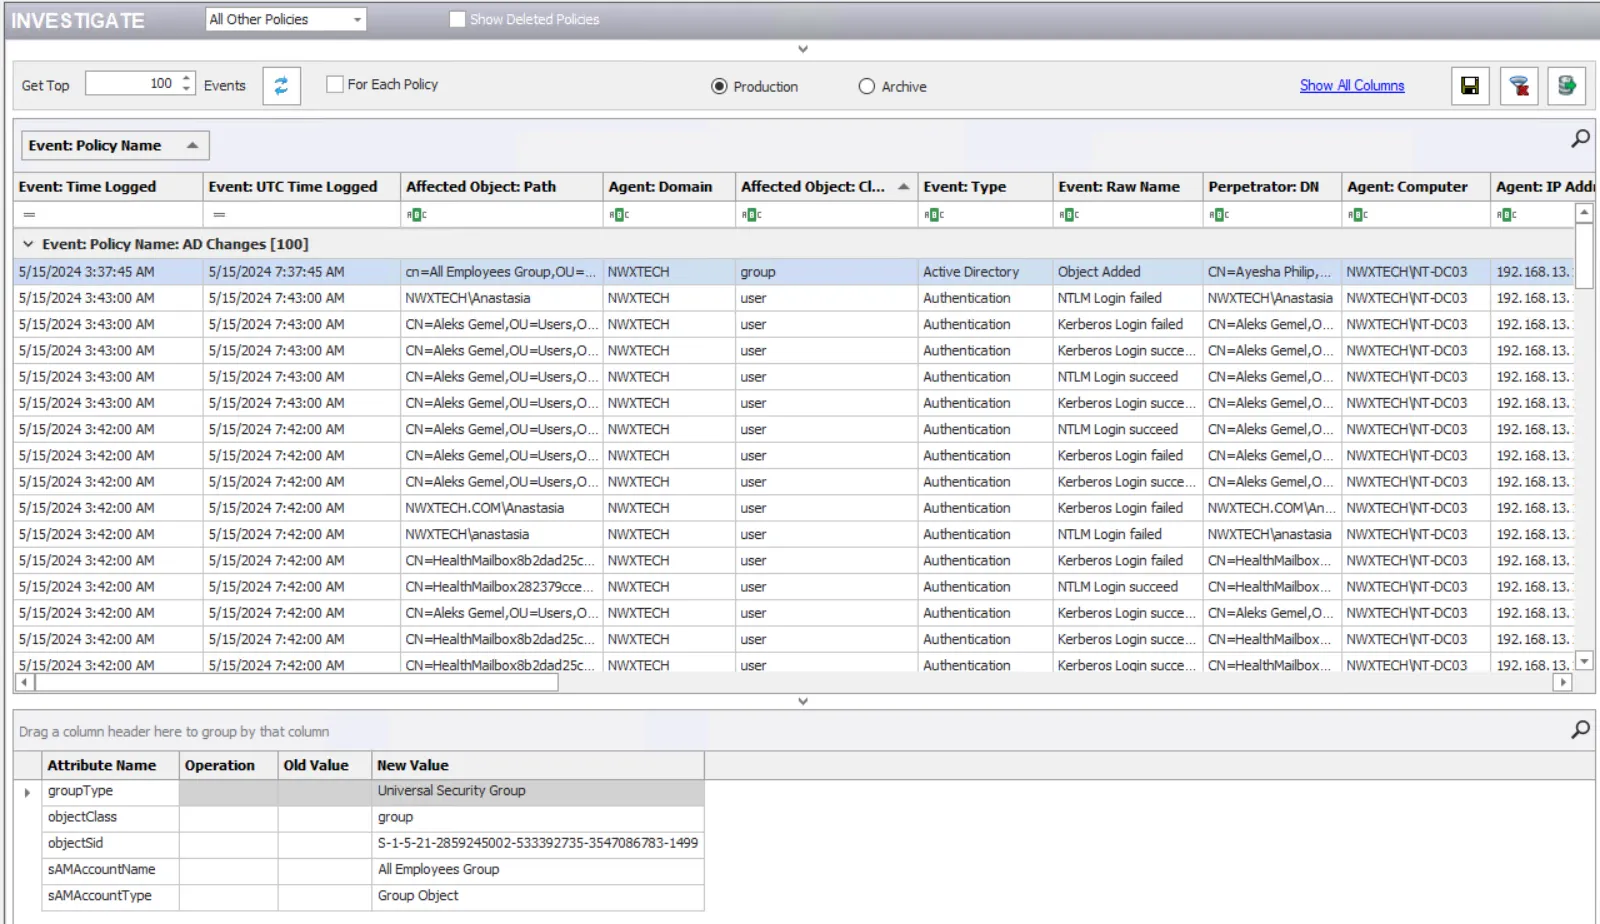
Select an event in the data grid to view additional information for it at the bottom of the Investigate interface.

The following information (as applicable to the event) is displayed:
- Attribute Name – The name of the object attribute that is affected
- Operation – The operation performed on the attribute
- Old Value – Value prior to the monitored change
- New Value – Value after the monitored change
This data grid employs features for sorting, filtering, searching, and more. See the Data Grid Functionality topic for additional information.
To export the data displayed in the grid to a CSV file, see the Export Data topic.