Recent Events Tab
The Recent Events tab provides information on the events that have been recently monitored or blocked by the selected policy. See the Investigate Interface for recent events monitored or blocked by all policies. You can also view event data configured to be sent to syslog (SIEM) on the SIEM Output Viewer window.
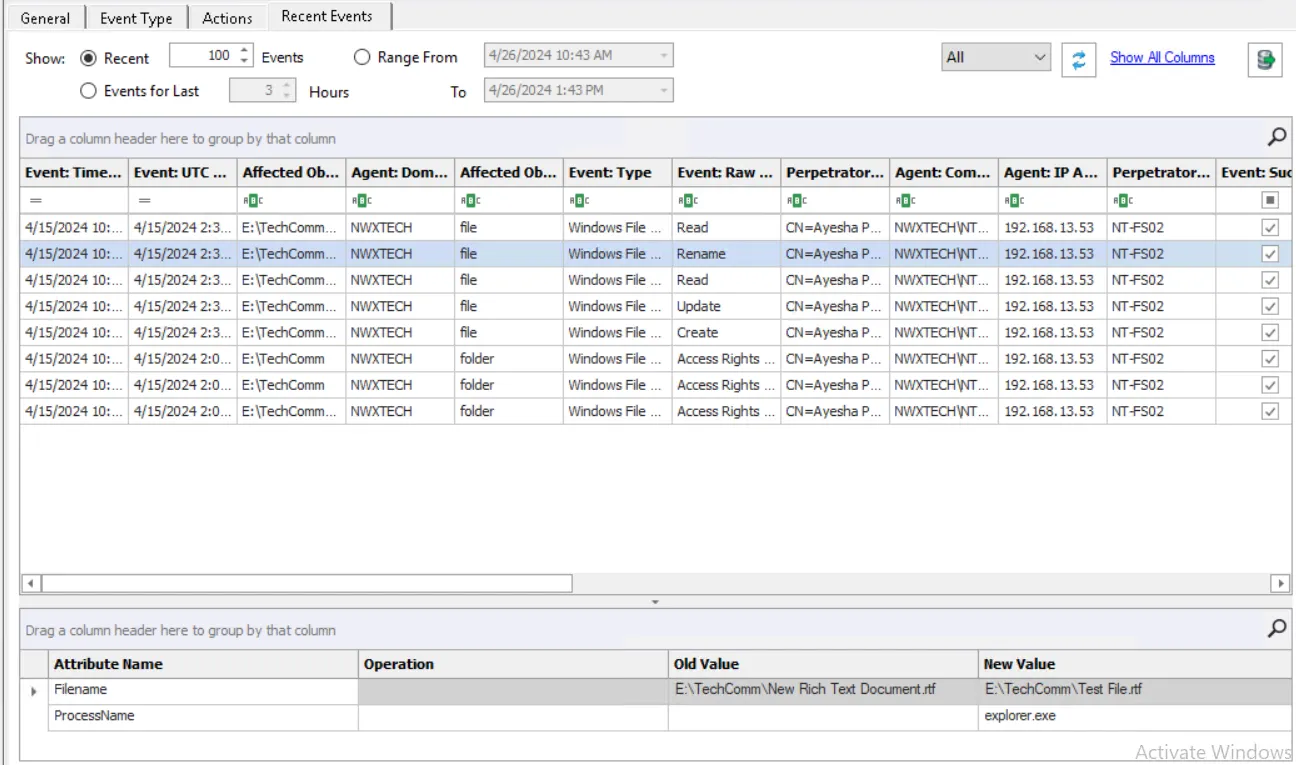
The Recent Events tab has the following options on the toolbar:
- Recent [number] Events – Populates the data grid with the most recent events from the active policy. Use the textbox to change the default number, i.e., 100.
- Events for Last [number] Hours – Populates the data grid with hourly events. Use the textbox to change the default number of hours, i.e., 3.
- Range From/To – Displays the events that occurred within the given timeframe
- Refresh button – Updates the grid with any new events
- Show All Columns – Resets hidden columns to their default location on the data grid
- Export Data– Opens the Export Data window with export actions and options. See the Export Data topic for additional information.
Example for the Events for Last [number] Hours Option
Below is an example of how to use the Events for Last [number] Hours option:
The number of hours set is based on UTC and is adjusted for the time zones of the Administration Console server and the Agent that is monitoring the events. Let's assume the following:
- The Administration Console server is in New York, USA (UTC -5)
- The option is set to display events for Last 4 Hours
- The Agent that is monitoring the events is in London, UK (UTC +0)
If you click the Refresh button at noon New York time, then the events displayed would have been generated between 8 A.M. and 12 P.M. New York time, or between 1 P.M. and 5 P.M. London time.
The data grid can be filtered according to the Event Tracker Status:
- All
- New
- Reviewed
See the Event Tracker Window topic for additional information.
Recent Events Data Grid
The data grid on the Recent Events tab includes the following information for each event, listed below in the default order of the data grid columns:
-
Event: Time Logged – Timestamp for when the event was monitored/blocked. The specified time is the local time for the server where the Agent is deployed. Hover over the data in this column to view the local time (of the Enterprise Manager) and UTC time simultaneously.
-
Event: UTC Time Logged – UTC Timestamp for when the event was monitored/blocked by the Agent. Hover over the data in this column to view the local time (of the Enterprise Manager) and UTC time simultaneously.
-
Affected Object: Path – Name of the affected object according to the type of monitoring/blocking
- Active Directory monitoring/blocking – Active Directory distinguished name for the affected object
- Effective Group Membership monitoring – Active Directory distinguished name for the affected group. A double asterisk (**) at the beginning indicates that the path is to the nested group where the actual membership change occurred.
- Exchange monitoring/blocking – Name of the affected Exchange mailbox
- File System monitoring/blocking – Original path of the affected file or folder
- Authenticate – DN of the user object making the request
NOTE: For LDAP bind/monitoring/blocking, Affected Object Path is not used
-
Agent: Domain – Active Directory domain where the Agent that monitored/blocked the event is deployed
-
Affected Object: Class – Active Directory class of the affected object
-
Event: Type – Identifies the type of monitoring/blocking, e.g. Active Directory, File System, Exchange
-
Event: Raw Name – Short description of the monitored operation
-
Perpetrator: DN – Distinguished name for the perpetrator account
-
Agent: Computer – Server where the Agent is deployed
-
Agent: IP Address – IP address of the server where the Agent is deployed
-
Perpetrator: Access URL – Process name that is modifying or attempting to modify LSASS
- LSASS Guardian monitoring/blocking – Security principal of the account affected by the event
-
Event: Success – Indicates the event completed successfully
-
Event: Blocked – Indicates the Agent blocked the event from occurring
-
Affected Object: SID – Security Identifier of the object/account affected by the event
-
Affected Object: Account Name – Security principal of the account affected by the event
-
Affected Object: GUID – The globally unique identifier of the object affected by the event
-
Event: Name – Type of event monitored/blocked
-
Perpetrator: Name – Security principal of the account that triggered the event
-
Perpetrator: SID – Security Identifier of the account used in the event
-
Perpetrator: Protocol – Protocol used for the monitored operation
- File System monitoring/blocking – Name of the share where the operation was monitored/blocked. It will be blank if the affected host has an operating system older than Windows Server 2008 R2.
-
Perpetrator: IP Address –IP address of the originating host
- File System monitoring/blocking – It will be blank if the affected host has an operating system older than Windows Server 2008 R2.
-
Perpetrator: MAC Address – Network adapter identifier
-
Perpetrator: Host – Name of the originating host
-
Affected Object: IP Address – IP address of the host where the affected object resides
-
Affected Object: Host – Name of the host the security principal is trying to access
-
Event: Message – Result of the attempted operation
-
Event: Count – Number of identical events that occurred in one minute
Select an event to view additional information about it.

The following information (as applicable to the event) is displayed:
- Attribute Name – The name of the object attribute that is affected
- Operation – The operation performed on the attribute
- Old Value – Value prior to the monitored change
- New Value – Value after the monitored change
This data grid employs features for sorting, filtering, searching, and more. See the Data Grid Functionality topic for additional information.
Recent Events Right-Click Menu
Right-click on a row in the data grid to open the right-click menu.

- Copy – Copies the selected data cell to clipboard
- Event Viewer – Opens the Event Viewer Window for the selected event/data row
- Event Tracker – Opens the Event Tracker Window for the selected event/data row
- Execute PS Script – Opens a Windows Explorer window to the scripts folder. Enables users to run a PowerShell script for the selected event/data row.