Breached Password Analytic Type
The Breached Password analytic type identifies multiple failed authentications followed by a successful authentication in the specified time frame.
| Breached Password | |
|---|---|
| Definition | Multiple failed authentications followed by a successful authentication |
| Example | This analytic alert may follow one or more alerts identifying repeated failed authentications against an account. This alert is of special importance as it signals that an attacked account may have been breached and a successful login occurred. This could also identify a scenario where an attacker has attempted multiple authentications with a user’s account but has failed, and then after that, the real user logs in and authenticates successfully. |
| Trigger | X failed authentication attempts from the same account followed by a successful authentication in Y hours |
| Recommended Settings | Netwrix recommends configuring this analytic to trigger a hit if Threat Prevention monitors at least 30 failed authentication attempts from the same account followed by a successful authentication in 4 hours. |
Analytic Workflow
- Configure the analytic policy
- Enable the analytic policy
- Enable alerting on incidents through the System Alerting Window.
See the Breached Password Analytic Data Grid topic for information on event data collected per incident.
Configure Breached Password Analytic Policy
Open the Breached Password Analytic Policy in any of the following ways:
- Click Analytics in the left pane to launch the Analytics interface. Then click the gear icon for the analytic.
- Expand the Analytics node and click the analytic you want. On the analytic window, click the gear icon available in the top right corner.
The Configure Analytics window has two tabs:
- Settings – Where you define the analytic trigger
- Policy – Where you add filters, configure additional actions, set a custom schedule, and enable the policy
Settings Tab

Set the Number of Failed Attempts preceding a successful login and the Interval Duration that triggers the incident. The interval duration uses (Hours:Minutes) and is capped at 23:59. When the specified number of failed login attempts for an individual user account precede a successful login within the specified interval duration, Threat Prevention triggers an incident record.
By default, Threat Prevention caches authentication event data in memory for 24 hours. When an incident triggers, Threat Prevention saves an incident record to the database along with the events that triggered the incident. It purges raw authentication event data that didn't contribute to an incident from memory once that data is more than 24 hours old.
Policy Tab
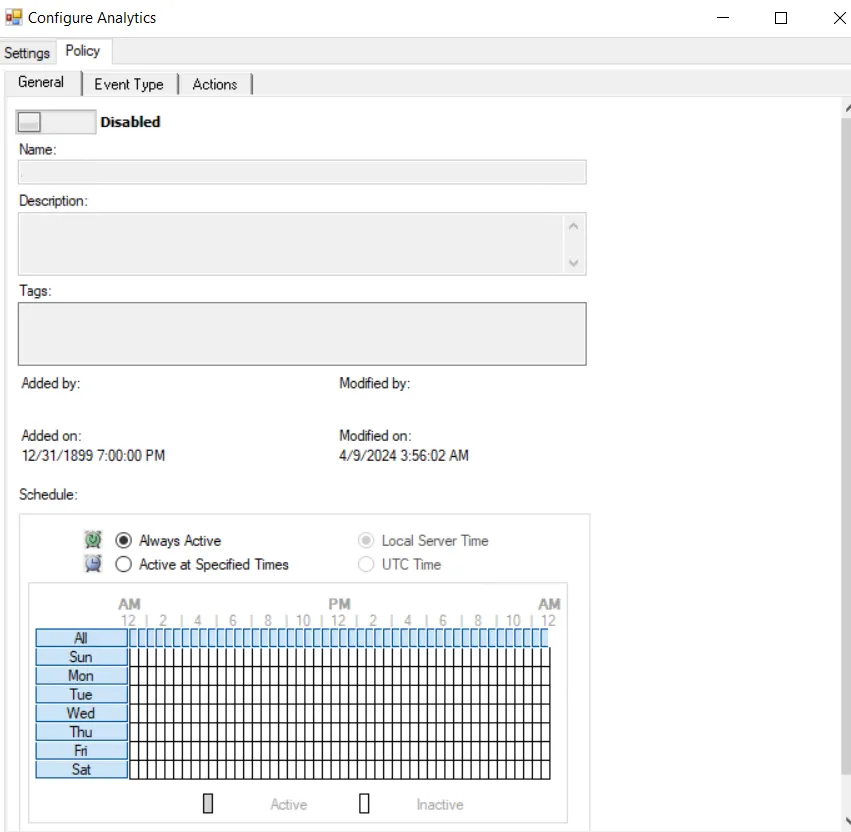
The Policy tab for configuring analytics consists of three sub-tabs:
-
General tab – Configured the same way a regular policy’s General Tab is configured. The only exception is that the Name and Description are hard coded, and can't be modified. The Tags field is disabled for analytics.
-
Event Type tab – Configured the same way a regular policy’s Event Type Tab is configured. The only exception is that the Authentication Monitoring Event Type is hard coded, and the Success filter can't be modified.
-
Scope the protocol to monitor on the Authentication Protocol filter. If you enable the analytic on a domain controller, also scope the login type.
noteThe Exclude failed authentications with ‘N-2’ passwords option requires a GPO within the organization configured to ‘Enforce password history’ with a setting of a minimum of ‘3 passwords remembered’. Otherwise, the option has no effect.
-
Optional: Scope the domains to include in or exclude from monitoring on the Domains/Servers filter.
-
Optional: Scope the accounts to include in or exclude from monitoring on the AD Perpetrator filter.
-
Optional: Scope the servers to include in or exclude from monitoring on the IP Addresses (from) filter, the IP Addresses (to) filter, the Hosts (from) filter, or the Hosts (to) filter.
noteSome authentication events may return only a host name (NetBIOS or FQDN), others may return only an IP address. Take this into account when entering filter values.
-
-
Actions tab – Configured the same way a regular policy’s Actions Tab is configured. The only exceptions are that the “Send to Event DB” and “Email Notifications” options are disabled. Analytic policies store the event data they collect in memory until an incident triggers. Use caution with the “Send Raw Data to SIEM” option, as it sends all event data rather than the triggered incident, which could be a large volume of data. To send notifications on incidents, use the System Alerting Window to configure Email and SIEM alerts.
Breached Password Analytic Data Grid
The data grid on the Breached Password node lists one row per incident identified.
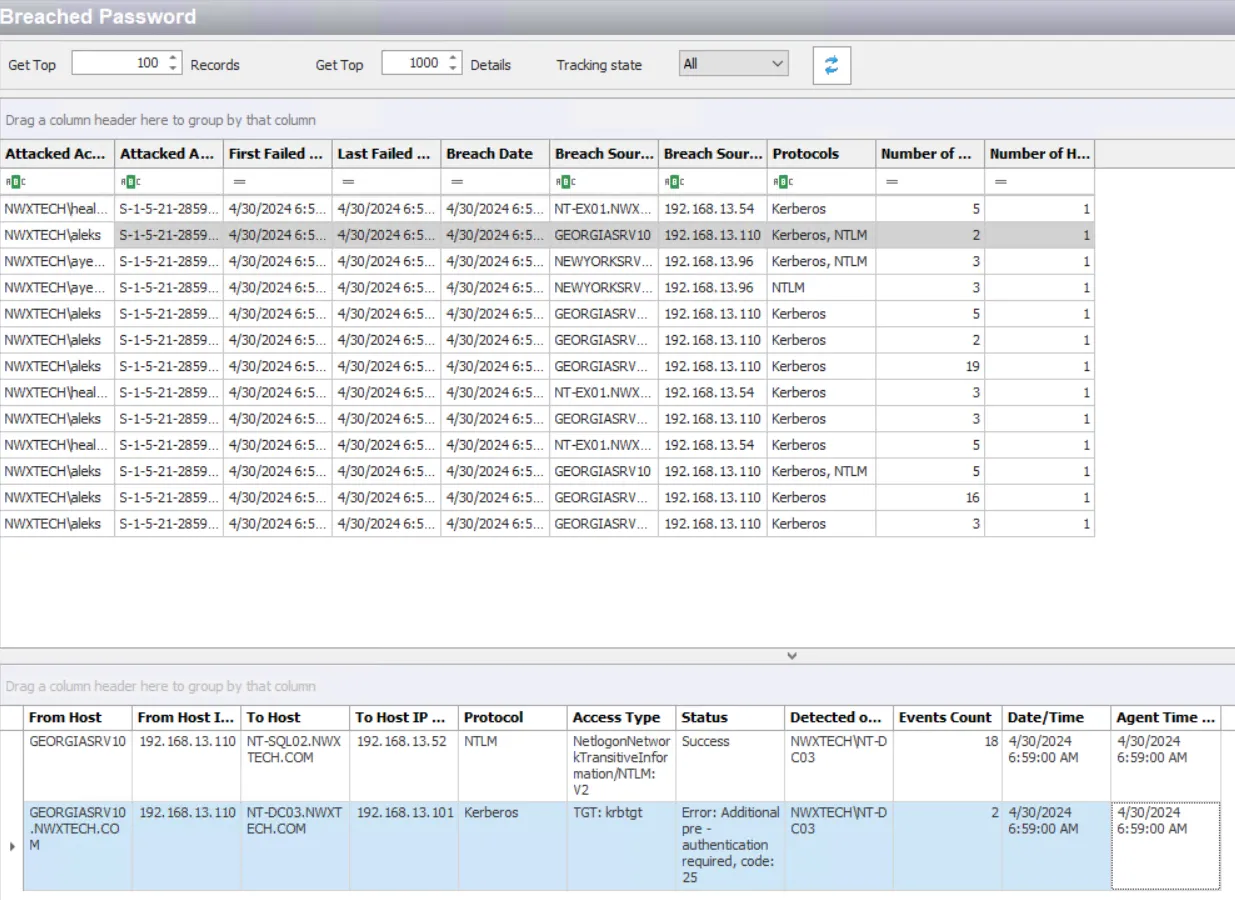
You can filter the data grid according to the Event Tracker status: All, New, or Reviewed. See the Event Tracker Window topic for additional information.
The top data grid includes the following information for each incident:
-
Attacked Account Name – Security principal of the account affected by the event
noteThe name displays in red if the attacking account is the Administrator account.
-
Attacked Account SID – Security Identifier of the attacked account used in the event
-
First Failed Attempt – Date timestamp of the first monitored event that triggered the incident. Hover over the data in this column to view the local time (of the Enterprise Manager) and UTC time simultaneously.
-
Last Failed Attempt – Date timestamp of the last event that triggered the incident. Hover over the data in this column to view the local time (of the Enterprise Manager) and UTC time simultaneously.
-
Breach Date – Date timestamp of the first monitored event that succeeded. Hover over the data in this column to view the local time (of the Enterprise Manager) and UTC time simultaneously.
-
Breach Source Host – Name of the originating host
-
Breach Source Host IP Address – IP address of the originating host
-
Protocols – Protocols used for the monitored operation
-
Number of Attempts – Number of attempts monitored during the specified interval matching this rule
-
Number of Hosts – Number of hosts accessed during the specified interval matching this rule
Select an incident in the top data grid to view information on the events thath triggered the incident:
- From Host – Name of the originating host
- From Host IP Address – IP address of the originating host
- To Host – Name of the target host
- To Host IP Address – IP address of the target host
- Protocol – Protocols used for the monitored operation
- Access Type – Type of authentication, e.g. RDP, CIFS, etc.
- Status – Detailed information on the error generated by the event
- Detected on DC – Fully-qualified name of the domain controller that detected the event
- Events Count – Number of identical events that occurred in one minute
- Date/Time – Date timestamp of the monitored event. Hover over data in this column to view Local time (of the Enterprise Manager) and UTC time simultaneously.
- Agent Time Logged – Timestamp for when the Agent detected the event. This can be different from the Enterprise Manager time (displayed in the Date/Time column) due to latency.
This data grid employs features for sorting, filtering, searching, and more. See the Data Grid Functionality topic for additional information.