File System Attacks (by User) Analytic Type
The File System Attacks (by user) analytic type identifies activity where a significant number of file changes made by an account occurred in a short time period. Threat Prevention monitors only the paths you select. You MUST configure at least one path to enable this analytic. Selected paths are specific to the server you selected them for.
You can configure the analytic to lock down the monitored file system resource from ‘perpetrators’ who trigger an incident. This feature is only available on Windows file systems.
| File System Attacks (by user) | |
|---|---|
| Definition | Significant number of file changes made by an account in a short time period. Optionally block the perpetrator that triggers an incident by selecting the Enable Automatic Lockdown option. |
| Example | Malware or a bad actor is attempting to delete/modify (such as encrypt) or copy large numbers of files residing locally or on the network, to prevent access to or steal file system data. In the case of a ransomware attack, end user files are typically targeted (such as documents, spreadsheets, presentations, etc.), which is followed by a warning to pay a ransom or the files will be erased. This analytic will identify unusual/abnormally high levels of file activity in a short timeframe, and trigger a file system attack alert as a result. |
| Trigger | X number of files changed by an account in Y minutes |
| Recommended Settings | Netwrix recommends configuring this analytic to trigger a hit if Threat Prevention monitors 500 files affected in 3 minutes. |
Analytic Workflow
- Configure the analytic policy
- Enable the analytic policy
- Enable alerting on incidents through the System Alerting Window.
See the File System Attacks (by User) Analytic Data Grid topic for information on event data collected per incident.
Configure File System Attacks (by User) Analytic Policy
Open the File System Attacks (by user) Analytic Policy in any of the following ways:
- Click Analytics in the left pane to launch the Analytics interface. Then click the gear icon for the analytic.
- Expand the Analytics node and click the analytic you want. On the analytic window, click the gear icon available in the top right corner.
The Configure Analytics window has two tabs:
- Settings – Where you define the analytic trigger
- Policy – Where you add filters, configure additional actions, set a custom schedule, and enable the policy
Settings Tab

Set the Number of Accessed Files and the Interval Duration that triggers the incident. The interval duration uses (Hours:Minutes) and is capped at 1:00. When a particular user causes the specified number of file changes to occur within the specified interval duration, Threat Prevention triggers an incident record.
By default, Threat Prevention caches file event data in memory for 1 hour. When an incident triggers, Threat Prevention saves an incident record to the database along with the events that triggered the incident. It purges raw file event data that didn't contribute to an incident from memory once that data is more than 1 hour old.
After an incident triggers, the next event resets the interval timer. Threat Prevention continues to add event data to the incident until the incident closes. An incident only closes once no additional file event data arrives within the specified timeframe.
You can configure the File System Attacks (by user) Analytic Policy to automatically block perpetrators who trigger an incident. Check the Enable Automatic Lockdown box and click Save. This adds the File System Lockdown Event Type to the analytic policy. After you enable this feature, the Modify Lockdown Perpetrators link redirects you to the Policy > Event Type: File System Lockdown > AD Perpetrator (for Lockdown) filter. As incidents occur, Threat Prevention adds perpetrators of the triggering events to the AD Perpetrators (for Lockdown) filter list and blocks them from initiating future events.
Policy Tab for Monitoring Only
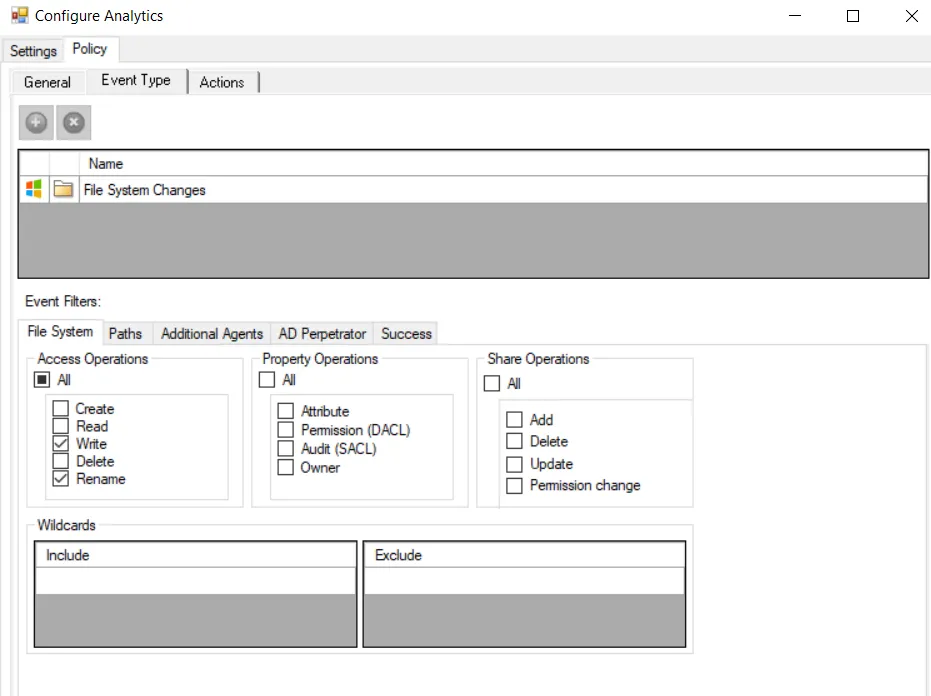
The Policy tab for configuring analytics consists of the following sub-tabs:
-
General tab – Configured the same way a regular policy’s General Tab is configured. The only exception is that the Name and Description are hard coded, and can't be modified. The Tags field is disabled for analytics.
-
Event Type tab – Configured the same way a regular policy’s Event Type Tab is configured. For monitoring only, it contains the File System Changes event type. The only exception is that the Success filter can't be modified.
-
Required: Configure the File System Paths filter for Paths and Path Collections. This analytic requires that you specify at least one path for file system location monitoring. You can include and exclude multiple paths and/or collections, along with the option to monitor sub-folders.
tipIf you don't provide a path, an error message displays when you enable the analytic policy: The “File System Analytic” policy must have at least one path to monitor defined.
-
Optional: Scope the operations to monitor on the File System filter. By default, Threat Prevention monitors Write and Rename operations.
infoDon't scope to include Read operations due to the quantity of files read within an organization.
-
Optional: Scope the monitoring Agents to use for monitoring on the Additional Agents filter.
-
Optional: Scope the accounts to include in or exclude from monitoring on the AD Perpetrator filter.
-
-
Actions tab – Configured the same way a regular policy’s Actions Tab is configured. The only exceptions are that the “Send to Event DB” and “Email Notifications” options are disabled. Analytic policies store the event data they collect in memory until an incident triggers. Use caution with the “Send Raw Data to SIEM” option, as it sends all event data rather than the triggered incident, which could be a large volume of data. To send notifications on incidents, use the System Alerting Window to configure Email and SIEM alerts.
Policy Tab for Monitoring & Lockdown
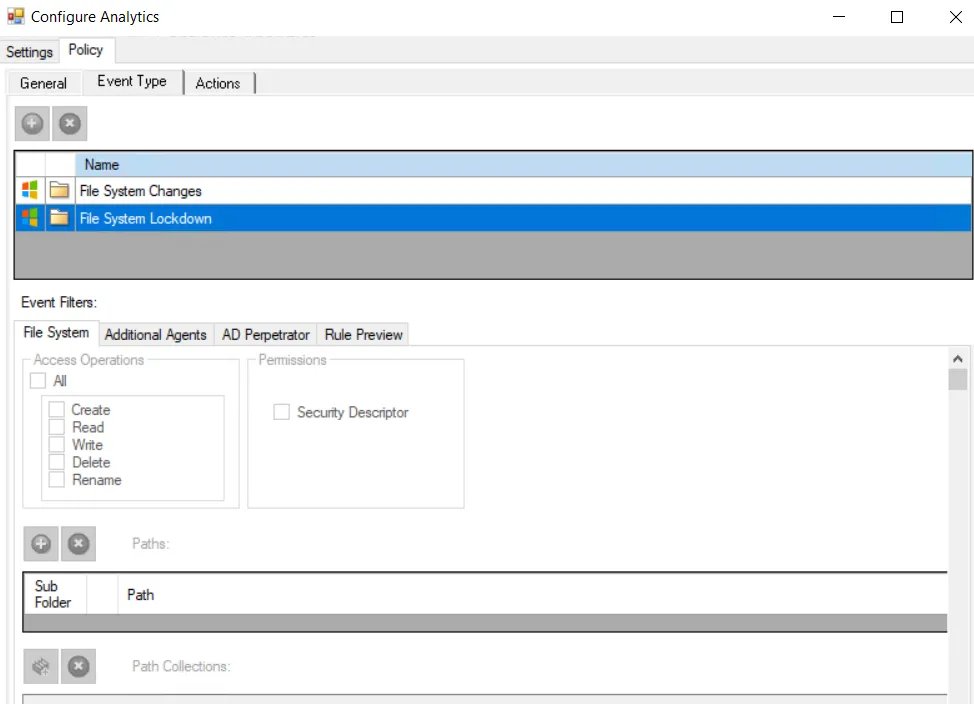
When the Enable Automatic Lockdown option is selected on the Settings tab, the Policy tab > Event Type tab includes both the File System Lockdown Event Type and the File System Changes Event Type.
The Policy tab for configuring analytics consists of the following sub-tabs:
-
General tab – Configured the same way a regular policy’s General Tab is configured. The only exception is that the Name and Description are hard coded, and can't be modified. The Tags field is disabled for analytics.
-
Event Type tab – Configured the same way a regular policy’s Event Type Tab is configured. It contains both the File System Lockdown Event Type and the File System Changes Event Type. The only exception is that for the Lockdown Event Type, the File System filter is hard coded to mirror the configuration of the File System Changes Event Type settings.
-
Optional: Scope the monitoring Agents to use for monitoring on the Additional Agents filter.
-
The AD Perpetrator filter for Lockdown auto-populates with perpetrators of the triggering events. The list is hard coded as a ‘blocking’ list rather than an ‘allow’ list.
-
Optional: Scope the accounts to block additional perpetrators.
-
Optional: Remove blocked accounts from the list.
noteThreat Prevention may automatically re-add perpetrators you manually removed from the list if they trigger another incident
-
-
-
Actions tab – Configured the same way a regular policy’s Actions Tab is configured. The only exceptions are that the “Send to Event DB” and “Email Notifications” options are disabled. Analytic policies store the event data they collect in memory until an incident triggers. Use caution with the “Send Raw Data to SIEM” option, as it sends all event data rather than the triggered incident, which could be a large volume of data. To send notifications on incidents, use the System Alerting Window to configure Email and SIEM alerts.
File System Attacks (by User) Analytic Data Grid
The data grid on the File System Attacks (by user) node lists one row per incident identified.
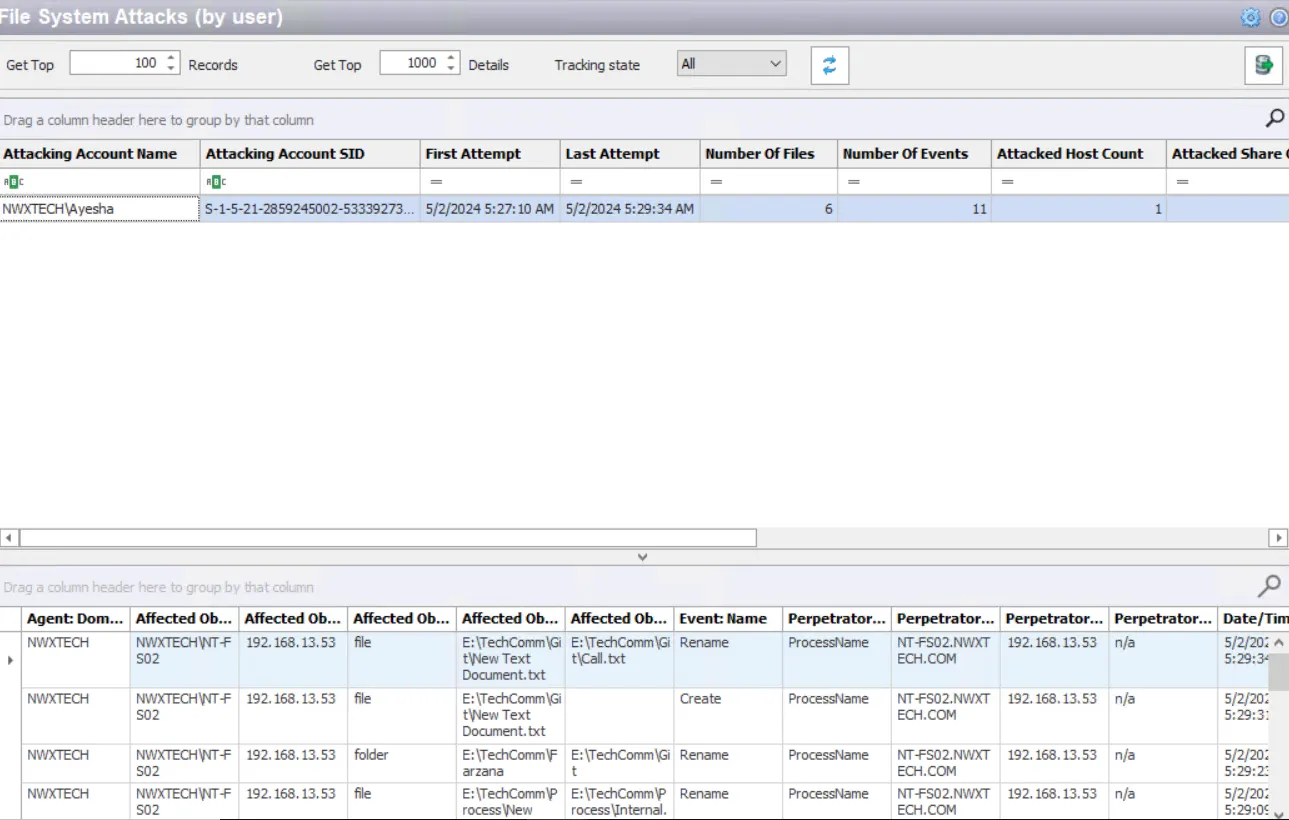
You can filter the data grid according to the Event Tracker status: All, New, or Reviewed. See the Event Tracker Window topic for additional information.
The top data grid includes the following information for each incident:
-
Attacking Account Name – Security principal of the account that triggered the incident
noteThe name displays in red if the attacking account is the Administrator account.
-
Attacking Account SID – Security Identifier of the account used in the event
-
First Attempt – Date timestamp of the first monitored event Hover over the data in this column to view the local time (of the Enterprise Manager) and UTC time simultaneously.
-
Last Attempt – Date timestamp of the last event that triggered the incident Hover over the data in this column to view the local time (of the Enterprise Manager) and UTC time simultaneously..
-
Number of Files – Number of affected files monitored, sum of both the events which triggered the incident and the events that have occurred before the incident closes
-
Number of Events – Number of events monitored, sum of both the events which triggered the incident and the events that have occurred before the incident closes
-
Attacked Host Count – Number of hosts accessed during the specified interval matching this rule , sum of both the events that triggered the incident and the events that have occurred before the incident closes
-
Attacked Share Count – Number of affected shares monitored, sum of both the events which triggered the incident and the events that have occurred before the incident closes
-
Primary Attacked Host – Name of the target host with the highest number of events at the time the incident was triggered. It doesn't update after the incident is triggered.
-
Primary Attacked Share – Name of the affected share on the primary attacked host with the highest number of events at the time the incident was triggered. It doesn't update after the incident is triggered.
-
Primary Attacked Folder – Name of the affected folder on the primary attacked share with the highest number of events at the time the incident was triggered. It doesn't update after the incident is triggered.
Select an incident in the top data grid to view information on the events that triggered the :
- Agent: Domain – Active Directory domain where the Agent that monitored/blocked the event is deployed
- Affected Object: Host – Name of the host the security principal is trying to access
- Affected Object: IP Address – IP address of the host where the affected object resides
- Affected Object: Class – Active Directory class of the affected object and indicates if the event occurred against a file or folder
- Affected Object: Path – Original path of the affected file or folder
- Affected Object: New Path – New path of the affected file or folder
- Event: Name – Type of event monitored/blocked. The event name will be red if the event was blocked by the auto-blocking feature.
- Perpetrator: Process Name – Identifies remotely accessed objects with “system” or the name of process for locally accessed objects
- Perpetrator: Host – Name of the originating host
- Perpetrator: IP Address – IP address of the originating host. It will be blank if the affected host has an operating system older than Windows Server 2008 R2.
- Perpetrator: Protocol – Name of the share where the operation was monitored/blocked. It will be blank if the affected host has an operating system older than Windows Server 2008 R2.
- Date/Time – Date timestamp of the monitored event. Hover over the data in this column to view the local time (of the Enterprise Manager) and UTC time simultaneously.
- Agent Time Logged – Timestamp for when the Agent detected the event. This can be different from the Enterprise Manager time (displayed in the Date/Time column) due to latency.
This data grid employs features for sorting, filtering, searching, and more. See the Data Grid Functionality topic for additional information.