Policy Reporting Dashboard
Use the Policy Reporting dashboard to view Threat Prevention events from any enabled policy that is sending events to Splunk. The Policy dropdown menu in the upper-left corner of the dashboard lists all the enabled Threat Prevention policies sending event data to Splunk in alphanumeric order. When you select a policy, the dashboard cards load the event data from that policy.
The Policy Reporting dashboard contains the following cards:
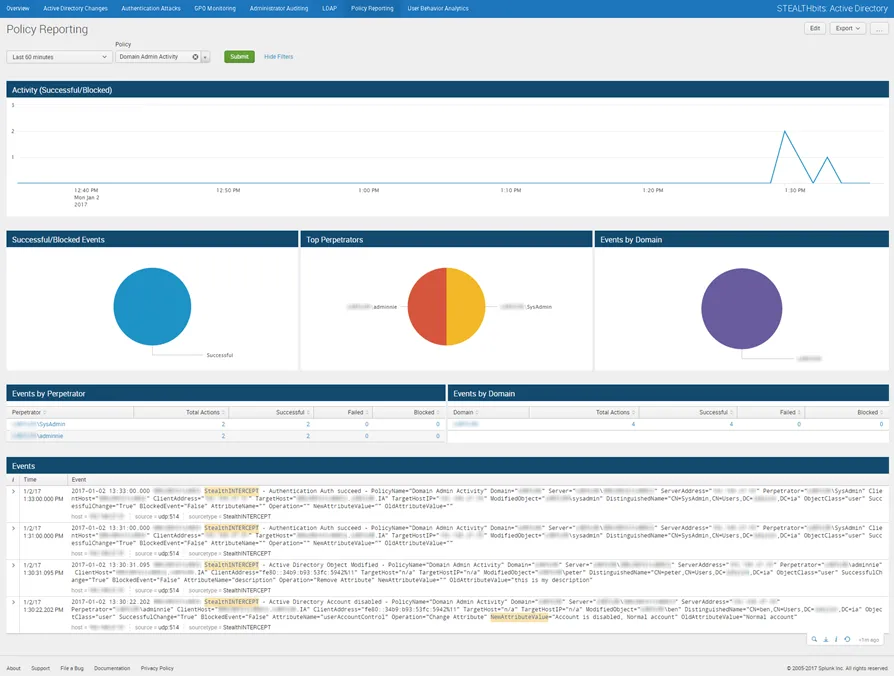
- Activity (Successful/Blocked) – Timeline of successful/failed/blocked events related to the selected policy that have been recorded in the specified timeframe
- Successful/Blocked Events – Breakdown of events related to the selected policy that have been recorded in the specified timeframe by successful/failed/blocked status
- Top Perpetrators – Displays up to the top five (5) usernames related to the selected policy that have been recorded in the specified timeframe
- Events by Domain – Breakdown of events related to the selected policy that have been recorded in the specified timeframe by domain
- Events by Perpetrator – Tabular format of all usernames related to the selected policy for events that have been recorded in the specified timeframe
- Events by Domain – Tabular format of all domains related to the selected policy for events that have been recorded in the specified timeframe
- Events – Tabular format of all events related to the selected policy that have been recorded in the specified timeframe
The specified timeframe defaults to the last 24 hours, or past day.